
actually the Clairton accent and is rarely heard around the Pittsburgh area any-
more. However, when that accent was more frequently heard, it did make you
want to run the other way.
Proof that the accent is almost extinct is simple. First, call to mind Jeff Goldblum,
Michael Keaton, Denis Miller, the late Gene Kelly, Barbara Feldman (the original
Agent 99), the late Andy Warhol, Academy Award winter Shirley Jones, singing
sensation Jackie Evancho, Super Bowl champion Joe Montana, Heisman Trophy
winner Tony Dorsett, NY Jet sensation Curtis Martin, Jack Dodson (the actor who
played Howard Sprague on Andy of Mayberry), best selling author Rachel Carson,
Mr Rogers, Julie Benz of Buffy the Vampire Slayer fame, and other celebrities.
Now, do or did any of them speak in the infamous Pittsburgh accent which is ac-
tually the Clairton accent? ANS: No. Of couse not. Case closed. The infamous
Pittsburgh accent is almost extinct. Let us continue:
Pittsburgh Pennsylvania, the region where three major rivers converge, is the site of:
-the world's first wire cable suspension bridge. -the world's first continuous roll
printing press. -the world's first Ferris Wheel's design (the original was put
on display in Chicago, for the first time.) -mankind's first long distance use of
alternating current electricity. -mankind's first motion picture theater, located
on Smithfield Street. -mankind's first commercial radio station, namely KDKA
Radio. -America's first drive-thru gasoline station (petrol station), located on the
corner of Baum Boulevard and St Clair Street. -the first utilization of air brakes.
-America's first major league base ball stadium, in the form of Forbes Field. -the
first road map ever distributed by an oil company; namely Gulf Oil.
&
-the Western Hemisphere's first successful oil refinery, located on Seventh Avenue,
-the first indoor zoo, in the form of the Pittsburgh National Aviary. -the first build-
ing constructed with liquid-fireproofed columns, namely the U.S. Steel Tower.
-the invention of the game of Bingo, originally called Beano. -the world's first pro-
duction of commercial aluminum. -the first all-aluminum shelled skyscraper, in the
form of the Alcoa Building. -the first atomic submarine engine (constructed for the
U.S.S. Nautilus), -the first use of Daylight Savings Time, -the first Zippo Lighters.
&
-the world's first nuclear reactor, in the form of the Shippingport Plant. - the first
public TV station, in the form of WQED TV. -the polio vaccine. -the world's first
retractable arena roof, namely the Pittsburgh Civic Arena. -the first university sky-
scraper, namely the Univ of Pittsburgh's Cathedral of Learning which continues to
be the tallest academic building in the Western Hemisphere. -the first combination
liver, heart, and kidney transplant. -the world's first robotics institute, as well as the
home of:
&
---Five Pulitzer Prize winners, ---movie icon Gene Kelly, ---baseball icon Stan Musial,
---baseball icon Honus Wagner, ---music icon Henry Mancini, ---environmentalist and
author of Silent Spring, Rachel Carson, ---Gertrude Stein, ---Billy Eckstein, ---Andy
Warhol, ---Mr. Rogers, --- academy award winner Shirley Jones, ---Michael Keaton,
---Jeff Goldblum, ---comedian Dennis Miller, ---comedian Marty Allen, ---the original
Candid Camera traffic cop, Vic Cianca, whom I once met, ---recording artist Perry
Como, ---recording artist Bobby Vinton, ---recording artist George Benson, ---TV
game show host Bill Cullen, ---the original Agent 99 (Barbara Feldon), ---Andy of
Mayberry's Howard Sprague (Jack Dodson,) ---the original Riddler (Frank Gorshin,
of the televised Batman series), ---World Series champion manager, Terry Francona,
--- numerous NFL standouts such as -Dan Marino, -Joe Montana, -Heisman Trophy
winner Tony Dorsett, -Oakland Raider legend George Blanda, -Jet running back
Curtis Martin, -Jet super bowl quarterback Joe Namath, -all-pro lineman Jimbo
Covert, -all-pro lineman Bill Fralic, -Super Bowl coach, Bill Cowher, -Super
Bowl coach, Mike Ditka, --- and others.
Plus, there's an underground aquifer called the Wisconsin Glacial Flow, located
54 feet below. It extends throughout various Southwestern Pennsylvanian areas.
 |
| The historic and renovated Smithfield Street Bridge |
Conway Yards (located 21 miles northwest of downtown Pittsburgh) was the
largest push button railroad in the world.
 |
| A surrealistic city preserved in plate glass. If you don't realize to what this refers, look at the reflection in the plate glass. |
when it came to the construction of the Brooklyn Bridge, the George Washing-
ton Bridge, the Chrysler Building, the Empire State Building, and the Golden
Gate Bridge, as well as its own buildings. Of course, Bethlehem Steel, in the
eastern sector of Pennsylvania, also supplied steel to the aforesaid architectural
icons.

 |
| River boats docked at the Monongahela at night. |
the year when Pittsburgh won the World Series and the Super Bowl. Ironical-
ly, in 1985, when the Pittsburgh steel industry was being destroyed, and when
the United States became the top debtor nation on earth, Pittsburgh was once
again declared the most livable city in the United States.
A couple decades later, in 2007, Rand-McNally again declared Pittsburgh the
most livable city in America, as did the Economist Magazine in 2009 and 2010.
Forbes Magazine would then declare Pittsburgh the most livable American city
in 2011.
Below is a pictorial of Pittsburgh. The photos here are dated between October
2012 and July 2013.
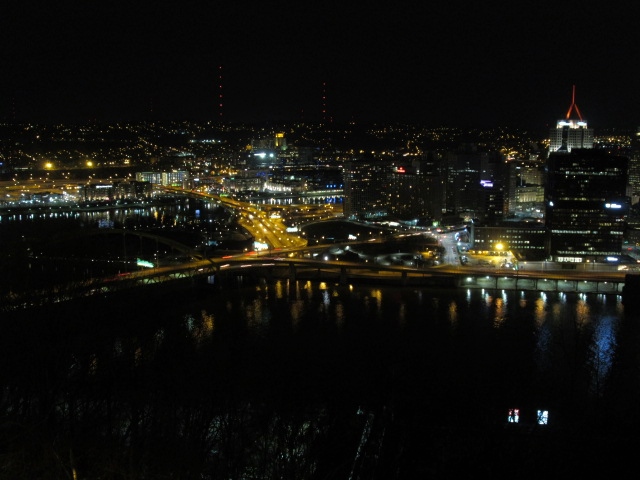 |
| The Three Rivers Confluence at Night. |

 |
| Four Gateway Center |
 |
| Two PNC Plaza |
 |
| The view from the Monongahela side of the city. |
 |
| Steeler Stadium which happens to be called Heinz Stadium. |
 |
| The view of Heinz Field and the Three Rivers Confluence from Mount Washington |
 |
| Fort Pitt Bridge. Prime Minister William Pitt was known as the Great Commoner. He was also the first Earl of Chatham. Whereas NYC is Gotham City, Pittsburgh is Chatham City. |
 |
| Historic St. Boniface, on East Street, near route 279. |
 |
| Forbes Avenue, en route to the world famous Cathedral of Learning. |
 |
| A photo snapped while standing on the borderline of Gateway Center and Point State Park. |
 |
| A closer view of the center of the photo above. |
 |
| In Pittsburgh, the bridges are as close as next-door neighbors. |

 |
| The Federated Building near the official federal building and the federal courthouse. |
 |
| One Oxford Center |
 |
| University of Pittsburgh Cathedral of Learning. |
 |
| Entering the downtown from Oakland, where Pitt's campus is located. |

Should you be slightly interested in seeing more recent photographs of the former steel capitol of the world ... the city of bridges ... the land which carries the imprint of the Great Ice Age so much so that it conceals the Wisconsin Glacial Flow 54 feet below it ... the multiple Super Bowl trophy depository ... the home of a few Stanley Cups ... and the metropolis of many technological firsts, the following might quench your curiosity a bit more.


