February 13, 2025

The Ballad of this Decade's Polar Ice

The following was written by an individual whose DNA literally matched that of a Greenland Viking found at an archeological site (in Greenland, of course) ... as well as the DNA of Vikings found at archeological sites in Southern Sweden, Oxford England, and Iceland, not to mention Denmark itself.  Thus, the true existence of the Medieval Warm Period is literally in this author's DNA.  More importantly, the paranoiac hyper-exaggerations about Greenland melting into the pits of doom is a super-annoying insult to his intelligence.

Let's start with an instant thousand words.  For those of you in the American Public School System, know that there used to be an axiom which said, "A picture's worth a thousand words."  In this particular case, the 1,000 words are in the NASA Earth Observatory illustration below which shows that Antarctica is not going through any once-in-a-7.5-million-year meltdown --- or any "plummeting ice levels," either.  This picture shows you that CNN lied to humanity ... as usual.   

The amber perimeter line in the illustration is the median.  That's sort of the average.  Actually, it's the middle number in a list of data numbers.  When it comes to the lowest statistical number in the 5.48 MILLION square mile Antarctic continent --- and its surrounding ocean water --- the "lowest" is not much different than the average ... the usual ... the regular.   

In fact, as of  September 14, 2023, Antarctic Sea Ice Extent amounted to 6.54 MILLION square miles in area.  Now, add Antarctica's land ice of 5.31 million sq mi to Antarctica's sea ice of 6.54, and you have an ice sheet that is 11.85 MILLION SQUARE MILE ice sheet.  Now, the entire Antarctic Circle is 7.7 million sq mi in area.  11.85 minus 7.7 =  4.15.  This means that there is so much ice in Antarctica that 4.15 million square miles of it is located outside of the Antarctic Circle, even though it's attached to the ice within the 7.7 million square mile Antarctic Circle.

Above is a NASA & NSIDC product for public view.  According to the media, 2023 was a disastrous time of melting for Antarctica.  Antarctica was reported as having had it lowest wintertime "sea ice extent" ever known to mankind.  Well, here is your Antarctica, as of September 14, 2023.  The official NASA/NSIDC report is that the Antarctic sea ice extent for Sept 14, 2023 was 6.54 MILLION square miles.  

This means that the amount of continuous ice in the Antarctic Circle & beyond ... minus 2% of ice-free Antarctic desert land ... is 11.8 MILLION square miles.  This is the combined size of Canada, the United States, Mexico, Brazil, and Argentina.   Therefore, there has been NO Antarctic sea ice climate crisis at any time in 2023 or in any other year since the invention of the camera.  

And yes, a very long strand of East Antarctica is also located outside of the Antarctic.  This means that there is also sea ice which exists outside of the Antarctic Circle, all the while being connected to the Antarctic continent.  None the less, concerning Antarctic land, observe:

                               Ice-covered Antarctic terrain = 5,300,000 sq miles (approximately)
                                      Ice-free Antarctic terrain =    110,000 sq miles (approximately)   

Concerning the illustration above, the jagged amber line encircling the Antarctic sea ice extent and all of Antarctica itself, is the "median ice edge."  That's the middle number in a list of statistical ice measurement numbers dating back to 1981.   Technically, it goes from 1981 to 2010.

Concerning this, whenever you see the word, "median" in science or statistics, think "middle number" in a list of numbers --- middle number in a set of numbers.  It's somewhat like the average number.  

The reason why the illustration above is important is because certain "journalists" have recently claimed that Antarctica is in a chaotic crisis stage of "plummeting ice levels."  They stated that Antarctica is undergoing a once in a 7.5 million year event, where Antarctica is losing massive amounts of ice.  They make it sound as if Antarctica is melting all over the place, because of the burning of fossil fuels.  

In fact, one journalist added that there are long stretches of the Antarctic coastline which have no ice, even though it is wintertime there.  This deceives the reader into assuming that ice was formerly in those places, but is now only recently gone.  This deceives the reader into assuming that Antarctica will only have the skeletal remains of sea ice extent in a relatively short time.

The unconscionable omission of the journalists is that they kept hidden from the readers the fact that Antarctica is the driest desert on Earth, and snowfall there is an extreme rarity.  So, two percent of Antarctica has actually been ice-free for a very very very long time.  But of course, media entities such as CNN and the Guardian have to over-sensationalize everything to the point of lying about it.  

The reason why the media portrayed Antarctica as being in an apocalyptic meltdown is because [1] it was recently reported that, in July of 2023, Antarctica had its least amount of July sea ice extent, during any July, since record-keeping began.  [2] And in February of 2023, Antarctica had the lowest summertime sea ice extent.  [3] Then, a year prior, in 2022, Antarctica also had the lowest summertime sea ice extent ... until 2023 came along.  So, CNN had to embellish.  What CNN forgot to mention was that after every Antarctic summer, the sea ice extent is low . . . always low.  Thus, every single year, Antarctica literally performs a 'reset.'  

As you can see in the July 2023 illustration below (as opposed to the August 23rd illustration above), the least amount of Antarctic ice encircling Antarctica ... during any July ... wasn't that much different than the average amount of ice that specifically encircled the Antarctic continent during July 2023.

Throughout each year, any ice decrease in Antarctica was slight.  Any ice increase there was slight.  It all hovers around the same general & approximate equilibrium.  Video theatrics concerning Polar ice is nothing more than a con artist's ploy to absorb inordinately large & undeserved amounts of American taxpayer dollars.  It's all a matter of theft by deception --- theft of the American taxpayer which includes the American working class.  

They act as if to be all so charitable, saving you from heated doom, death, and destruction.  They then go into overdrive, getting you to pay for the money given to other people in your name ... and not given to you directly ... so done under the guise of saving you from a carbon footprint which is supposed exist in an atmosphere that is already 99.9734% carbon-free.  

Needless to say, CNN's corporate song is that Antarctica is now in a chaotic meltdown, because of the burning of fossil fuels.  None the less, the heat of 2022 and 2023 matches the heat of 2011 and 2012, in the Eleven Year Sunspot Cycle Theory.  In sequence, 2000 and 2001 are 11 years prior to 2011 and 2012.  Now, there was a deadly heatwave in the Southern states of America in the Year 2000.  In 2001, the northeast of the United States got hit with a deadly heatwave.  I continued the trend in other posts, admitting that this is still only a theory, but one backed-up by some measure of evidence.

Even at that, I showed in detail how the mainstream media lied and exaggerated the temperatures of the Summer of 2023.  This includes the extremely bogus 101F ocean water claim, when the truth is that the water in focus was Florida Everglade run-off water, next to the Hwy 1 Bridge which leads to Key Largo.  

https://www.bluemarblealbum.com/2023/07/true-american-coastal-water-temps.html

I also showed that the mainstream media LIED in 2022, when it claimed that, on July 19 2022, the London Fire Brigade had the most "incidents" in its history, since WWII.  I did this by posting the OFFICIAL London Fire Brigade July 19, 2022 Incidents Report.  On that day, the London Fire Brigade had no more than ten incidents more than the daily average of incidents for the Year of 2022.  And of course, numerous days in many prior decades had far more daily incidents than did July 19, 2022.  

https://www.bluemarblealbum.com/2023/06/July2022%20greater%20london%20fire%20stats.html

I uncovered lie after lie after statistical lie.  One more thing.  I work alone.  Michael Mann tried to get Climate Hysteria Dissenters criminally indicted under the RICO Act.  He wanted dissenters who consult with each other to be criminalized.  Basically, he wants dissenters to be left isolated.  Well, you can amass a lot of information while isolated and working alone.

Welcome to the Antarctic Box Score (the stats)

Now, the official science is that 98% of Antarctica is covered in ice.  Yet, the 2% of Antarctica which is NEVER covered in ice comprises 110,000 square miles of Antarctic terrain.  That is the same area as is the state of Nevada, and such iceless Antarctic terrain is predominately expanses of barren rock which look like the surfaces of another planet.   This is why a dishonest journalist can claim that long stretches of Antarctica are without ice, all the while deceiving people into thinking that all of Antarctica is having a meltdown, due to the burning of fossil fuels.  

The truth is that the barren rock lands of Antarctica were caused by convection & high pressure air coming from the Tropopause.  It's called, the Polar Cell.  Likewise, there is the Hadley Cell, at 30 degrees parallel, in both hemispheres.

Whereas the iceless parts of Antarctica combined is the size of Nevada, the ice-covered parts of the same Antarctica are collectively is the size of 20 Texases or 33 Californias . . . or even 82 Floridas.  When it comes to natural iceless terrain in Antarctica ... not caused by the burning of fossil fuels ... it's a matter of comparing one Nevada to 82 Floridas.  Or it's like comparing one Nevada to 48 Nevadas.

As was previously reported, when mid-August 2023 came, the Antarctic sea ice extent exceeded the size of the Antarctic continent to the tune of 5.84 million sq miles.   And this "low low low" 2023 sea ice extent, as of mid-August, was SEVEN TIMES LARGER then all of the area of Greenland.  Greenland is 836,000 sq mi.

Antarctic Coastline: 11,164 miles in length

Then comes the coastline length of Antarctica which happens to be 11,164 miles ... or 17,968 kilometers.  Now, 2% of 11,164 miles is 223 miles.  Thus, if you have 223 miles of ice-free Antarctic coastline, you also have 10,940 miles of coastline where the ice cover extends hundreds of miles into the ocean.  Thus, it's 223 vs 10,940.  If you want to round-off the numbers, then it's a matter of 10,800 miles vs 300 miles ... or even 10,500 miles vs 500 miles.   Yet, CNN claims that Antarctica is in the dire straits of a meltdown apocalypse.  Needless to say, it most certainly is NOT.  It's just that CNN is a harassing annoyance upon humanity.

Below:  Observe the amount of ice is surrounding 10,800+ miles of the Antarctic coastline.  Meanwhile 200-300 miles of ice-free coastline aligns the Palmer Peninsula and Wilkes Land, as well as Victoria Land & Ross Island (near McMurdo Station).  Thus, thousands and thousands of miles of Antarctic coastline was engulfed in massive widths of sea ice, while CNN claimed there to be an apocalyptic meltdown there.   

Now for the Arctic Ocean, aka the North Pole, as is illustrated below.  The Arctic Ocean was simply described as having had its twelfth lowest July sea ice extent on record.  Okay, but look at the illustration below and see how much sea ice extent that happens to be.  That's 3.16 million square miles of sea ice.  That's the size of 48 Floridas ... or 12 Texases . . . or even 69 Pennsylvanias.  

Even at the Arctic Ocean's lowest sea ice extent (in 2012), the area of sea ice there was the size of 28 Pennsylvanias.  A way of fathoming the massive size of even the smallest square acreage of Arctic sea ice extent is to drive from Miami to Baltimore to Minneapolis to Houston and back to Miami.  At it's smallest, Arctic sea ice was 36% the size of the United States ... slightly largest in area than India ... and 5 times larger than Texas.  

In wintertime, at it's lowest maximum measurement, Arctic sea ice area was the size of 20 Texases.  At its highest maximum, Arctic sea ice area was the size of 22 Texases.  So, you need to understand that there is not much of a difference between highest and lowest in the Arctic.  You also need to understand that climate doomsayers are con artists looking for massive amounts of federal funding ... or NGO grants.  Such a thing is known as Theft by Deception, and there does exist something known as the False Claims Act.
Above:  Now, this is at the end of July.  That's an area of  3.16 MILLION square miles of sea ice.  The Arctic Ocean's surface is 5.4 MILLION square miles in area.  Thus, 58% of the Arctic Ocean was still covered by ice when August 2023 commenced.
Let it be repeated from a previous post:  Before all else, there's one simple observation which proves that 2023 did NOT come close to having the hottest summer in the past 7.5 million years or 125,000 years or even 87 years. The observation consists in the fact that the Arctic Ocean is not anywhere near ice-free, and it's already the 25th of August.  Life is simple and con artists overlook the simplest of things.  So too do the ones who get conned by the con artists. 

There is still a massive amount of ice in the Arctic, as is the case every year, even in its lowest year.  It's simply that a perpetual climate doomsday narrative is being propagated by [1] money-seeking activists, [2]  media managers in search of high ratings, and [3] scientists who want into their personal portfolios some of that recently passed $370 BILLION Congressional "climate appropriations" money.  That is what they really mean when they say they are going green.

This is what activists, scientists, and network news producers mean when they say they are "going green."  After all, Al Gore went green 250 million times, so far.

Unless the I.R.A. (the inappropriately named, Inflation Reduction Act) gets repealed ... rescinded ... amended ... abrogated ... abolished ... scientists will spend the next ten years lying about the climate, creating hyper-exaggerations in the process thereof.  They will do so, with the intention of getting for themselves and/or their universities and/or their networks some of that climate money.  It's elementary, Watson.  If the scientists say that the atmosphere is fine and well balanced, then they get no grant money.  If they say that the atmosphere is in a state of crisis, then they get money that rivals the military industrial complex's financial rates of return.

The Dust Bowl Observation

There is another blatant observation which shows that 2023 was not the hottest summer in even the past 87 years.  There were not the dust storms of the 1930s anywhere in America in 2023.  The daily damage done to farmers in 1936, alone, when measured by today's dollars, eventually reached an equivalency of  $530 MILLION per day.  At the time, the accountants surmised that $25 million per day of property was being lost to dust storms, drought, and searing heat.  The Year 1936 was the End of Many Worlds.  

One more reminder:  CNN was dead set on pushing the Iraqi Weapons of Mass Destruction Hoax.  CNN turned out to be completely wrong.  CNN was also instrumental on pushing other hoaxes, annihilating its credibility amongst reasonably minded people.  When it comes to CNN's Climate Hysteria, do the math when calculating the probability that it's journalists are being honest.  

Let us review the July sea ice reports:

Now think.   El Nino arrived on June 8th.  This means that the Pacific Ocean got an extra dose of heat from a "westerly source."  In the illustration below, take note that the Atlantic side of the Arctic is as ice-packed as ever, concerning the 1981-2010 "median ice edge."  The Pacific side got the expected effects of El Nino, to the point where the coveted Northwest passage is open for sailors.  Even at that, there is still a massive amount of ice on and in the Arctic Ocean.   The NASA & NSIDC illustration below is marked as August 28, 2023.

ABOVE:  During this El Nino Summer, there still remains ice all the way up to Cape Morris Jesup, in Greenland. The ice extends from Northern Greenland, all the way past the Severnaya Zemlya Archipelago, which happens to be 25 miles away from the coast of Central Siberia.  The distance between the North Pole and Severnaya Z is 725 miles.  The distance between Cape Morris Jesup and the North Pole is 440 miles.  Thus, there exists a 1,165+ mile stretch of Arctic Ice, as of late August 2023.  This is because 2023 did NOT have the hottest Summer in the past 125,000 years ... or even in the past 87 years.  None the less, don't be surprised if the Arctic sea ice extent of 2023 ends up 3rd to 6th lowest, in the satellite era.

The lesson here is that even the lowest amount of Arctic sea ice minimum is absolutely massive.  In fact, the 2012 sea ice extent had an area slightly larger than that of the subcontinent of India.  For the record, India is the 7th largest country in the world, and it's much bigger than Greenland.

Moreover, NASA reported that the Summertime Arctic ice-loss rate was around average until the beginning of August.  Then ice-loss accelerated.  Now, if co2 were the cause of Arctic ice loss, then the summertime ice loss would have occurred in a uniform manner, each month.  This is because the atmospheric co2 level did NOT suddenly ratchet upward in August.  In fact, when the Earth approaches Northern Hemispheric harvest season, co2 levels slightly drop.  Yet, as co2 levels were slightly dropping, Arctic sea ice loss increased.

Ironically, science recently found that, in the past 2,000 years, eras of slight warming coincided with Greenland ice cap growth.  We start with the following research field scientist's quote:

"Because we're collecting a climate record from the coast, we're able to document for the first time that there were these large shifts in temperature, snowfall and melt over the last 2,000 years, showing much more variability than is observed in records from the interior of Greenland."  

The lesson here is that co2 is NOT the driver of Planet Earth's atmosphere.  The indication here is that decadal ocean oscillations are the determinant of climate ... or at the least, they are the determinant of the surface temperature of the area near the oscillations.  And of course, each decadal oscillation is of a massive size.  

The "Global Boiling" Propagandists' diversionary tactic

At the surface of every ocean are gyres.  Each ocean gyre is massive, and each ocean gyre is far far far more important than the unraveled-bowtie-looking current often highlighted by Climate Hysteria Activists.  The current obsessively presented in Climate Hysteria propaganda is called, the Thermohaline Circulation.  The Climate Change People often put it in neon lights without ever mentioning that it actually exists at the bottom of the oceans and that you walk faster than it moves.  In fact, it used to be called [1] the Deep Circulation.  At other times, it was called [2] the Abyssal Circulation.  And yes, it IS synonymous with 'abysmal.'

The Global Warming People accentuate the sea floor circulation, to scare an under-educated public about unsalted fresh water pouring into the salty oceans.  They keep saying that very soon all of the fresh water run-off from Greenland will reduce the Atlantic Ocean's salinity so much so that the warm Gulf Stream will stop flowing north, and England will turn into Siberia.  

The great falsehood here is the fact that dozens of major fresh-water rivers throughout Planet Earth pour into the salty oceans of the Earth every second of every minute of every day.  This is where the delta, the estuary, the lagoon, the slough, and the sound come into play.  Such fresh water rivers flowing into salty ocean water include:

[1] the Columbia,  [2] the Snake,  [3] the Stikine (of British Columbia),  [4] the Sacramento,  [5] the Mississippi,   [6] the Hudson,  [7] the Connecticut,  [8] the Amazon,  [9] the Orinoco,  [10]  the Yenisei,  [11] the Lena (of Siberia),  [12] the Mekong,  [13] the Mackenzie,  [14] the Congo,  [15] the Niger,  [16] the Magdalena,  [17] the Yukon,  [18] the Kapuas (of Borneo),  [19] the Essequibo (of Guyana),  [20] the Ogowe (of Gabon),  [21] the Hong,  [22] the Kolyma (of Siberia),  [23] the Atrato (of Columbia),  [24] the Zambezi,  [25] the Tabasco (in Mexico),  [26] the Rajang (of Malaysia),  [27] the Fraser,  [28] the Khatanga, [29] the Pulau,  [30] the Sao Francisco (Brazil),  and the list goes on.  

Due to the fact that the Climate Hysteria Activists bark like dogs at the seasonal ice melt of Greenland, while keeping entirely silent when it comes to dozens of large fresh water rivers emptying-out into oceans, they have a lot of  'splaining to do, Lucy.

And concerning the Amazon River, to make a long story short, a 2017 paper surmised that the climates of ages past would have been warmer without Amazon river water running off into the Atlantic Ocean.  This is beyond the scope and allotted space of this particular discourse.

Mention of the ocean gyres isn't in the vocabulary of climate activists.  And of course, they are blaming the ice-free coastline of southern Greenland on CO2 and even other greenhouse gases which only exist in the atmosphere in very small trace amounts.  The official United States' own NASA explained the ice-free borders of Greenland in a much different way:

"The surface ocean current brings new water to this region from the South Atlantic via the Gulf Stream and the water returns to the South Atlantic via the North Atlantic Deep Water current. The continual influx of warm water into the North Atlantic polar ocean keeps the regions around Iceland and southern Greenland mostly free of sea ice year round."  

The lesson is that an ice-free January in southern Greenland is NOT due to co2 levels or the burning of fossil fuels.  In fact, southern Greenland is outside of the Arctic Circle.  None the less, as recently as in 2022, honest-enough scientists surmised that it was the ocean waters themselves that were causing the ice-melt of the southern Greenland coastlines. 

In conclusion, the proximate driver of the Earth's climate is either decadal ocean oscillation or the behavior of the Sun.  Now, when it comes to the ultimate driver of the Earth's atmosphere, NASA officially stated that "the Sun is the driver of the Earth's climate."  But, such a thing effects air pressure systems.  This, in turn, translates into Pressure Gradient Forcing driving the climate ... but driving the climate in conjunction with none other than the Coriolis Effect AND the tilt of the Earth, otherwise known as "the obliquity of the Earth." 

The bottom line is that Al Gore gave humanity the proverbial red herring when he obsessed his 2006 movie with life-giving co2, making it the villain of his thoroughly asinine movie, and by making it the great enemy of mankind.  Without co2 we all die.

Now, concerning the Southern Hemisphere

The 2% of ice-free land on a polar continent 5.5 million square miles in size can deceptively make the 2% look like a pandemic of ice loss.  There is no Antarctic coastline not covered by massive amounts of ice, except for the tip of the Palmer Peninsula at the Drake Passage, Wilkes Land, Victoria Land, and the Ross Island near the McMurdo station.

That Antarctic peninsula tip is outside of the Polar Circle, to the tune of 1,840 miles away from the South Pole.  It's only 540 to 600 miles away from the southern tip of Chile, where one finds Cape Horn.  Other than that peninsula tip, Antarctica, during winter, is encased in massive quantities of ice.

So, why is the peninsula tip not submerged in ice?  ANS:  The Drake Passage's effect on the extremely massive Antarctic Circumpolar Current (the ACC).  It causes eddies to flow toward Antarctica, thereby providing a South Pole wintertime rarity, called warmth, to the peninsula's tip.   Eddies are small vortices ... whirlpools ... and they ever so coincidentally exist in two lanes, during El Nino, with the Equatorial current in the middle of the two eddy lanes.  During El Nino they sort of work like highway guardrails.  Actually, the work sort of like train tracks.

The ACC is the strongest current on Earth, and it does NOT merely occupy a layer of the Southern Ocean near Antarctica.  It encompasses all of the Southern Ocean near there, from the surface to the bottom.   It transports approximately 225 MILLION cubic yards of ocean water per second.  It causes a circular current that keeps the cold within the Antarctic continent.  When a ship sails outside of that ocean water circle, the ocean's heat-increase is suddenly noticeable.  It's not a gradual effect.  It's kind of like the St. Lawrence River's point where predominate salt water becomes predominate fresh water.

Every summer, the Antarctic sea ice extent recedes almost to the continent's shoreline ... except where there are ice shelves.  NOAA long since observed that approximately 15% of Antarctic wintertime sea ice remains in tact at the end of the Antarctic summer.  But, the most important thing to note is that there is no noticeable sea level rise after the end of Antarctic summertime, despite the disappearance of sea ice there.  In as much, the summertime ice loss of Antarctica is NOT a once in a 7.5 million year event.  It's a once in every one year event, year after year.

NASA attributed at least "some" of this effect to the gradual lessening of albedo in the Southern Ocean.  The lesser the sea ice, the more the surface water, and the lesser the albedo.

Albedo is the amount of the sun's energy that reflects back into space.  Now, snow-covered ice has much more albedo than does ice alone.  That is to say, more of the Sun's energy bounces back into space after hitting snow covered ice than hitting uncovered ice.  And of course, Antarctica is a desert.  Snowfall there is a rarity.  Each Pole is a high pressure convection zone, thereby translating into desert.  This is the same as both 30th parallel convection zones, north and south.  The 30th Parallel, north and south, is/are where the major deserts of Planet Earth are located.

None the less, when sunlight hits ice, snow, etc, most of the sunlight reflects back into outer-space.  When it hits water, most of it does not bounce back into space.  In fact, water, sand, grass, leaves, and dirt have very low "albedo values."  Furthermore, asphalt has the lowest albedo, meaning that it absorbs solar radiant heat the most.  Thus, when you are in the city, it's NOT co2 that's causing the "urban heat island effect."  It's asphalt.   

When it comes to water, there are exceptions in the "albedo value," where the majority of sunlight reflects back into space upon hitting certain types of water.  This depends on the Sun's angle.  The lower the angle, the higher the albedo.  

There is much more to include which can be considered "beyond the scope" of this discourse.  Explaining it all would take three posts, and there would still be decisive questions left to be answered about Antarctica and the Southern Ocean.  The bottom line is that atmospheric science & oceanography are very intricate sciences, and you cannot be a stereotypical corporate television airhead and reduce every weather condition on Planet Earth to "the burning of fossil fuels" and "co2" ... or even "greenhouse gases." 

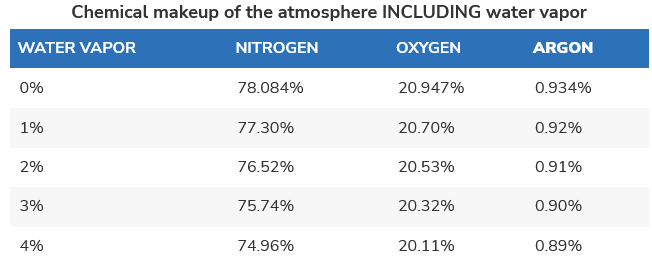
Concerning the volume of greenhouse gases throughout the Earth's atmosphere, 90% of them is WATER VAPOR.  Needless to say, you cannot sequester the oceans and their 352 quintillion gallons of water.   You cannot ban water.  Where are you gonna hide it?

The other way in which ice can literally disappear

As a quick note, ice loss can also occur via "sublimation," where ice turns into vapor without first turning into a liquid called water.  Fast winds require this.  So, how were the Rossby waves/winds this Summer?  Some of us don't have the luxury of time to look into every type of file and report,  including updates on Rossby wave action.  None the less, the Year 2023 is NOT NOT NOT anywhere close to becoming the first ice-free August and/or September in the Arctic Ocean since who-knows-when.  

Then comes the Antarctic Ice Gains Hidden by the Mainstream Media

Between 2009 and 2019, East Antarctica had 661 gigatons of ice GAIN.  See:

https://www.bluemarblealbum.com/2023/08/661-gigaton-ice-gain.html

It's West Antarctica where ice is receding, and ironically the vast majority of Antarctica's subglacial volcanoes are in West Antarctica, positioned like a "string of fire."  

Now, before 2017, it was taught that 91 subglacial volcanoes sit in Antarctica.  After 2017, the conjecture was that 138 volcanos in all are in Antarctica.  Thus, there are 7 to 11  dozen volcanos on Antarctica's continent.  

And finally, there were 34 ice shelves studied, out of Antarctica's 48 major ones.  Eighteen of those ice shelves were found to be retreating (receding.)   Sixteen of them were found to be growing.  Two of them are the largest ones on Antarctica.  One of them is the size of Spain, and the other one is slightly bigger than Montana.  They are the Ross Ice Shelf and the Filchner-Ronne Ice Shelf.

The decisive question is how much of this maximum Antarctic ice extent is the "least"?  The answer is 5.84 million square miles as of mid-August 2023, with approximately four weeks of Wintertime ice accumulation remaining.  

Now, the record high is 7.78 million sq miles which occurred in September of 2015.  More importantly, as recently as two years ago, the Antarctic maximum sea ice extent was 7.12 million sq mi.  Last year, the maximum extent was 7.02 million sq mi.  Thus, there is NO ongoing trend of disastrous ice decline in Antarctica.  In fact, the US government's Boulder Colorado crew stated, "In the past decade, the September winter maximum has been extremely variable, hitting record and near-record highs, as well as near-record lows."  

The bottom line is that the Antarctic continent remains surrounded by an overly massive amount of sea ice, during winter.  The equally important bottom line is that today's journalists, especially those who work for Bill-Gates-funded media outlets, are unconscionable liars who apparently don't care about the disgraceful legacy that they will leave behind them.  

Even though there is presently a stranglehold on the media outlets by outright liars, it won't always be that way.  The truth will eventually come forth, in a number of topics that are being misrepresented to the public, by CNN and similar unconscionable entities.  The con game will be out in the open for everyone to see, years, decades and even centuries from now.  The arrogant of today will be forever humbled.

Below:  Official stuff.  This IS a product of NASA, and it shows no end-of-the-world type of ice loss, even if 2023 comes to be the year with the least Antarctic maximum sea ice extent or the least sea ice concentration in known history.  When it comes to Antarctica, even the least is an astoundingly massive amount.


February 12, 2025

The heat of July 1852 and other years, when atmospheric CO2 was very low.

Above: A news article published on July 27, 1852.  Atmospheric co2 was 285 ppm ... in 1852. 
In September 2023, it was 418 ppm. 
The article above shows that people in the 1850s commonly accepted the concept of the Medieval Warm Period.  This is indicated by mention of "the burning plough-shares of medieval times."  The article below (at the very end of this post) shows the 1850 understanding of the past 1,000 years weather not being mild, as con artists Michael Mann and David Attenborough very falsely claimed.  

There needs to be a Reality Check, concerning the proven FALSE ASSERTION that rising CO2 levels cause more severe weather events .... and more damage to Planet Earth.  After all, the textbook-defined "Pressure Gradient Force" is a law of nature by which the closer the temps between the poles and the Equator happen to be, the lesser is the turbulence in the atmosphere.   

For those in the American public school system, phases of global warming (such as the absolutely proven Medieval Warm Period) are times by which temperatures between the poles and the Equator come closer to each other.  Global Cooling phases (such as the 1284-1840 Little Ice Age) are accompanied by temperatures between the poles and the Equator getting further apart from each other.  

This means that global warming = less atmospheric turbulence, while global cooling = more atmospheric turbulence   Plus, El Nino brings with it "wind shearing propensity." And of course, El Nino directs heat in an Eastward direction.

All in all, Planet Earth has a mechanism by which the planet takes action to balance itself.  When the DIFFERENCE in temps between the poles and the Equator increase, the Earth experiences an imbalance.  So, it goes about,  to balance things out.  Thus come hurricanes which happen to be nature's way of sending excess heat from the Tropics northward.

It's during global cooling phases when more turbulent hurricanes such as Camille occur.  Camille occurred during the 1940-1979 temperature decline that Michael Mann hid in his hockey stick graph.  This decline was mentioned in the Climategate emails of 2009.  If you have viewed recent hurricane season stats, you would see that there are now more low-speed cyclones called Tropical Storms.  

BTW, during pronounced global cooling phases, there still occurs droughts and heatwaves, such as the Great Tudor Heatwave & Drought of 1540.  More importantly, the repeated assertion that "None of this has ever happened before" must be recognized as the lie it is, when talking about any recent heatwave, cyclone, or flood.  "It" all happened previously, in more pronounced severity --- in tragic proportions ... in more pronounced turbulency & in many more deaths.  So, historical accounts easily provide the evidence to show that the demonization of CO2 is a propagandist's lie.  

The motive for demonizing co2 was and is  1] U.S. Congressional taxpayer dollar appropriations.  2] the establishment & maintenance of the blatantly bogus "carbon credit market."  3] the equally bogus "carbon tax."  4] governmental control over every citizen's private daily life activities,  5] an equally bogus excuse for sterilization and abortion,  6] NGO financial donations which have a way of getting into activists' personnel bank accounts.  Thus, the motive has been to acquire ===> easy money. 

Below: An 1878 article which also shows that dreadful heat certainly occurred when the atmospheric co2 level was too low to have caused any of the many heat waves throughout history.  Statistically speaking, 1896 was the year of the hottest heat waves, and 1934 was the year of the worst drought in the past one thousand years; so stated for the record.
Below is a Sunday newspaper article, from London's The Observer newspaper, dated July 18, 1852.  In 1852, atmospheric CO2 was very low, and the news article below recounts disastrous weather years which occurred in the centuries when the atmospheric CO2 level was always extremely low --- (between 275 to 285 ppm).  This level was not far away from the atmospheric CO2 level during Caveman days (260 ppm) ... Fertile Crescent Days ... Assyrian Empire Days ... Alexander the Great Days ... Roman Empire Days ... Justinian Plague Years ... Medieval Warm Period Years ... and even Renaissance Era Years.

A certain British speech giver, along with the hockey stick graph drawer, Michael Mann, asserted that the past one thousand years were years of ongoing & non-stop mild weather, up and unto the Industrial Revolution.  For anyone enterprising enough to have studied even a small sample of the historical chronicles, the almanacs, the ship logs, the temperature reports, the newspaper articles, and the magazine articles on the subject, this mild-weather assertion is an insult to the reasonable person's intelligence.

The historical accounts, the military logs, the monastic records, the proxy evidence, the Elbe River "hunger stones" of Central Europe,  all show that life on Earth has been a challenge even when co2 was  very low.  Life on Earth has been tragic, even during low co2 levels.  It drained people.   Yet, civilization continued and mankind survived.  A Candyland is something that Planet Earth is not.

February 11, 2025

Climate Amnesia

The Thesis Statement of it all is this:  If you were to cut in half today the Earth's global atmospheric CO2 level --- as well as the 2 ppm Methane level, the 1 part per 3 million N2O level, and the 11 parts per trillion Hexaflouride level --- you would still get hurricanes, inland storms, tornadoes, blizzards, monsoons, mudslides, tsunamis, volcanic eruptions, ice calving, ice stacking, icebergs, dust storms, heat waves, droughts, pestilence, and insect crop invasions, as well as tree infections, and Crimson Tide algae blooms --- just like in days past (in decades & centuries past) when the co2 level was much lower than today.  

It would all become a matter of "all that work for nothing."  Then where do you go, in your quest to stop hurricanes, tornadoes, and floods? ... lions and tigers and bears.

Today's media & politicians have willful Climate Amnesia.  Previously on the Blue Marble Album and elsewhere, it was illustrated that extreme droughts, prolonged flooding, more deadly hurricanes, longer heat waves in higher latitudes, etc have been occurring all throughout recorded history.  The years directly following the end of the Little Ice Age (1284 - 1840) are an abundant example.  

One of the greatest causes of Climate Amnesia is Data Tampering.  The observation has been that certain governmental entities lowered the temperatures of the past on paper, to make it seem as if there had been a notable increase in temperature, above & beyond what the same governmental agencies stated in the 1990s & the turn of the Millennium.   It was a matter of two different generations of personnel and management.  And of course, the "tampered" charts & graphs do NOT correlate with the numerous newspaper articles, magazine articles, and chronicles which reported on the weather events in the current time when the events actually occurred.  Take a look at how the graphing has changed:

61% Of NOAA USHCN Adjusted Temperature Data Is Now Fake | Climate ...

February 8, 2025

There was only ONE Northern Russian Arctic Circle Anthrax Outbreak. None were in 1941. The media lied again, through false light exaggeration.

Reindeer herders camp in the polar urals natural park
Arctic Russia. Newsflash: Non-modernized nomads do NOT seek to sleep on permafrost. 

Person 1:  There was one anthrax outbreak in Russia.  It occurred in 2016, in the northernmost part of central Russia, in an area known for its lucrative oil production.  One outbreak only.  One person died ... in all of Russia.  Approximately one hundred got infected.

Person 2:  Well, okay.  Conceded.  But, the bubonic plague and other microbiological disasters will strike Siberia, through the melting permafrost.  

Person 1:  The Bubonic Plague did strike Madagascar recently.  But, that's in Africa ... not in Siberia.  The Bubonic Plage also struck India, in 2014, killing 56.  India is nowhere near the Russian permafrost, frozen or unfrozen.  In order to emerge from melted permafrost, you have to be an endospore.  The Bubonic Plague bacteria (Yersinia Pestis) is not an endospore. 

Siberian Architecture is the issue

Microbiology isn't the issue of most concern, in the areas of receding permafrost.  Architecture is.  This is how you separate a Climate Change Fraudster from an honest person.  If a person presents him or herself as a climate expert on permafrost, and doesn't mention "stilts," "thermopile," and/or "thermosyphon," the person is a fraud who is pretending to be an expert.

The first reality is that melted permafrost freezes-up real fast come Autumn in the Northernmost regions of Russia.  Melted permafrost is frozen throughout most of the year.  And, it only take two contiguous years for a frozen substance to be classified as permafrost; not 2,000.

Quick Tips, for detecting sleight of hand deceptions

Firstly, if you are looking at a photo with any kind of grass in it, you are NOT looking at a permafrost landscape.  Secondly, if you are looking at Russian architecture over true permafrost (frozen or melted), you will see a concrete lot around the building, and stilts attached to the house, going into the ground.   Thirdly, if you are being shown a photo of Arctic nomads, know this:  They don't want to sleep on ice.  Do you?

Then comes the thermopile (providing a shadowing effect on the ground below, to keep things cold) or thermosyphon (to extract heat from the ground below the structure.)  This is in addition to house stilts.

Now, if there truly is a melting permafrost involved, as opposed to other varieties of snow & ice, it does NOT automatically mean that co2 or the minute level of any other minor greenhouse gas is doing the melting.  Water vapor is the master greenhouse gas.

Concerning CO2, it's super easy to illustrate that it hasn't been causing a melting in the Arctic Circle, even though there has been melting there.  Observe:

Firstly, atmospheric co2 is mostly uniform (mostly the same) with little variation throughout the Earth's Tropospheric altitudes.  Even though some regions of the Earth emit much more industrial co2 than other regions, co2 generally evens itself out throughout the entire atmosphere, per altitude layer. 

Thus, that which is occurring in the Arctic would be occurring in  Antarctica, if co2 were a driver of climate & air temperatures.  After all, Global Warming deals with the Globe ... not merely the Arctic Circle.  So, the South Pole should have its melting, too.  And Antarctica is the same size as the Arctic Ocean; 5.5 million square miles.

Newsflash:  The Year 2021 was the year of Antarctica's coldest known winter on record.  

Double Newsflash: The gigantic Ross Ice Shelf in Western Antarctica was found to be crystalizing at its bottom, and not smoothing-out.  Smoothing-out denotes melting.  Thus, the Ross Ice Shelf was doing the opposite of melting. 

Directly below is a National Geographic video on the Ross Ice Shelf crystalizing at its bottom, after a super deep hole was cut into it, by New Zealand scientists in 2015.  The name, National Geographic, makes it a prestigious video.

See:     Ross Ice Shelf Crystalizing and NOT melting.

Oh, by the way, concerning the report that Antarctica had a recent record high of 64.9F, that place was 1,840 miles away from the South Pole, and 206 miles outside of the Antarctic Circle.  It was 700 miles away from the southern tip of South America, where Chile and Argentina have borderlines.

Definition   

In review, the official definition of permafrost is anything frozen for two consecutive years, including rocks and boulders.  You do not need co2 to effect the melting of (or the sublimation) of permafrost.  

CO2 is only 0.042% of the Troposphere, with the radiative forcing of a nightlight.  Water vapor is the dominant greenhouse, comprising 90% of the Earth's greenhouse gases ... by volume, of course.  So, you need to widen your panorama and quit being tunnel-visioned by an Al Gore who claimed that the center of the Earth is millions of degrees.  The center is 9,800F to 10,800F.  Gore is a fraud.

One more thing:  It's very much possible for ice to turn directly into vapor, thereby bypassing the melting and liquefying phase.  It's called sublimation.  A prime example of this sublimation is on Himalayan mountain tops.  Strong winds are required.  So, if you see missing ice, it doesn't automatically mean "melting."  And if you have melting ice, it doesn't automatically mean co2, when the co2 level is merely 21/50,000th of the atmosphere; that's "twenty-one, fifty thousandth" of the Troposphere.

Concerning the building of any structure on permafrost, that's a conversation for another article or discourse or video.  So, an article written by a member of an Alaska firm (on the permafrost topic) was posted directly below, should you be curious.

See:   Building on permafrost, aware that the permafrost might melt. 

If there is vegetative life present, you are not on permafrost

Permafrost has melted previously and the world did not come to an end.  Evidence as to the absence of Northern Permafrost in ages past is artifacts found under present Permafrost ... or under recently melted permafrost.  This includes human-made skis and a few mummies designed to be preserved for a really long time.  Other evidence includes rooted tree stumps positioned closer to the Arctic Ocean than is today's more remote tree line.  Therefore, the Zombie Apocalypse is on hold.

In fact, there's an irony with Arctic coastline permafrost.  Firstly, it comprises 30% of all coastlines on Earth.  Secondly, Arctic Ocean water has repeatedly been found to be super cooled, meaning that it is still liquid even though it's temperature is below 32F ... or 0C.   This presents a question:  Does permafrost ever become super cooled, turning into liquid without a temperature?

The variables in this equation would be ~frazil ice, ~anchor ice, ~turbulence, as in kicking-up eddys (those gyres ...  slow-motion spinning tops).  Well, this subject is for a series of articles.  It's beyond the scope of this discourse.

All in all, Arctic Ice starting slowly going downward in 1968 or so.  Then, after 1979, when there was the highest accumulation of Arctic sea ice, it diminished more efficiently.  It stared its return in 2017.  None the less, all of the Arctic Ocean is on salt water.  The Antarctic is desert land, and the ice accumulation on that land is equal to the ice accumulation during the latest maximum glaciation (aka Ice Age) of  North America.  

Moreover, the massive ice shelves of Antarctica are mostly submerged in saltwater ... and are not floating on top of it.  None the less, the Antarctic Ice has been found increasing within the past 10 years, especially in 2015.  Meanwhile, Arctic Ice has not been doing so ... except for this year, in 2022, and 2017, as well as 2018.  A return of ice started in 2017. 

In as much, being that the Poles are under the same atmosphere, and yet are behaving differently from each other, the atmospheric co2 level is NOT an answer to this question, in any capacity.  Having obsessive recourse to co2 levels as the answer to every atmospheric question is pathetic.  CO2 is the key to photosynthesis.  It's an answer to agricultural questions; not to atmospheric ones. 

That which might be an answer is found somewhere in the observation that sea ice isn't forming above Northern Scandivania or west of Russia's Arctic seaports.  After all, you can draw a line from the Gulf of Mexico to Western Russia's Arctic seaports.  That might mean something useful.  None the less, that topic is beyond the scope of this article.

Yet, concerning 2022, the year of France's heat wave, there has been a generous allotment of ice in the Arctic.  Yet, Scandinavian and Arctic Russian aren't getting the ice.  None the less, there is more ice now than in the past couple decades.  And and and, ships still get caught in Arctic Ice. 

Greenland is what is exaggerated by the Climate Doomsayers.  After all, if all the Arctic Ocean completely melted, it would have the same general effect as your iced tea ice cubes melting away.  The water level would not increase.  

Actually,  when snow melts, the water level decreases.  Anyone who worked outdoors for years, knows this via experience.  So, the climate doomsayers must attract the public's mind to Greenland and then create a horror story via false light, sleight of hand misrepresentation.

None the less, the aforementioned question still isn't answered.  For now, it would suffice to state that climate hysteria has gone overboard, because the Biden people are using it for inspiring high amounts of Congressional funding.  The Congress is the keeper of the purse.  So, the executive branch in DC has to inspire Congress to spend.

Endospores is the other issue 

When it comes to the claim that pandemics will bloom from the melted permafrost areas, it's a matter of "endospores" which can sit crystalized and dormant for a few consecutive centuries, but NOT for thousands of years.  

Now, there are aerobic endospores and anaerobic ones.  Aerobic endospores activate in oxygen "mediums" and anaerobic ones activate as soon as they're in an environment free of oxygen.

An example of an anaerobic endospore is Tetanus.  When it gets into a cut, into an oxygen-free zone of the human body, it's activated.  If left untreated, tetanus mostly turns into "lock-jaw" which happens to be fatal.

An example of an aerobic endospore ` (in part only) is Anthrax which happens to be in the bacillus family.  A bacillus is a rod.  Anthracis refers to coal, as in the mark on the skin caused by anthrax.  It looks like a lump of coal, one-dimensionally speaking.  None the less, there are two types of anthrax.  One is vegetative. 

Bubonic Plague doesn't operate that way

That which proves asinine the assertion that "bubonic plague will come out of melted permafrost" is the fact that bubonic plague bacteria (yersinia pestis) is "non-spore-forming  coccobacillus."   It is NOT an endospore.

However, it is a "facultative anaerobic" bacterium, meaning that it can survive in oxygenated and oxygen-free mediums.  Thus, it even feels at home in untreated cuts.  BTW, coccus means sphere, and bacillus means rod.  Coccobacillus means short and oval in shape.

Anthrax needs a non-oxygen environment to enable itself to sit crystallized for a few centuries.  Snow is NOT oxygen-free.  Ice is NOT oxygen-free.  Anthrax has to get kicked-up out of the Earth, though only at near-surface depth.  Wind or heavy precipitation or a military invasion kicks it up the earth ... not melting.  Melting doesn't kick up anything.  After the melting, something else must do the kicking-up.

Now, anthrax is NOT spread from human to human.  It is NOT a contagion, unless there is cut-skin to cut-skin contact (subcutaneous contact).  Anthrax mostly infects living beings by "aerosol dissemination;"  breathing it in while it floats through the air.  

One can also contract anthrax via eating something infected with anthrax.

Permafrost still frosts-up in the Wintertime.  So, why does it seem that anthrax only hovers around the snowy cold places of the Earth?  Well, it doesn't.  Only the Climate Doomsayers make this appear to be so.  

Anthrax came out of Africa 3-6 thousand years ago.  How did it get  up to Russia, in the first place?  In order for anthrax to have landed on Northern Russian ground, there had to have been a snowless time span in Russian, in the first place.  Thus, permafrost is not a hallowed relic.

Now, the Arctic Circle anthrax infection issue is yet another FALSE LIGHT MISREPRESENTATION.  The media made it sound as if this type of thing was happening on a regular basis.  The media made it sound like something that had now become common.  In as much, answer this question:

Q: Except for Lake Nakuru Park In Kenya, when was the last time there was an anthrax outbreak?

ANS 1: July 2022 in Croatia. Dozens of cattle died.  Six humans hospitalized.   Croatia is far away from Russian permafrost.

ANS 2: June 2018, in France.  Zero humans died.   Cattle got infected.  Approximately 50 cattle died.  France is far away from the Arctic Circle and Russia in general.

ANS 3: 2009, in Scotland.  Drug addicts contracted anthrax through needle sharing.  This definitely has nothing to do with melted or unmelted permafrost anywhere on Earth.  This was indoor anthrax.   The drug addicts were not shooting-up outdoors, in Northern Russia.

Climate Doom Propagandists have to insert lie after lie, in between pieces of actual historic fact.  For example, the 2016 media reported that Russia's SOLE anthrax outbreak as the first one "since 1941."

There was no anthrax outbreak in 1941.  That was during WWII, when Nazi Germany had invaded Russia.  The outbreak was an Influenza Epidemic amongst the Nazi German troops.  It was the 1918 Spanish Flue (Kansas Flu;) not anthrax and not the bubonic plague.  So, do you once again see how the Climate Activists lie and lie and lie again, via sleight of hand, false light misrepresentation?

Concerning Climate Doomsayers stating that Russia would not only be infected with anthrax, but also by bubonic plague, etc  rising out of the melted permafrost:  

Well, between 2014 and 2017, there most certainly was an outbreak of the Bubonic Plague --- in Madagascar, Africa --- far far away from the Russian permafrost.  In Madagascar,  2,348 people became infected, and 202 died.  In Russia, none.

In 1994, there was a Bubonic Plague outbreak that killed 56 people --- in India, far away from Russian permafrost.  Bubonic Plague, aka Yersinia Pestis, is NOT an endospore.

~  ~  ~  ~  ~

Q:  Why does the Lake Nakuru anthrax outbreak not matter in this conversation?

ANS:  It's because Lake Nakuru is in Kenya, and Kenya is at the Equator where there is NO RUSSIAN PERMAFROST, melted or unmelted.

Q: So, when was the last time an anthrax outbreak resulted in at least one human death anywhere on Earth?

ANS: 2016, in North-central Siberia.  One 12 year old human unfortunately died.  One hundred other humans got infected.  About 2,300 animals died, mostly reindeer.  That was six years ago.  Nothing since then. 

Q: Were there any other anthrax outbreaks in the 21st Century, other than the 2001 mail-delivery anthrax attacks?

ANS:  Only one other ... in Jharkhand Inda, in 2014.   Seven people died, and the anthrax was traced to one deceased cow.  Some people made dinner from that infected cow.   

Jharkland is a warm weather region.  It's coldest winter weather is usually in the upper 40s Fahrenheit at night.  Therefore, melted permafrost was NOT an issue in this case, either.  There was no permafrost there, in the first place.

The conclusion is that the media took one and only one cold climate anthrax event that occurred in the 21st Century and hyper-exaggerated it to the point where it sounded as if anthrax outbreaks were regularly occurring year after year after year, month after month.  No.  Not at all.  The media once again lied via sleight of hand false light misrepresentation.

February 7, 2025

If it were true, you would always be exhaling smog.

 File:2015年第二次北京雾霾红色预警实况.png

Let's do some very basic math that might be liberating to you, in light of the endless nagging about the atmosphere's "carbon footprint," "carbon footprint," caaaaarbon fooooootprint.

Newsflash:  The atmosphere today, as it was 4,000 years ago, is 99.93% carbon-free.  Observe:

78% carbon-free NITROGEN, 21% carbon-free OXYGEN, 0.93% carbon-free ARGON =

                                                                        99.93%

Moreover, 90% of all greenhouse gases, by volume, is carbon-free WATER VAPOR.  This is only logical, because the surface of Planet Earth is 71% carbon-free WATER.  Plus, extremely small amounts of the following carbon-free substances are also in the atmosphere: Neon (19ppm), Krypton (1.15ppm), Helium (5.35ppm), Hydrogen (0.53 ppm), Ozone (0.07 ppm), Xenon (0.09 ppm), and a few other things at low concentrations ... even trace concentrations.  So, where's all the carbon, you climate crisis activists?

For the record, if you want to mathematically include water vapor into the equation, you subtract small portions of Nitrogen, Oxygen, & Argon as follows.  Now remember, water vapor is in differing concentration in different skies of the Earth.  It exists from 0.1% (deserts) to 4% (the Tropics).  So, you adjust the math as follows:  PS:  That chart came from the United States government.  NOAA.

Preliminary note with irony attached to it:  In having been in construction as far back as 1992, (with respiratory allergy sabbaticals taken in-between --- along with one steel-beam-crush injury sabbatical)  I have already met all forms of humanity.  And on occasion, the subject of "Climate Change" did emerge instantaneously.  The only ones who believed in the claim of fast-approaching Doomsday Climate Change were {1} recently graduated high school students who have very few years of life experience, and {2} people in local government who don't even know the percentage of CO2 in the outdoor air.  

Everyone else said either "The whole thing is bull crap" or "It's not as bad as 'they' make it out to be."   These people have had the experience of living in Earth's atmosphere decades longer than a newly graduated high school student.  They speak from much longer experience.  And of course, as far as goes small time politicians, they're just like big time politicians, in being mynah birds, video recorders, and/or robots, rattling off bumper sticker slogans and predictable clichés.

The reflex action to dispel Climate Doomsday Rhetoric is especially the case for geologists who do not receive taxpayer-funded paychecks.  The same goes for any tradesman who worked outdoors for the past 20 to 25 to 30 years.  

Now, this concerns the claim that today's trace amount of atmospheric CO2 is causing the End of the World.  The typical geologist mentions the tremendous amount of CO2 which rockets out of the typical erupting volcano, followed by no Global Warming heatwave resulting from the sudden unleashing of CO2.  Meanwhile, the typical 25-year tradesman simply says that "climate is cyclical."  Therefore, the common citizen, and therefore the reasonable human, thinks that the alarm of a fast-approaching climate change extinction-event is senseless buffoonery.   

In addition, the pertinent charts & graphs of the 1990s (which outline the temperature, sea level, and frequency of weather events of the prior 100 years, 500 years, and 1,000 years) have been decisively altered and do NOT sing in harmony with newspaper reports & chronicles of the same years, same decades, and same centuries represented in those graphs.  This is known as Data Tampering, and the newspaper reports of old constitute the numerous pieces of evidence which prove the "newer" charts & graphs to be fraudulent.   

Example:  A "newer" NOAA graph claimed that 1920, 1921, and 1922 were among the coldest years of the 20th Century.  Go and look through the newspaper archives for those years, and see for yourself.  Those were heatwave years, marked my notable ice melt  around the Arctic Circle regions ... those years were as heated as the 1930s, and they were the opposite of the basically frigid 1960s and 1970s.  Look for yourself, so that you'll see that something does NOT match, concerning news reports of old and today's "new and improved" weather event charts and temperature graphs.

2nd Example:  Today's wildfire frequency chart only begins at 1983, the year of the lowest amount of forest fires & wildfires.  The REAL data goes back to 1916.  There were motor vehicles that could track and measure burnt forest land very effectively.  The Years 1926 to 1943 were the years of massive forest fire frequency.  Today does NOT come close, in burnt acreage.

Now, that which is more interesting goes as follows:

Concerning the key players in the man-made-co2 "Climate Change" hysteria, everyone knows who Al Gore is.  And everyone definitely knows who Bill Nye is.  Well, NOBODY knows who Michael Mann is.  Now, he's the one whose horn gets tooted the most by the most "liberal"of  media members. Yet, nobody amongst the common folk in America knows who he is.  That is a major crash-and-burn for a self-centered narcissist such as Michael Mann.  This also shows that the commercial media, the public TV media, and the various Bill-Gates-funded entities failed at their own propaganda ploy.  

This is the carbon footprint of CO2.  CO2 happens to activate photosynthesis.

Let us begin:

The first indication that the CO2 Doomsday Narrative has been a lie from Day 1 consists in the fact that, if CO2 were the pollutant Al Gore said it was, then you would constantly be exhaling a very visible form of carbonized soot --- something equal to cigarette smoke or coal dust.  Your breath would be a color ranging from gray to brown to black.   You and everyone else would need to clean the soot off your shirt/blouse every evening.  After all, pollution  is ====>  unburnt fuel.  This is not to be confused with particulates which are produced during the unavoidable abrasion of machine parts ... or engine parts.

Moreover, all those photos of active smokestacks shown on-screen, while being presented as CO2 polluting the Earth, were false-light misrepresentations.  The visible part of those smokestack emissions were gaseous compounds other than CO2.  CO2 is odorless and colorless.  It's also harmless when under 2,000 ppm.  It's not deadly unless you're exposed to 84,000 ppm for an hour.  So compare:  416 ppm outdoors today vs 84,000 ppm in laboratory conditions.

Your breath is proof that CO2 is colorless.  Look into a mirror.  Are you a fire-breathing dragon?  Are you a coal-dust-exhaling dragon?  Well, the average human exhales 1.6 to 2.3 lbs of CO2 per day.  Yet, each one's breath looks clear.  That's enough of an indication that you've been conned by Al Gore & Michael "hockey sticks" Mann.  

There are a number of observations in front of your face ... in historical logs ... in monastery ledgers ... in almanacs ... in newspaper articles dating back to the 1600s ... in maritime charts & reports ... and in "proxy evidence" ... which show that this Chicken Little Hysteria is a complete con game.  You need to look around and test the "end-of-the-world" assertions for cracks.  You will find many cracks.  

Example #2:  London Area fires decreased significantly since the 1980s & 1990s, even though co2 levels consistently increased.

This example concerns the very false claim that elevated co2 levels set London on Fire in 2022.  The London Fire Brigade reported enthusiastically in 2014 that yearly fires throughout the 610 square mile region of the London vicinity had been reduced to approximately half of the number of yearly fires of the 1980s & 1990s.   In fact, the Year 2021 was the record low year in London Area fires.  

From the 1970s to 2003, yearly London area fires were over 40,000.  In the mid-2010s, the yearly fire number went below 18,000.  In 2021, the number went below 15,000, even though co2 levels had been rising with relative significance since the 1980s & 1990s.  So, in 2022, you were told a lot of lies.  

Dry heat from Africa caused the two days of a major British heat anomaly, in 2022.  Not CO2.  After all, the same co2 level caused the least number of fires in London's statistical history, the year prior.  Look at the London Fire Brigade's own chart, to see that you were the recipient of multiple lies in 2022.  Incidentally, London Statistical History began in 1966.  That was the year when the London Fire Brigade started keeping score on its fires.

Example #3:  The Rigged Media:  

                         See:   The Gates Foundation's $174 MILLION Donations to Media Entities.