 |
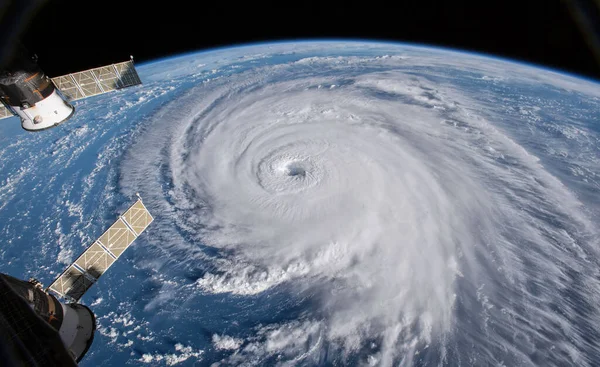
| Hurricane Florence, September 2018 |
The apparent policy of the Biden Administration was to lie, lie again, and lie some more about everything everywhere. So, hurricanes became objects of hysterical theatrics, with each one that reached at least Category 3 status. It then got to the point where a Category 3 hurricane in the Pacific Ocean was now being called "a Super Typhoon."
Well, the Biden Administration made a huge deal out of Ian, a 2022 hurricane. It's speakers didn't mention that, time after time, while still travelling in the Atlantic, a hurricane has been known to reach a Cat 5 Speed, very briefly and very temporarily. Well, Ian made landfall as a Cat 3, not as the End of the World.
As land is approached ... or as a northward direction is traveled ... hurricanes have been known to tone-down. This is why a total of 4 ... and no more than 4 hurricanes ... made landfall upon the continental United States at the Cat 5 status, since 1851.
And remember, this has been written by someone who lived in one of America's Hurricane Alleys, throughout a ten-year period. He knows what to except, through first-hand experience. Let us begin, shall we?
The 2022 Hurricane Season was average in its number of storms --- only slightly below average. It's Accumulated Cyclone Energy (A.C.E.) scale number was moderately sub-average, at 95.1. Average is 115. The year with the highest index number was 1933, at 258.57. The Year 1926 was close, at 229.55. Yet, the Year 2005 was even closer, at 250.12.
None the less, some of the most furious hurricane seasons transpired while atmospheric co2 levels were a lot lower than today. This topic has been repeatedly addressed in specificity, at the Blue Marble Album. The top right-hand corner is where this website's search box is located, for those who really do care to learn a few extra things about life --- or a few needed things about life.
For those with short memories, there was only ONE major hurricane in 2022. In fact, in the entire history of the United States, a grand total of FOUR category 5 hurricanes made landfall upon the continental United States.
Keep in mind that Al Gore told the world that, from 2006 and onward, the Category 6 hurricane would become the frequent norm. Gore was completely wrong. The past 18 years proved this to have been the case. Gore turned out to be a false prophet, even though he acted as if all that he predicted finally came true in 2022.
Well firstly, heated summers have occurred throughout recorded history, as has been illustrated at the Blue Marble Album and elsewhere. And secondly, in 2021, the Antarctic had its coldest Winter in all of recorded history. There is no way that overwhelming "global warming" is going to prevail throughout the world, when at least one of its polar caps hosts the coldest season in history.
Concerning the A.C.E., it's the sum total of knots squared ... divided by 10,000 ... when measuring a cyclone's rotating wind speed every six hours. By the way, a knot is 1.15 miles per hour. Thus, 26 knots = 30 miles, and 80 knots is exactly 92 miles.
The A.C.E. used to be called the Cyclone Destructive Potential Scale. In fact, it's technically known as the Integrated Kinetic Energy Index.
Distinguishing Feature of 2022 Season: It was the first season in 25 years, where there was no named storm throughout the entire month of August. That doesn't sound much like a climate crisis. Previously, this happened in 1997 and 1961.
The irony is that, during July and August of the same year, the media was announcing that the world was literally on fire, due to the burning of fossil fuels. Detailed proof that this was a huge lie --- as it concerned the Greater London geography --- was published exclusively, at the Blue Marble Album, a few days after the very misleading and hysteric newscasts were aired. Everyone else was way behind in uncovering the truth about today's Climate Liars & their false-light July reports.
In brevity, there is a sensible reason to explain why there were no storms in August of 2022. ANS: Whenever such a thing occurs, it's always due to STRONGER VERTICAL WIND SHEAR (which see.) Of course, it's also due to the vague-sounding "greater atmospheric stability."
If the Climate scenario of 2022 were as dire as the commercial media mouthpieces made it out to be, there would NOT have been a stormless August in the same 2022. There would not have been the record cold weather in Australia, and there would not have been the series of record colds elsewhere on Earth in the first half of 2022, including Brazil. And there certainly would not have been the most coral cover throughout the Great Barrie Reef in 36 years.
The 2022 replenishment of coral occurred in two of the three sectors of the reef. The other third of the reef became a buffet table for hungry crown-of-thorn starfish. Starfish did it; NOT co2 or any other greenhouse gas. Incidentally, 90% of all greenhouse gases (by volume) is Water Vapor. Water vapor carries zero carbon footprint.
Of course, those who line their pockets & pocketbooks with taxpayer dollars say that every year is the hottest year thus far. Well, constantly stating this is an indictment upon the NOAA & NASA & government advisor scientists. They say things are getting hotter, but they do nothing to make things cooler, after 34 years of hype that began with Jim Hansen in a senate subcommittee hearing (in June 1988). Thus, their value, by their own admission, is nihil ... at least nil.
In as much, if every year is the hottest, year after year, then who needs any government scientist who do nothing to reverse the trend that they claim is occurring? But of course, their doomsday claims come with altered data ... with their "amended" charts & graphs, all of which, when revised, ever-so-coincidentally show that the Earth is burning-up and melting away. The same charts show opposite of what newspapers reported in the 1910s, 1920s, and 1930s. Outdoor workers entirely disagree with cozy nerd-boy scientists whose alteration of raw data is their greatest accomplishment.
Of course, the raw temperature data is altered by the government, via "homogenization." The government does NOT show the raw data to the public. It only shows the altered data. Dishonest people never show honest things to the public.
Anyway, the dishonest media claimed that hurricanes are now rougher and more frequent. Well, there were below-average years and above-average years of recent ... and throughout the past. There is no rising pattern and no decreasing pattern more than a few consecutive years at a time. Climate is cyclical, look a roller coaster, and sometimes mankind gets taken for a ride of historic proportions.
At other times, there is a lull in weather events. For example, there was a 12 year period when no major hurricane made landfall in the United States. That went from the end of Wilma, in 2005, until the arrival of Hurricane Harvey, in August of 2017. Of course, the commercial media didn't present this fact in bright neon.
Since then, there has been a trend toward more named storms, but not the Category 6 storms Al Gore predicted. Actually, in the past three years, there have been more of those low-intensity storms called Tropical Storms (the chart is posted below). Such a storm has a max wind speed of 39 to 73 miles per hour . That's something very survivable.
And concerning the commercial media's constant claim that hurricane numbers are increasing, ===> it only takes one hurricane to kill you. Even at that, a tornado can kill you a whole lot faster and much more forcefully than a hurricane. And the great irony here is that, in order for a deadly tornado to be formed, you need a COLD front. Yes, cold air can be very deadly. We live on Planet Earth. None of us is getting out of here alive. That's the reality check. The ultimate question is: What's beyond the horizon? What's beyond every horizon in the universe? Where do we go from here?
The strongest Atlantic Hurricane in terms of wind speed did not form in this decade or in the last one. It appeared 42 years ago, when co2 was 337 parts per million, and therefore 79 ppm lower than today.
The strongest hurricane in known history was Atlantic Ocean Hurricane Allen, in 1980 (Forty-two years ago --- a half a lifetime ago.) It's wind speed was 190 miles per hour (mph). This negates the claim that hurricanes are only now more furious than in decades past, due to the rise in atmospheric co2 levels. In the Autumn of 1980, co2 was 337 parts per million. That's 79 ppm LOWER than today. The Pacific Ocean typhoons were more powerful than the Atlantic cyclones. This is already covered elsewhere at the Blue Marble Album.
More Examples
The second most powerful hurricane in terms of wind speed is a four-way tie. Four hurricanes traveled at 185 mph. This included: 1} The 1935 Labor Day Hurricane, when the atmospheric co2 level was 309 ppm and therefore 107 ppm lower than today. 2} Gilbert in 1988, when co2 levels were 350 ppm and therefore 66 ppm lower than today. 3} Dorian in 2019. 4} Wilma in 2005.
As further examples, there were 175 mph hurricanes as far back as 1932, 1955, 1969, 1977, & 1979. Plus, there were hurricanes of the same speed as recent as 2005, 2007, and 2017. All in all, the media is making it sound as if all of the most powerful hurricanes occurred in the past five to ten years, and that is a huge falsehood. There is NO CORRELATION between atmospheric co2 levels and hurricane frequency ... and also hurricane intensity.
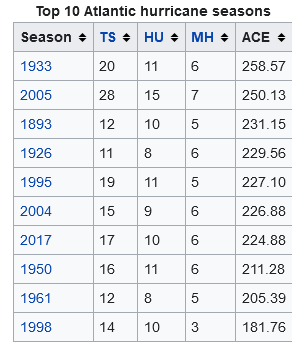
Here's another example: Below is a list of the most powerful hurricane seasons. Keep in mind that the ACE column on the chart stands for Accumulated Cyclone Energy.
Now, as far as concerns the single most energy-filled hurricane in history (assessed by measuring wind speed every 6 hours) it was the 910 millibar Hurricane Ivan, in 2004. It killed 64 in the Caribbean and 25 in the United States.
But, as far as goes the most energy-endowed hurricane seasons, they included the Years 1893, 1926, 1933, 1950, and 1961. That's 63 to 131 years ago, when co2 levels were significantly lower than today. They also included recent years, as in 1998, 2004, 2005, and 2017. (Add the Year 2020, as the tenth most active season on record.) So, things come close enough to becoming balanced, when comparing the power of hurricanes of old and the power of hurricanes of new. That illustrates that there is NO immediate ocean-related climate crisis.
Take note that the Year 2020 has replaced 1998, as the 10th most energy-powered hurricane season on record. It's A.C.E. was 184. It hosted 16 tropical storms and 14 hurricanes, 6 of which were major ones. It had two more storms than the #2 most powerful A.C.E. season. It had 10 more storms than the #1 most-energetic season, which was 1933. And what makes a hurricane season more powerful? ANS: Lower low pressure within the storms and less vertical wind shear during the storms.
As far as goes the claim that America has recently been plagued with hurricanes, let's review:
By the way, 2021 had 21 storms in all. 14 of them were the weaker low pressure systems, known as tropical storms. 7of them were hurricanes, 4 of which were Category 3 and higher. That was the year when Antarctica had its coldest winter known to science, and when numerous record high crop yields appeared throughout the world.
The Years 2011, 2010, & 2009 are missing from the list above. In as much, in 2011, there were 19 storms w/ 12 of them having been tropical storms, and 7 having been hurricanes, 4 of which were major. In 2010, there also were 19 storms. 12 were hurricanes, and 5 of those were major. In 2009, there were only 9 storms w/ 3 hurricanes, 2 of which were major.
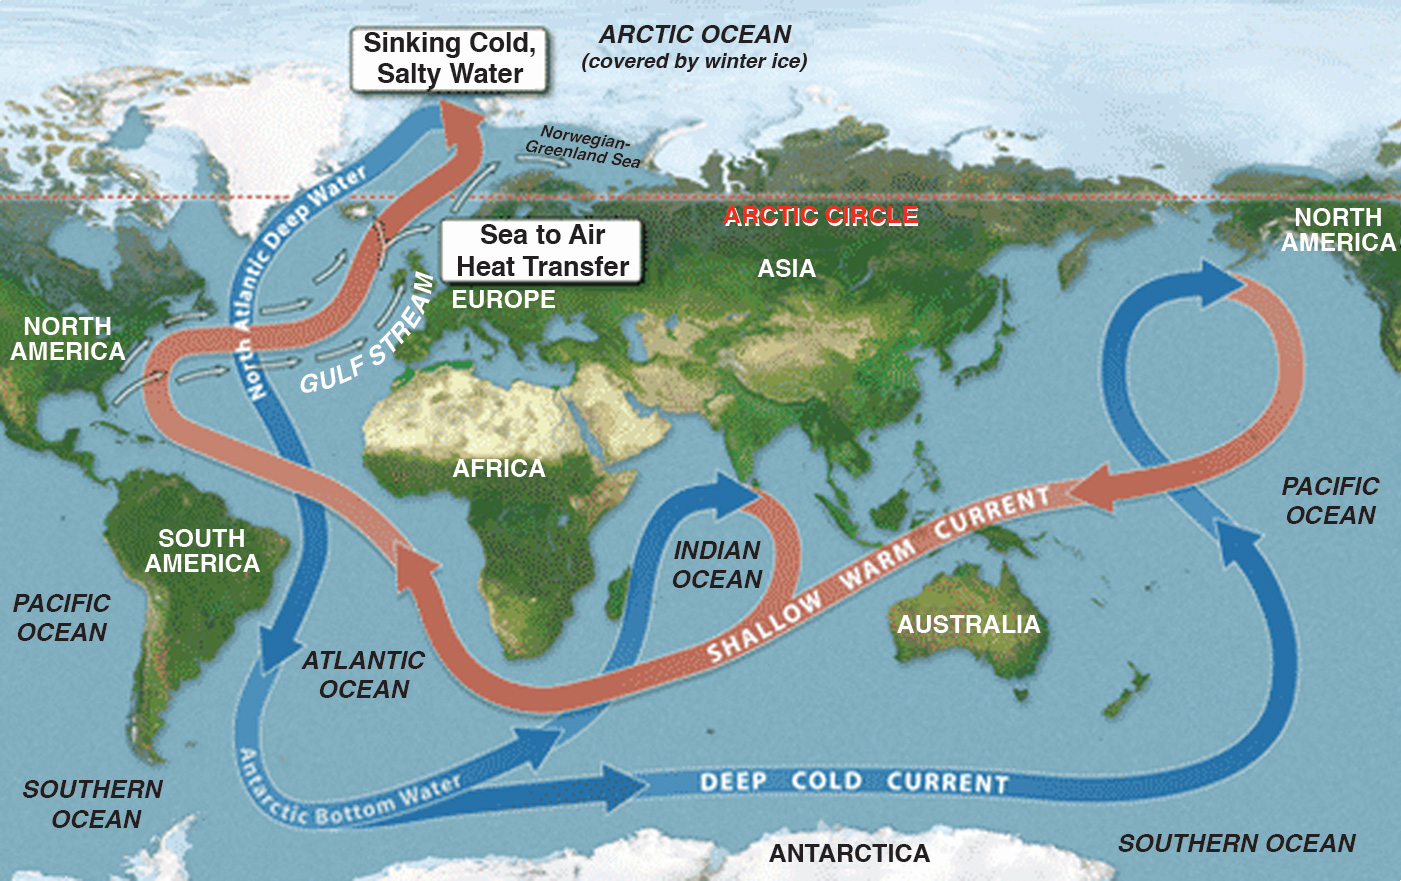
While we're here: The true ocean surface circulation are eddies --- gyres.
When it comes to explaining to novices ocean circulation, a map like this one is presented, when the Gyre Map needes to be presented. This is because gyres are at the oceans' surfaces. BTW, below you see the phrase, "DEEP COLD CURRENT." All deep currents are cold; 39F, in fact. None the less, the surface of all non-frozen oceans are gyres ... rotating tops, so the speak. A little gyre is an eddy.
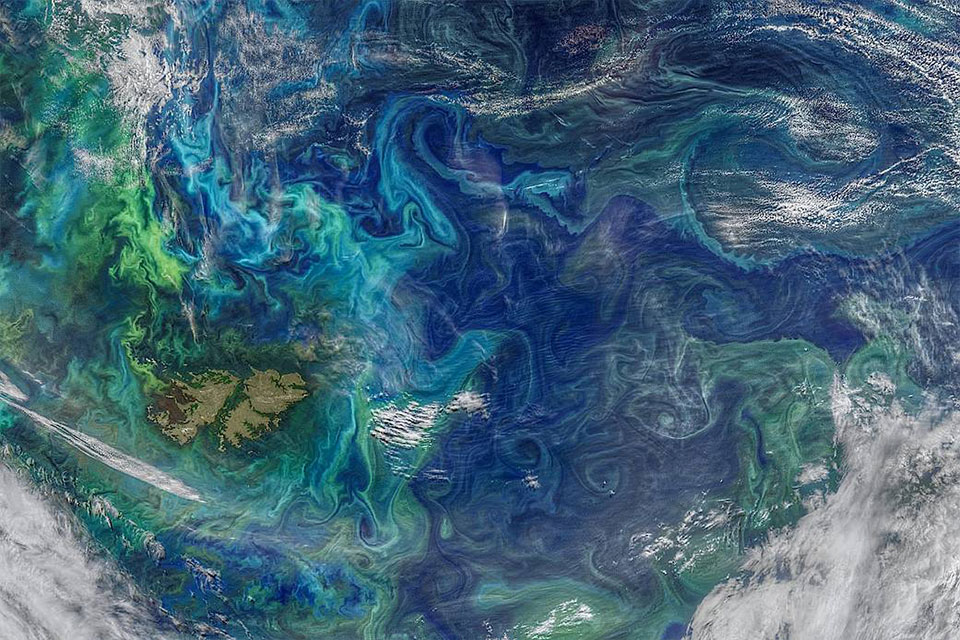
BELOW: This is the reality, compliments of NASA, in a much more localized photo. Take note of the very circular, gear-like eddies, especially toward the lower right hand side of this NASA photo. In fact, eddies border that specific Equatorial lane of ocean water known as ENSO, aka the Equatorial El Nino /La Nina current. Yes, the Pacific ENSO is bordered by eddies, aka small gyres --- round, watery gears.
You have been given 34 years of hyper-exaggeration, aka False-light disinformation. It hasn't ended. After all, Monsoon season is now being blamed on "the burning of fossil fuels." Yet, Monsoons have been a part of Climate all along, due to the fact that pressure systems rotate according to the Coriolis Effect, and also due to the fact that Planet Earth has a 23 1/2 degree tilt to it ... ... and additionally due to the fact that the northern sector of the INTERTROPICAL CONVERGENCE ZONE literally travels as far north as mid-India. That latitudinal floating action northeastward is India's monsoon season.
Concerning Monsoon Season in the American Southwest desert country, a high pressure air mass that's located partly on land and partly over the Gulf of Mexico serves the role of a gear turning clockwise, sending Gulf of Mexico water Northwest, into Arizona, Nevada, and Utah. That clockwise high pressure system constitutes their monsoon season. Of course, this is counter-intuitive & ironic, because "high pressure" usually means "dry air." Well, when it's partially over water, such a system becomes a clockwise-rotating water pump.
Incidentally, NASA has recently confirmed that there are two simultaneous Intertropical Convergence Zones positioned parallel to each other. One is in the Northern Hemisphere and the other one is in the Southern Hemisphere, with the Equator being the equilibrium point ... the return point ... of both zones. NASA calls them TWIN CONVERGENCE ZONES.
Here. Lookie see: https://earthobservatory.nasa.gov/images/2628/twin-convergence-zones
The climate hype has to end. So, the next time a hurricane comes, be respectful enough for the dead to be first buried and mourned, before giving your asinine conclusions about the cause of something which repeatedly brought intense destruction throughout the centuries, even when the atmospheric co2 level was below 300 ppm. There is zero correlation between devastating hurricanes and co2 levels. Hurricanes do NOT discriminate according to co2 levels. A hurricane is an equal opportunity destroyer, no matter what be the year or what be the co2 level.


