February 23, 2025

CO2 emissions: In decline in Europe & the US, since 1984, 1987, 1991

New England in the Summer of 2023.  Now, does this look like a Climate Crisis to you?

Social Hypnotism 

The Concept of leaving your "Carbon Footprint" in the sky shows that Climate Propagandists do NOT realize how asinine they come-off to the adult working class, especially in light of the fact that CO2 takes-up only 0.042% of the sky outside.  Meanwhile, Methane exists in the same atmosphere at only 2 parts per million.  Wings, clouds, kites, parasails, and birds of varying type are what people see in the sky; not hooves and not footprints.   

Of course, if the Climate Propaganda Machine is trying to convey the concept of you leaving a trail of carbon behind you wherever you go, then such carbon is known as particulates, and particulates always fall to the ground ... eventually ... due to something called gravity. 

The alternative concept is that of you carrying carbon around, wherever you go.  Well, you are carbon.  Of course, in having demonized carbon, the Climate Propaganda Machine demonized you personally.  They declared you the enemy of Planet Earth ... or at least a great nuisance to the planet.  Well, do you know what else is carbon ... pure carbon?  ANS:  Diamonds.  

The Atmosphere is already 99.9% Carbon-free.

None the less, in light of the fact that the Earth's atmosphere is already more than 99.9% carbon-free, the endless harping of the "carbon footprint" is merely another form of empty propaganda, much like the Iraqi Weapons of Mass Destruction campaign.  

The repetitive use of one-liners is the sign of a brain-washing con artist at work.  It's a form of hypnotism, where the speaker does not wish to inform, but only to persuade ... or even to force all others into some type of submission.  The submission consists in lots of money going into the pockets of the speaker.  In as much, the mainstream media cannot report anything contrary to the prevailing campaign bumper sticker slogan which, today, involves your "carbon footprint."  .

Accredited Scientists use a totally different approach, in selling to the public a belief in "global warming" only ... and not "climate change" per se.  

These individuals accentuate the concept of "Positive Feedbacks," in the search to catalogue the "feedbacks" which increase something called, Radiative Forcing.  The concentration of (the level of) CO2 in the atmosphere is far too small to drive any temperature grid.  So, the scientists added water vapor into the conversation, claiming that a rise in CO2 will rise the radiative forcing of water vapor 4 and 5 times over.  Of course, this never came close to happening.

None the less, the concept of Radiative Transfer is included in the debate package, along with TSI.  The inclusion of TSI into the debate also includes consideration of the Milankovitch Cycles (very long-term sunspot activity), as well as the 11 year Sunspot Cycle.  .

TSI is Total Solar Irradiance, and it is not to be confused with Solar Insolation.  At present, its average flow into & through Earth's atmosphere is defined as 1,361 watts per meter squared, on average throughout the year, depending on the season.  Solar Irradiance is an instantaneous measurement, while Solar Insolation is a cumulative measurement over a period of time.

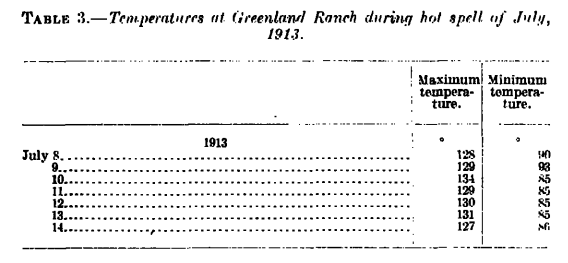
Thus far, all that came to be was temperatures close to the heated temperatures of 1895-96, 1901, 1905, 1910-11, 1913, 1921-22, and 1934-1936.  So, you can't be assured of any of the new climate model formulas recently submitted, to support the claim that CO2's rise in the atmosphere caused a positive feedback mechanism which elevated the Earth's average/mean surface temperature.  

There were very contradictory cold spans too, during the rise in CO2

This is especially the case, during the cold record-breaking winter of 2025, the notable winter of 2023, the other record-breaking winter of 2021 in the Southern Hemisphere, and the multiply record breaking winter of 2014, both in the Northern & Southern Hemispheres.  This include 2009-2010 Christmas holiday season, when the average temperature anomaly was minus 5F.  

Those weather events were the opposite of a rise in the Earth's mean temperature.  Even in 2008, the anomaly average hovered around minus 2F.  In fact, 1993 to 1995 were cold times, as were 1985 and 1986, when speaking in terms of temp anomaly.

The three vibrational modes of CO2 makes a huge difference, depending on the prevailing mode

The biggest and most invalidating feature of the pro-Global Warmer climate models is that the models did not differentiate between CO2's radiative forcing capacity while in its three different vibrational modes.  Not all CO2 molecules are alike.

All three vibrational modes of CO2 causes a different radiative capacity.  In fact, when CO2 is in its Symmetric Stretch Mode, it is incapable of absorbing any infrared radiation/heat beyond a half a watt per sq meter.   There is also the asymmetric stretch mode, as well as the bending mode which looks like a bird flapping its wings.  Thus, CO2 cannot be regarded as a fungible good of the same likeness, in any climate model.

NOAA said 130 years.  Someone did a tree ring report and said 2,000 years

And concerning the claim that 2023 was the hottest year in the past 2,000 years, this came from one scientist's tree ring assessment.  NASA had long since stated that 1934 was the worse drought year, in the past 1,000 years.  And during the very dishonest Biden Presidency ... where lying to humanity was the de facto policy ... NOAA stated that 2023 was the hottest year in the past 130 years, and NOT in the past 2,000 years.  

None the less, there were years of super brutal and tragic heat in the early 20th and late 19th Century.  And the decisive feature to this is that, according to the Michael Mann Theory of surface temperature, there should have not been any years of extreme heat in the early 20th and late 19th Century.  In as much, the prevailing thesis statement here is that:::  It has all happened before ... when the outdoor CO2 count was much lower than today.  Period.

Now, there are a number of posts at the Blue Marble Album which show that the hyper-exaggerated temperature and weather reports were nothing more than dishonest hyper-exaggerations ... in detail.  So too is this the case with 2022, such as the July 2022 Heat Wave hyper-exaggeration of London.  As far as goes the Year 2023, look for other signs which indicate a truly heated year.  If no such sign is there, then the recently reported "tree ring assessment" is yet another fraud.  In as much . . .

1a]  Did the Elbe River dry-up anywhere in Germany or the Czech Republic?   1b] In other words, were the engravings on the Elbe River Hunger Stones above the river's water level?  2] Were there an untold number of heat-related deaths in Paris, as there were in 2003, 1976, and in the very tragic Year of 1911?  

3]  As far as went the Tigris and Euphrates strife, that problem has been ongoing for consecutive years, and it traces back to dams that Turkey built by which water is kept away from the Euphrates.  The dams themselves are low on water.  BUT, it was NOT a 2023-only problem.

And of course, as a reminder, NOAA stated that the Year 2023 was the warmest year in the past 130 years ... NOT in the past 2,000 years.  And what was occurred in or around 130 years ago?  ANS:  The dreaded heatwave years of 1895-96.  

Quite frankly, 2023 wasn't hotter than 1911 ... and definitely not hotter than 1905, when it was so hot that the summertime waters of the Mediterranean was too hot for any human to enter without extreme discomfort.  

In as much, what you need to understand, in realizing the non-reliability of these claims of the "hottest-year-in-so-many-years" is that there was very little weather-monitoring stations throughout the world in the early 20th Century, the 19th Century, the 18th Century, etc.  So, how does mankind know what the temps were in many areas of Planet Earth without gathering "proxy evidence" from the natural terrain in those places?  This is why basing a hockey stick graph on the YAD-061 set is entirely insufficient for any truth to be conveyed.  

All valid scientific claims must match the Weather News History

HOWEVER, the one thing that is absolutely for sure is the Weather News Report History of the past 85, 105, and 135 years, as well as ship log entries, almanacs, and chronicles of centuries past.  Factual history doesn't change, until people as dishonest as the Biden Shadow Presidency changes it.

In as much, it was the factual weather history which showed us that "this has all happened before," concerning the weather events of the past 5 years.  This changes the face of the "Climate Change" Assertions, because the historic facts show us that there has not been much of a change in climate for over a 180 years . . . since the completion of the Little Ice Age, in 1840.  There has only been a repetitive trend, where climate is like a roller coaster.

Of course, administrations as vicious and as dishonest as the Biden Administration will seek to change history books and records. The Biden People did this display of dishonesty with the US Wildfire Graph.

All in all, you must admit that ... if you were following ... the Biden Administration literally lied about everything ... when the Biden People weren't hiding facts outright.  After all, everything that the Biden People did turned into a disaster of one degree or another.  Meanwhile, Joe spent his presidency at the beach.

Now, numerous photo-copies of news reports and agency stats are posted on multiple posts, in this Blue Marble Album.  As far as goes this particular post, everything is focused on national CO2 emission stats.  And we begin:

Enter the decline of carbon emissions in the skies of first-world & high tech nations

The present Climate Hysteria propaganda is that the United States, the United Kingdom, the Netherlands, Germany, France, Spain, Italy, Greece, Hungary, Japan, etc must decrease their carbon dioxide emissions, as if they haven't been doing so for years.  They mention the objective of reducing greenhouse gases. 

Well, 90% of all of Planet Earth's greenhouse gases, by volume, is water vapor.  Water vapor contains zero carbon in it.  

Now, 70.8% of Planet Earth's surface is covered by water, and 96.5% of all of Planet Earth's water is in its oceans.  Plus, the quantity of ocean water on Earth is 352 QUINTILLION gallons. 

As far as goes all of the water on Earth, in Earth, and above Earth, it's alleged to be 332.5 million cubic miles. One cubic mile of water holds 1.1 trillion gallons of water.   So, in order to truly decrease the Earth's greenhouse gases, you have to drain some ocean somewhere.  And to where would the ocean water go?

None the less, the emission of greenhouse gases that are not water vapor have been on the decrease for years in the United States, the United Kingdom, the Netherlands, Germany, France, Spain, Italy, Greece, Bulgaria, and even in Syria.  So, how much more does the modern alliance of America, England, and continental Europe have to do?  

As of May 2024, Planet Earth's atmosphere reached its highest level of CO2 in human history.  It even exceeded the CO2 levels of long before the beginning of human history.  Yet, under the Joe Biden Shadow Presidency, draconian measures were imposed upon the mass populations of what used to be called the Free World.  All of the regulations ... all of the impositions ... failed to achieve the Biden/Harris objective.  

The objective was to render a trace amount of a molecular compound into even a smaller trace amount in the sky.  And keep in mind that, at present, the sky outside comprises 0.0425% carbon dioxide.  99.9575% of the same sky does not ... contain CO2.

Of course, there is not enough co2 in the atmosphere to drive the climate, in the first place.  The climate is driven by the Sun & the Coriolis Effect, as well as the juxtaposition of air pressure systems & the variable types of surface area of Planet Earth.  So, the lesson here is that the media repeatedly hid encouraging truths from humanity once again.  CO2 emissions have been on the decrease in specific nations.  Yet, the people of those nations got no credit from the mainstream media and the Biden Shadow Presidency.

********************************************************************************

Let's start with the good ole USA.  Per capita co2 emissions there reached their peak in 1973.  Then, in 2004, the United States began its pronounced & consistent decline of per capita CO2 emissions, until 2020.  

Then, in the Year 2023 ... when it was time for the Biden Shadow Presidency to think in terms of a re-election campaign ... the USA resumed its per capita CO2 emissions decline/decrease.  Meanwhile, China's CO2 emissions sky rocketed into the sky, and no one objected to it happening.   Such a thing is known as hypocrisy.

Keep in mind that the chart below is of the United States;  NOT China.

         ***************************************************************************

Below:  The USA's aggregate (total) annual co2 emissions have been on the decline since 2007.  In sixteen years, until and including 2023, annual co2 emissions went from 6.13 billion tonnes per year to 4.91 billion tonnes.


*********************************************************************************

Below:  The very historic nation of Greece has also been decreasing its CO2 Emission since 2007, and more so than the United States.

***********************************************************************************Below:  Neighboring Bulgaria ... a neighbor of northern Greece.  It reached its height of CO2 emissions in 1987, when  the CO2 output there was 91.27 million tonnes.   At the end of 1992, Bulgaria's CO2 emissions were down to 57.46 million tonnes.  Then, in 2023, Bulgaria's yearly CO2 emissions count dropped down to 36.09 million tonnes.  Did CNN, MSNBC, the UN, or John Kerry ever report this?


******************************************************************************
Below:  The total annual co2 emissions of the UK have been on a steady decline since 2004.


*********************************************************************************
Below: 
Per Capita co2 emissions for the UK have been on the decline since 1971.  This means that the UK has long since cut its per capita co2 emissions in half.  Has CNN or MSNBC ever reported this?


********************************************************************************
Below:  Per Capita CO2 emissions in North America reached their height in 1973 and then went on the decline.  CO2 emissions there have been on a more pronounced & constant decline since 2005.


*****************************************************************************
Below:  
The total annual co2 emissions in North America  have been on a steady decline since 2007, when the yearly co2 emissions there were 7.36 billion tonnes.  By 2023, emissions dropped to 6.12 billion tonnes.


*********************************************************************************
Below: Total annual co2 emissions in France went on a sharp decline in 1979.  It leveled out and later went on a steady decline in 2005.  In 1979, the yearly French co2 emissions count was 533.25 million tonnes.  In 2023, co2 emissions dropped to 272.48 million tonnes.   This has been a significant decline.  Did CNN & MSNBC report this to the public?


**********************************************************************************
Below:  Next comes  neighboring Germany ... a neighbor of France, that is.  Its consistent decline in annual CO2 emissions started in 1979, at 1.12 BILLION tonnes.  In 2023, CO2 emissions from Germany dropped to 596.15 MILLION tonnes.   This was an annual average decrease of 47%.  Germany came close to cutting its co2 emissions in half.


**********************************************************************************
Below: Al Gore claimed that climate refugees were coming out of Syria in droves.  No, they were War Refugees.  Syria's annual co2 emissions have been on the significant decline since 2008.

                ******************************************************************
Below: 
Italy's annual co2 emissions have been on a significant decline since 2005.  See for yourself.


***********************************************************************************
Below: Nearby Spain ... near Italy, that is ... had a more pronounced drop in annual CO2 emissions.  It reached its height in 2005, with an output of 368.34 million tonnes.  By the end of 2023, Spain's yearly CO2 emissions dropped to 221.62 million tonnes. 


              *********************************************************************
Below:  As far as goes the European Union, it began its steady decline of CO2 emissions in 2006, with an output of 4.32 billion tonnes.  By the end of 2023, the EU's CO2 output dropped to 2.82 billion tonnes.  China's CO2 output did NOT drop.  It performed the opposite of the EU, the USA, the Netherlands, etc.

          
              *********************************************************************
Below:  The annual co2 emissions of oil-rich Venezuela has dropped significantly since 2013.  Did CNN or MSNBC let you know about this?

***********************************************************************************

Below:  Japan started its annual co2 emissions decrease in 2013.  

***********************************************************************************

Below:  Hungary reached its co2 emissions peak in 1984, before the dissolution of the Berlin Wall.  The annual emissions of co2 in Hungary steadily declined to the point where Hungary's 2013 emissions were half of its 1984 emissions.  This translates into a significant decline.  But, did CNN, MSNBC, the Guardian, or DemocracyNow let the public know this?

**********************************************************************************

Below:  The Netherlands began its consistent decline in annual CO2 emissions in 2010.

*****************************************************************************
Below:  Sweden's annual CO2 emissions decrease began in 1979, to the numerical tune of 84.87 million tonnes.  The annual emissions had been reduced to 36.56 million tonnes, in 2023.  This was a significant reduction.  Where was CNN & MSNBC, when it came time to report this?


*****************************************************************************
Below:  The continent of Europe started its annual CO2 emissions decline in 1990.  Annual European CO2 emissions went from 8.04 billion tonnes in 1991 to 4.99 billion tonnes in 2023.  That was a significant reduction.  Did CNN or MSNBC ever report this to humanity?

=====================================================================

The nation that unleashed CO2

It's China.  In the Year 1993 China emitted 2.92 billion tonnes of CO2.  In the Year 2003, China's CO2 emissions were 4.84 billion tonnes.  In 2013, China's annual CO2 emissions were 9.96 BILLION tonnes.  Then, in the Year 2023, China's annual CO2 emissions were 11.90 billion tonnes.  

In contrast, the United States' annual CO2 emissions count was 4.91 billion tonnes in 2023.
In addition,  Russia's yearly CO2 emissions for 2023 was only  1.82 billion tonnes. 

     *****************************************************************************
     Below:  China's CO2 output in comparison to continental-sized territories on Planet Earth

       Do you get the message, yet?  John Kerry has been flying to the wrong airports.
     *********************************************************************************
At the Sky High Inn, there is a lot of room for Carbon Dioxide

Now, the Number 1 Proof which shows that co2 is NOT a pollutant is this:  If co2 were a pollutant, then every time you exhale, soot would be coming out of your mouth.  A human exhales 40,000 ppm of co2 every time he/she fully exhales.  CO2 only exists at 425 ppm in the sky outside.  This means that you exhale 95 times more co2 into your immediate air space than exists in any equally-sized sector of the sky.  

More specifically, a human usually inhales only 0.042% of co2 when outdoors.  But, he/she exhales 4% of it, meaning that the human body makes co2.  

The fact that humans and cattle do NOT exhale soot is the sign that Climate Hysteria is founded upon a fraudulent precept.  However, it took years and years of endless brain-washing to make America's school students disregard their natural observations of life and to live in terror for the rest of their lives.  They are told that climate doom awaits them, unless they give all their freedom to Al Gore, Michael Mann, Bill Nye, etc.

The big "however" is that the United States' Occupational Health & Safety Administration officially declared that exposure to 5,000 ppm of co2, for 8 consecutive hours, is the "permissible exposure limit."  That is a concentration of 11 to 12 times more co2 than exists outdoors today.  Yet, co2 is presented as the new demon and Michael Mann is promoted as the new prophet, while Al Gore is treated as the high priest of the new Climate Religion.    The straight-lined hockey stick graph is their Bible.

The problem here is that all the vegetation on Earth dies when the atmospheric co2 count goes below 150 ppm.  CO2 is the bringer of photosynthesis.  CO2 is the molecule of life.  Yet, it's treated as the Angel of Death, Doom, & Destruction by the mainstream media.  Without CO2, without chlorophyll, and without bees, we all die-off eventually.  That's known as extinction.

******************************************************************************

 ACGIH stands for American Conference of Governmental Industrial Hygienists.
                                            Meanwhile, FSIS stands for Food Safety Inspection Service.                         

***********************************************************************************
Below:  The results of testing done on 36 qualified submarine crew members after exposure to either 600 ppm or 2,500 ppm or 15,000 ppm of co2, in a "subject-blinded" testing.      The conclusion is that people who are used to levels of co2 higher than outdoor concentrations do well, such as at the 5,000 ppm level.  Those not used to such levels of exposure will have trouble with decision making, but will  be able to  perform base-line functional tasks.  There's more, including other studies.  But, that is for another discourse.  The bottom line here is that co2 is NOT the hazardous poison Barrack Obama fraudulently made it out to be.                         

*********************************************************************************

So, let's review the molecular composition of Planet Earth's atmosphere  

The atmosphere of Planet Earth comprises:  [1] 78.08% Nitrogen, 780,800ppm   [2] 20.95% Oxygen, 209,500ppm  [3] 0.934% Argon, 9,340ppm  [4] 0.0425% Carbon Dioxide, 425ppm  [5] Neon at 0.001818%, 18.18ppm  [6] Helium at 0.000524%, 5.24ppm   [7] Methane at 0.00019%, 1.9ppm   [8] Krypton at 0.000114%, 1.14ppm    [9] Hydrogen at 0.00005%, 0.5ppm   and [10] Xenon at 0.0000087%, 0.087ppm . . . minus 0.2% to 4%, for Water Vapor.   Concerning this, the 0.2% is found in Antarctica and the high elevations of the Alpines, as well as in Chile's Atacama Desert.  The 4% is found in the Tropics.

At this point, do the math.  The sky outside is composed of 0.0425% (co2) + 0.0002% (ch4...methane) carbon molecular compounds.  This would mean that the Troposphere is 99.9578% CARBON-FREE.  

BTW, Sulfur Hexaflouride is the most potent greenhouse gas, and it contains no carbon.  However, it's presence in the atmosphere is 2.5 to 3 parts per TRILLION.  It's alleged to be 23,500 times more potent at capturing infrared heat than is co2.

Scorecard

Now, yearly co2 emissions due to human activity has reached the 35 to 37 billion tonne mark.  A certain writer whose name will politely be kept confidential stated that 40 billion tonnes of co2 per year would occupy 1,045,911 square miles of Planet Earth 9 yards high.  This translates into 5,348 cubic miles.  

Well, Planet Earth is 196.9 MILLION square miles in area, and the height of the Troposphere averages 7 miles.  196.9 million times 7 is 1,378,300,000 cubic miles of Tropospheric space.

Welcome to the Wide World of Mainstream Media's CONSTANT DISPROPORTIONALITY 

Now, a mile is 1,760 yards in length.  Seven miles is 12,320 yards in length.  Thus, 12,320 yards divided by the previously mentioned "9 yards high" translates into 1,368 layers (segments-of-9-yds-each) of Troposphere.

At this point, call to mind that the unnamed writer stated that 40 billion tonnes of co2 generated per year translates into 1,045,911 square miles outward & 9 yards upward being occupied by co2.  

Also call to mind that the 196.9 MILLION sq mile surface area of Planet Earth divided by the previously mentioned 1,045,911 sq mi = 188.35.  Thus, Planet Earth's Troposphere is 1,045,911 sq miles, 188.35 times over.  After all, 1,045,911 times 188.35  =  196,997,336 ... the square mileage of Planet Earth's surface area.

At this point multiply the 1,368 layers of Troposphere by the 188 sections of Planet Earth's surface area.  1,368 * 188 = 257,184.  In fact, the previously mentioned 1,378,300,000 cubic miles divided by the previously mentioned 5,348 yearly cubic miles = 257,722.   

At a yearly emission of 40 billion tonnes of co2, it will take approximately 250,000 YEARS for man-made co2 to saturate the Earth's Troposphere as much as co2 occupies the atmosphere of Venus.  

Moreover, to make the Troposphere of the Earth even reach the 0.1% mark in co2 concentration, 575 ppm needs to be added.  Thus, if the co2 count increased 2 to 3 ppm per year, it would take 193 to 290 years to accomplish this.  That's 1/10th of one percent and nothing more, in at least 193 years. 

Moreover, if the yearly increase in atmospheric CO2 rose to 4 ppm per year, then it would take 143 years for the CO2 level to reach a concentration of 1/10th of one percent.

10,000 parts per million = 1%.  1,000 ppm = 0.1%.  100 ppm = 0.01%.  425 ppm = 0.0425%.

In order to raise the co2 count to a mere 1% of the Earth's atmosphere, you would have to add 9,575 ppm of co2.  Thus, if you were to add 3 ppm of co2 per year, from January 2025 onward, it would take you 3,193 years to simply raise co2 to the one percent mark.  

If you were to add 4 ppm of co2 to the Earth's atmosphere yearly, it would take you 2,393 years to achieve the 1% mark.  Furthermore, if only 2 ppm of CO2 would be added to the atmosphere yearly, it would take 4,787 years to reach the one percent mark.   In the atmospheres of Venus and Mars, co2 stands at the 96% mark.  

The lesson here is that the Climate Hysteria propaganda teams scare schoolchildren with disproportionality.  The numbers used to scare children ... and to alarm their parents ... are low for a planet the size of Earth.  

Here's another example:  LIGHTNING:  According to the United States' CDC, lightning strikes Planet Earth an average of 8 MILLION times a day & 6,000 times every minute.  This could sound scary to a vulnerable schoolchild, if a propagandist is trying to frighten schoolchildren.  But, it's an amount of lightning that Planet Earth can easily handle.

https://www.cdc.gov/disasters/lightning/index.html  

https://weather.com/storms/severe/news/lightning-damage-trees-homes-buildings-ground-20130719

https://medium.com/@zippyfacts/how-many-times-does-lightning-strike-around-the-world-each-day-and-how-hot-is-a-bolt-of-lightning-89b653de1df8

One more example involves rainfall:  One inch of rainfall upon one square mile of the Earth's surface comprises 17.4 MILLION gallons of water, weighing 145 MILLION pounds. One gallon of water is 8.333 lbs.  It sounds like terrifyingly high numbers, but the Earth has been handling much wider and longer rainstorms throughout the millennia.  It's no problemo for the Earth.  Yet, a Climate Hysteria activist would try to twist the numbers into an End of the World scenario, frightening youth in the process.

Under Joe Biden & Kamala Harris, CO2 reached its highest level in all of human history

Now, atmospheric CO2 reached its highest level in the history of humanity, in May of 2024.  The reason for this is in a manufacturing and activation of the coal-fired power plants in China and India.  If you wiped all of the Americas and Europe off the face of the Earth, the CO2 rate would continue to rise, on account of the coal-fired power plants.  Being Draconian in America is pointless and worthless.  The Biden-Harris years of the dictatorial bullying of Americans accomplished nothing good.

February 18, 2025

Arizona & Nevada have Monsoons. Lake Mead rose. Vancouver froze.

Rain on Arizona's Interstate Highway 10, during the year of an alleged drought ... 2012.
The Earth's lower Tropospheric temperature anomaly for July 2022 was +0.36C.  London had one day of 100+ degrees Fahrenheit and one day of 99F.  History repeated itself in France (though not as tragically as in 1911, 1976, and 2003).  In addition, secrets formerly hidden at the bottom outer edges of Lake Mead have been uncovered.

The commercial media put loud speakers in the minds of its viewers, telling everyone that, as of July 2022, the End of the World had started ... and its all your fault, for driving cars, riding buses, and using that clean energy known as natural gas.  So, the commercial media & the social media placed July 2022 in neon-lights and then proceeded to present it in a false light.

Question Number 1:  When Lake Mead was constructed, how many people lived in the Southwestern states of Nevada and Arizona?  How many were projected to live there, in future years?  So, how many more people came to use Lake Mead water, as the decades progressed?  It wasn't co2 consuming Lake Mead water, it was humans, their pets, their lawns, and their farmland.

Lake Mead is attached to an entire waterway circuit, where water could be redirected away from the path to Lake Mead to the path to  . . . Lake Powell.  Lake Powell water levels were getting too low, in 2022.  So, Lake Mead was put on hold.  Thus, it was NOT co2 that was consuming Lake Mead water.  It was Lake Powell doing so, along with the increased population serviced by Lake Mead.

The media's assignment was Lake Powell.  It concentrated on Lake Mead instead, for effect ... for theatrics ... for scaring people into submitting to the Al Gore man-made-co2 end-of-the-world tale.

This is NOT Southwest USA.  This is Northeast USA, and there's lots of water ... in lots of places.
Below is an example of the sleight-of-hand fraud, mingled with outright lies, that is now an ongoing enterprise in the commercial media and even in "social media:"

You could, if you wish, begin with the false light reporting of the Greater London Area and its fires by which it was claimed that the increase in atmospheric CO2 caused an increase in the number of and intensity of Greater London Area fires. 

Read (or look at the pictures):  Greater London's 610 sq mi range has been having almost half the fires of decades past, despite the continuous rise of co2 throughout the same number of decades.

https://www.bluemarblealbum.com/2022/11/london-fire-statistics.html

https://www.bluemarblealbum.com/2024/05/July2022-official-greater-london-fire-stats.html

Now for the Southwest of America Saga

Next, the two medias (commercial & social) have been declaring that the American Southwest is engaged in its worst drought in 1,200 years.  The same medias declared that the Southwest has been undergoing a drought for the past 20 years.  And of course, photos of the man-made Lake Mead have been repeatedly shown.   It's located in Arizona AND in Nevada.  So, it looks like mankind has finally reached the turning point in its existence, where it's now ushering in a massive "extinction event" with all this drought ... according to the two kingdoms of media.  Now for the truth:

{1} Did you know that Arizona has a Monsoon Season?  Well, it does, and throughout July 2022 (when the media was telling you that this is the hottest and driest Summer ever), Northern Arizona was having above average rainfall. 

{2} In addition, Nevada also has a Monsoon season.  In fact, the Las Vegas Monsoon season of 2022 was reported to have been its WETTEST Monsoon season since 2012.  Hey wait!  The Year 2012 was the year of the great drought.  How does Nevada get above average rain during a drought?  How does that work, again?

{3} Lake Mead's water level rose in the hot hot & dry dry Summer of 2022, due to repeated rains on a land that was reported to be in a 20 year drought.

Do you feel "lied to" yet?   If not, then look at the exhibit below and the articles linked below:

Now are you willing to accept that the media is run by liars?
See:  Las Vegas Summer of 2022 having wettest Monsoon season since 2012. 

Also see: Monsoon rain entering Las Vegas casinos, 2022

Here, too: 2022, Vegas' wettest Monsoon season in ten years.

And this one:    August 2022: Lake Mead water level rises.


Now, look at the thin lines above.  Each one represents a recent year's water level.  Two years ago was 2020, and 2020 had a healthy water level, as did 2019.  The Years 2017 & 2018 were fine, also.  So, where is this 20+ year long drought that happens to be the worst drought in 1,200 years?  For the record, NASA officially stated in 2014 that the worst drought in the past 1,000years was the one in 1934. Do you feel "lied to" about the endless climate doom, yet? 

It wasn't a matter of juggling numbers in a statistics circus.  It was a matter of omitting the numbers and facts of various regions throughout this globe.   After all, the media harped on "Global Warming" without including the whole globe into the conversation. 

None the less, when weather events occur which prove wrong the doomsday predictions of the Climate Change activists, the media simply puts a false slant on the event which disproved the Climate Doomsayers.  Example:  Instead of saying, "Oh the drought is over, at least for now," the reporters will say, "flash flooding," and/or "unstable rain," --- "rain on a land not suitable for rain" --- caused by the burning of fossil fuels.  

Below:  The water level of Hoover Dam's Lake Mead of an Apr 27, 2024.  Keep in mind that the mainstream media, in July of 2022, proclaimed the countdown to the parched end of humanity in the American Southwest.  This was followed by sudden replenishment of multiple dams throughout America.  The doom-ridden predictions of 2022 became yet more failed predictions by those who market fear and dread.
All in all, you have been told a book shelf worth of lies by the Climate Doomsayers.  They will use angle shots and isolation shots, etc to make the scene look like doomsday.  They will sound negative in every aspect.  

Example:  Utah has Monsoon season, too.  Utah has salt flats and Utah Monsoons will get its share of flash flooding.  So, to a Climate Change Doomsayer, if it doesn't rain in Utah, it's evil, and if it's rains there, it's evil.  Utah is simply a loss to a Climate Change Doomsayer.

This is actually New Mexico, being that I was never in Utah and have no photos of the place.  My mom lived in Utah for short while as a child, though.  Well, anyway  . . . 
They are, of course, the most asinine people in the history of mankind, because they claim that "going green" consists in diminishing the only molecular compound on Earth which triggers photosynthesis and the budding of Earth's greenery.

The truth is that, if you want to "go green," you must first increase (or simply let be) the level of CO2 in your atmosphere.  The only thing that makes anything go green is CO2.  Yet, the Climate Activists are trying to rid CO2 from the planet.

This is equivalent to draining all the air out of your race car's tires, in the hopes that doing so will result in your victory.  This, ladies & gentlemen is a case study in Public Insanity which is actually a by-product of laziness & presumptive arrogance.

How green thou art.  Without CO2 this picture would never have been possible.  And quite frankly, you would have never been possible.  CO2 is the master key of photosynthesis which is the key to life on Earth.

More examples that disprove the media's claim that July 2022 was the hot & dry beginning of the End of the World:

One month prior to July 2022 was when the Tropics enjoyed the coolest June temperature anomaly in 22 years.  Yet, an American government agency reported that Planet Earth experienced its hottest June in human history.  Of course, this is instantaneously recognized as a lie, in light of the recently assessed Roman Warm Period proxy evidence, as well as the Minoan Warm Period findings of old.  

Then another U.S.government agency tuned-in, and reported that June 2022 was the SIXTH hottest June in the past 143 years, making things appear more believable.  

Oh, and let us not forget about the rooted Canadian tree stumps very near the Arctic Ocean, showing that the Arctic tree line was much closer to the Arctic shoreline in the past .  This means that the Arctic Past was much warmer than is the Arctic Present.

Canada experienced a cool Springtime in 2022, to the point of later experiencing record colds in Mid-May & Late May.  In fact, Vancouver had the coldest morning ever, in April of 2022.  

Yet, instead of highlighting the fact that Vancouver experienced a notable temperature anomaly of MINUS 1.5C in April, one of the headlines stated that Vancouver failed to break the all-time record for April, as if you were officially not allowed to regard the Springtime of 2022 as being worth your attention.

See:    Vancouver, Apr 2022: Coldest morning ever

None the less, the remarkable cold spell came only three months before the start of the July 2022 heat incursions.

Also in June 2022, Australia was having record cold in as far as goes the duration & persistence of cold fronts.  June 2022 was the longest streak of cold in 70 years, thereby offsetting any claim that June 2022 was the hottest June in recorded human history.  In as much, certain members of NOAA must be fired.

During the month of May 2022, Brazil went through record colds.  However, cool temperatures in the Spring and Summer months are too hot to handle, even when they occur during the Southern Hemisphere's Winter season.

You see, the commercial media has to keep humanity on a one-track, narrow-minded thought process.  Reporters beat like drums the claim that elevated amounts of the trace gas, Carbon Dioxide, infallibly increases the Earth's surface temperatures.  Yet, numerous records, archeological proxy evidence, and historic accounts testify otherwise.  

The latest findings of the Roman Warm Period is one such example.  It was recently ascertained via Mediterranean proxy evidence that the Roman Warm Period was 2.0 degrees Celsius hotter than today.

Speaking of the Roman Warm Period, the Univ of Arizona reported on the bristle-cone and tree ring findings of the Headwaters Region of the Rio Grande River, Colorado.   The surmise was that the Roman Warm Period in Southwestern America comprised a "multi-century period of unusual dryness between 1 and 400 AD, including an extreme drought in the 2nd Century."  Thus, things were far worse long before the invention of the combustible engine.  This era was when the atmospheric co2 level was 138 ppm LOWER than today.

See:  SW American drought conditions from 1 AD to 400 AD

Remember, Water Vapor is the gaseous version of this stuff, and it has ZERO CARBON FOOTPRINT.

Ironically enough, the month of July 2022 didn't have the highest temperature deviation (anomaly) in the past 12 months.  October 2021 did.  So, where were the end-of-the-world Global Warming sermons during or after October 2021?

February 17, 2025

But, Northern Arizona did have abundant rainfall in the Summer of 2022. Name the issue, and the media has been endlessly lying to you about it.

Me driving through the Oklahoma Panhandle during the drought year of 2012. (Cell phone photo)

Before anything else, in the event that you are a beginner to atmospheric science and/or American geography, know this:  In the dry dry regions of the United States, namely in Arizona, Nevada, & Utah, there is actually a Monsoon season.   This is important to mention, being that certain unconscionable individuals obsessively claim that the American Southwest has been going through its worse drought in the past 1,200 years. 

In fact, they claim that Arizona has been in a drought for the past 22 years.  Well firstly, Arizona in 2022 actually was above-average in its Summertime rainfall.  And secondly, if Arizona were enduring a drought for that length of time, there would be nobody living in Arizona today.  It's interesting how liars are not any good at lying.  Take note:

This is additionally mentioned, because the media made the Year 2022 out to be a dry & heated start of the End of Humanity & Life on Earth.  Well, climate IS cyclical, and there was a return to drought conditions in Continental Europe.  But, it takes much more to bring about the End of the World.

None the less, in the Summer of 2022, Arizona's Lake Mead water level actually rose ... about 15 inches.  Moreover, record cold temperatures and cold persistence records occurred in the Year 2022, in the Northern and Southern Hemispheres.  Concerning the year prior, Antarctica had its coldest winter in known history.  That was 2021.

Also needed to be mentioned is that, as far back as the Year 2014, the London Fire Brigade reported that the 610 square miles known as Greater London was now having half the fires it used to have in the 1980s & 1990s.  In fact, 2019 was the year of its least fires which was 17,993.  

This is mentioned, because the media claimed that the elevation of co2 levels caused more fires to be produced in the Greater London Area.  The opposite happened.  Fires decreased significantly.  Take note:

The Greater London Area has had years when it had over 50,000 fires; approximately eleven of the years since 1966.  In one year, back in the 1970s, Greater London had over 60,000 fires.  

One more introductory point:  In 1540-41 and in 1616 Europe had horrendous droughts.  This occurred when co2 levels were 281.3 ppm (1540) and 275.3 ppm (1616).  That amounts to 136 ppm and 142 ppm LOWER than today.  According to Al Gore and Michael Mann, those droughts were impossible.  But, the Central European hunger stones, in there etchings throughout the centuries, show otherwise.

Concerning the "hunger stones" that were recently found in central Europe, it proves that Climate is CYCLICAL.  This is because there are multiple etchings on those relatively large stones, with different dates on them.  This means that water levels in Europe decreased significantly multiple times, when the co2 levels were much much lower than they are today.  Each time the water level lowered significantly, someone would carve an etching at the lowered water line.  

Even the Year 1921 is etched on such a stone.  Those stone etchings are a climate record which proves that, in centuries past, lower water levels could occur, even in a climate low in atmospheric co2.  Thus, co2 alone does NOT cause droughts.

New Mexico, at the southern edge of the Rockies.  Technically, this is the Sangre de Cristo Mountains

Scientists and archeologists have repeatedly conjectured the existence of a 150 year mega-drought in the American West, starting in the final century of the Medieval Warm Period.   In confirmed specificity, (via tree ring analysis), there was a Great North American Drought which occurred between 1276 & 1299 C.E.  

This occurred long before the invention of the gasoline engine, when co2 levels were notably lower than they are today.   This shows that the Medieval Warm Period WAS a global event occurring in more than one Hemisphere, and not merely something limited to Northern Europe.

For the record, the Medieval Warm Period endured from circa 800AD to 1348AD.  In addition, the Mini Ice Age which followed endured from 1348AD to circa 1850AD.  

The precursor to the Mini Ice Age can be regarded as 1280, when the Wolf Minimum came into being.  But, the beginning of the Black Death was regarded as the starting point of the Mini Ice Age.  

The depth of the Mini Ice Age, as far as goes the least amount of Sunspots generated, was between 1645 and 1710.  Yet, cold conditions, mingled with summertime heat waves and even droughts, ensued into the early 19th Century.  

The Mini Ice Age is regarded as having ended with the Irish Potato Famine.  Well, it would have ended directly before the famine.  This is because the Irish Potato famine was the result of too much water and warmer than usual temperatures which became a breeding ground for the phytophthora infestans fungus.  

None the less, if that famine ... that "blight infestation"... would have happened this year, the media throughout the world would have blamed it on co2 levels and the "burning of fossil fuels."  Yet, the co2 level in 1847 was 284.7 ppm.  That's 133 ppm LESS than today.

Despite the scientific discovery of a great Medieval drought in America, it was in 2014 when NASA released the details of a study which found that the Drought of 1934 was the worst one in a thousand years.  That drought encompassed 71.6% percent of the western North American land mass.  This is more than the land mass affected by the Drought of 2012, which encompassed 59.7% of the same geographic area in general.  

In 1934, during the worst drought in 1,000 years, the atmospheric co2 level was 309 ppm.  That was 109 ppm LESS than it is today.  In all that is statistically being shown to you, you would had to have been brainwashed by public school teachers to deny that Al Gore spoke falsehood each time he said that a rise in co2 automatically results in a rise in temperature ... and drought ... and hurricanes ... and tornadoes ... and sea level rise ... and whatever else he mentioned.

None the less, the second most severe drought in America, as recognized by scientists, was the one of 1580, when co2 levels were significantly lower than in 1934 ... and today ... when the invention of the combustible engine was 310 years away.

See: NASA Study finds that the worst drought in the past 1,000 years was in 1934

Also See: The Worst Drought in a Thousand Years

Historical Palmer Drought Indices | Temperature, Precipitation, and ...
May 1934 was only the beginning of it all.  Summertime was yet to come.

The media deception employed today is to deceive the public into believing that no heat wave or drought in the past thousand years comes close to the one of 2022.  This also diverts attention away from the fact that, the year prior, Antarctica underwent its COLDEST WINTER in known history.  

The drought of this Summer (2022) extended thus far to 39.8% of the US.  The droughts of 1934, 1580, and 2012 have got it beat.  Plus, 1954 was a year of severe drought, as was 1936, not to mention the trio of 1988, 1989, & 1990.  There is also a drought list of centuries prior.  All in all, the United States government officially asserts that "Drought is a normal climate pattern that has occurred in varying degrees of length, severity, and size throughout history."

The exact same United States government declared that:

"Tree ring archives indicate that agricultural droughts such as those that happened in the United States during the 1930s Dust Bowl era have occurred occasionally over the last 1,000 years, and climate model simulations suggest that droughts that may last several years to even decades OCCUR NATURALLY in the southwestern U.S."   (This negates Michael Mann's and David Attenborough's claim that the weather/climate of the past one thousand years was predominately benign and stable.)

This recognition of the American Southwest's natural drought potential also includes Southern California.  In fact, it includes what is properly regarded as the Leeward Side of California, as well as the Santa Ana Side, and as well as the Death Valley side of the state.  Therefore, Gavin Newsom was 100% lying to you, when he stated that co2 levels finally reached the stage where the Apocalypse came to California.  

The lack of "controlled burns" in California for consecutive decades caused the disastrous volume of burnt acreage, in recent years.  When you let massive acreage of fallen trees sit for decades, you create kindling wood that can easily torch forestland as easily as can gallons of gasoline.   Even at that, the forest fires of the 1920s, 1930s, & 1940s, in acreage burned, were far worse than the ones in the 21st Century ... the Century of Liars in Power.

  See:   US National Integrated Drought Information System 

The horror stories of present doomsday droughts have one huge folly which makes the scientists announcing the dreadful conditions look like the stereotypical high school ~nerds, ~dorks, ~dweebs, ~geeks, ~wedgy boys, ~swirly boys, etc.  And that is this ====>  No one in America is thirsting to death in societal quantities.  Bodies are not strewn throughout the lands, in heart-wrenching scenes.  Houses are not covered with windswept dust.

The other outrage is in claiming that certain victims of war are victims of Climate Change.  In as much, there is a difference between a drought refugee and a war refugee coming out of Adiabatic Heating deserts or 30th Parallel convection deserts.   Example, Syria does have a desert and has had it for a long while.

It then got to the point where large snowstorms & record colds were attributed to evil evil Climate Change.   Sometimes, it was done by misinterpreting "Lake Effect Snow."  At other times, subtropical low pressure systems were called the cause of such storms, in a delayed effect of moisture retention in the sky.  However, it does not work "that way" when the time delay goes from August to December.  This is because, according to NASA, a water molecule endures in the atmosphere for an average of nine days only.  Therefore, a heated August will NOT be the cause of heavy January snow.

February 16, 2025

1913: co2 = 301 ppm = 116 ppm LESS than today. 1913 was the Year of Record Heat.

For the record, the surface temp heat record is 134F.  It was set in Death Valley, in 1913 ... when atmospheric CO2 was very low.  This is yet another piece of evidence which shows that the Al Gore & Michael Mann Model of CO2 driving the Climate is not true.  

In 1913, the outdoor CO2 count was 301 ppm.  Today, it's 427 or so.  If the Al Gore Model were true, no heated years in the early 20th Century would have transpired.  This is why the most important Climate Evidence for humanity today is the many newspaper articles of the 1900s, 1910s, 1920s, and 1930s involving heatwaves & drought conditions.  Let us proceed:

As far back as 111 years ago, the experts ... the observers ... the seafarers ... conjectured the Earth's glaciers would vanish in soon enough time --- mostly, by the middle of the 20th Century.  

Yes, Ladies & Gentlemen of the Jury, in the early 20th Century, it was predicted that all of the glaciers would have all melted by 74 years ago.  It was 74 years ago when the atmospheric CO2 level was 311 ppm.  That amounts to 116 ppm LOWER than today.  This means that all of the glaciers would have been long since gone, if the Al Gore & Michael Mann CO2-driver Climate Model were not a falsehood.  

Now, if the Al Gore & Michael Mann Theory of CO2-driving-the-climate were true, then the world's glaciers would not have had a regrowth phrase at any time since 1913.  Perhaps you have heard of the DECLINE that Michael Mann hid ... with a math trick ... assuming that you heard of the 2009 Climategate Emails which proved all of this "Climate Crisis" hype to have been a deliberate fraud.  

For those who are victims ... I means former students ... of the American public school system ... the decline is that which appears at the end of "the Briffa Reconstruction" graph below.  It's the temperature decline which included the Year 1979 as the year with the most Arctic Ice in recorded history.   It included the years 1941 to 1985.  It was cold times.  Some winters were very physically painful.

And for the record, Keith Briffa was a British climatologist stationed in East Anglia.  He died of cancer in 2017.  Long before that, Michael Mann elected to erase from the predominate graphs the temperature decline of 1940 or so to 1979 or so.  Keith was an expert in dendrology.  He was also a deputy director of the Climate Research Institute in East Anglia.

Even though the beginning of the 20th Century was being declared a time of cooling surface temps, by the Biden Administration, those times were the hottest of times recorded by modernized science.  The years of searing heat I wrote-about, at least a half dozen to a dozen times, already.  I stated that they were 1901, 1905, 1910, 1911, 1921, 1922, 1934, 1935, 1936 ... and even 1954 & 1958.  In fact, 1976 was a time of tragic heat in Europe.  But, the early 20th Century had the epic heat & drought.  

Today, the US government employees perform an alteration of the "raw temperature" readings, via a poorly explained act called "homogenization."  People would be less deceived, if the present president of the US would issue an executive order demanding all US governmental charts, tables, and graphs to only include RAW  temperature DATA.  Homogenization in graphs & tables must be banned.  Or the formula for arriving at such altered DATA must be published for all to see.

At the beginning of the 20th Century, the ice was getting thinner.  The seafarers were literally noticing Glacier Retreat, firsthand.  As far as goes Glacier National Park, it was first predicted that all of its glaciers would disappear by 1948.

The bottom line is that it is 100% false to claim that the world is going through "unprecedented glacier decline."  This exact same thing occurred in the 1910s, '20s, and '30s.  It's not unprecedented.  This has been occurring, on and off, for over a hundred years.  It's the same old same old, illustrating that Climate is Cyclical.
https://images.squarespace-cdn.com/content/56530521e4b0c307d59bbe97/1468167019140-DGERBEMDTDX6KTWF0WFS/DV_obs.png?content-type=image%2Fpng
The Hottest Day:  Thursday July 10, 1913, Greenland Ranch, Calif, presently called Furnace Creek.

Always remember that the scientists who presently claim that there's "a clear & present climate crisis" have a financial CONFLICT OF INTEREST that will cost the American taxpayer even more than the present $36 trillion national debt.  Firstly, the scientists make their money on claiming that a crisis is occurring somewhere in United States Taxpayer Jurisdiction that only they can solve, provided that you pay them lots and lots of taxpayer dollars.  They only say what they say, in order to get YOUR TAX DOLLARS into their pockets.  By telling you that there's climate crisis is how they make their money.  It's theft by Deception 

Only people who have no financial interest in stating "it's-true" or "it's-a-scam" have the right to assess the credibility of the present greenhouse gas assertion.  That assertion is that [a] 2 per parts per million of methane is going to cause the world to come to an end, along with [b] one part per 3 million of Nitrous Oxide, and [c] 1/2 of 1/10 of 1% of the atmosphere which is occupied by co2.

At this point in time, the two things which are 100% sure is that 1} Planet Earth is NOT at a point of no return, 2} Climate is cyclical.  Within that cycle are very nice weather seasons and very deadly ones, depending on the stage of the cycle.  3}  The Great Environmental Crisis today is the glut of synthetic chemicals allowed to permeate every part of modern society, as well as PM2.5.  PM2.5 stands for Particulate Matter smaller than 2.5 microns.  

Additionally add any of the unfiltered pollutants coming out of the newly built Chinese and Indian coal-burning power plants.  This even includes mercury.  That's your climate crisis, Ladies & Gentlemen.

Number 2

Secondly, in order to get your dollars into their pockets (via congressional funding or ngo funding), they have to create a catastrophic disaster that will result in the immediate end of the world, without their taxpayer-funded services.  

Third, they constructed a narration of pending doom which is really easy to refute, concerning what was stated in congressional committee & subcommittee meetings.  Her is an example of the Climate Change Movement being a total farce:

A certain individual who should be prosecuted for lying to Congress stated that the added atmospheric co2 will soon make all the oceans corrosive, killing all the ocean life.  He said that this will happen when the ocean water's PH reaches 7.7.  STOP right there.  This was a blatant lie that even someone as clueless as an American politician could catch.  Observe . . .

A 7.7 PH is alkaline, also known as BASE.  Neutral is a 7.0 PH.  At present, the ocean is 8.1.  PH does not acquire corrosive properties until it reaches either 4.0 or even 11.0.  Too much alkalinity is as caustic as too much acidity.  .

 Let's review once again:  Claims of melting glaciers were in progress as far back as over one hundred years ago.  This is NOTHING NEW.  The concept of "global warming," "climate change," and "glacier retreat" existed over a hundred years ago.  Yet, all of those glaciers are still with us to one extent or another, except for the Okjökull glacier in Iceland.  One missing glacier isn't the End of the World.  In fact, it's cold temperatures that kill humans, wild animals, pets, crops, leafage, etc.


*****************************************************************
By now, you should get the message, if you are  not an avowed liar, looking to cash-in on some of that US Congressional Funding, coming from a nation that is 36 Trillion in debt.

February 15, 2025

The "Antarctic" record high of 64.9F occurred on a peninsula 1,840 miles away from the South Pole and 206 miles outside the Antarctic Circle.

Photo by Marissa Goerke, Jan 6, 2021.  Palmer Station, Anvers Island, (aka Antwerp Island.)
The never-ending climate doomsday deceit: Subject, Antarctica.

 It was reported that Antarctica reached a record high 63.5 degrees Fahrenheit, in the Southern Hemisphere's Summer of 2017.  The brashly done report made it appear that a countdown toward a melt down had started within the Antarctic Circle. This would logically result in a crisis stage sea level rise occurring in the near future.

  Then, three years later, in the Summer of 2020, the same location recorded a "record high 64.9 degrees Fahrenheit."  Upon this news, the prognosticators & commentators came out like a deliberated jury who just convicted a defendant of a felony.  It sounded as if all of mankind had to surrender all their lives and money to the Climate Change people, in order to be saved from drowning.  However, a super huge piece of information was completely omitted.  That information was that:

The place where those temperatures occurred was located 1,840 miles away from the South Pole, at a research station that was located 206 miles OUTSIDE of the Antarctic Circle.  In fact, it was located 700 miles from southern tips of Argentina and Chile.   It's called the Esperanza Base, and it's located near the tip of the Antarctic Peninsula.

Record cold appeared thereafter, and even CNN reported it

Then came a balancing-out event.  In the following year, the Year 2021, the entire Antarctic continent endured the coldest Winter in recorded history.  This record-breaking Winter technically NEGATED all Global Warming claims for that year, as much as did "the Global Warming Pause" for the years spanning from 1999 until the beginning of 2016.    

Likewise, the temperature "decline" that spanned from circa 1940 to circa 1975 negated any thoughts of Global Warming in the history books.  So notable was the Global Cooling of the 1960s and 1970s that scientists from the USSR and USA banded together to study and resolve the increase of cold and Arctic ice, at a time not so distant from today.

However, the 1920s and 1930s were the times when droughts and high temperatures, as well as wildfire frequency, were at their undeniable heights ... in as far as concerns honest people who do not alter the climate record.   The 1870s and 1890s were heated decades too.  The decades of the ultimate catastrophes were the 1870s and the 1930s.

The Comparable 1,840 mile zone in the Northern Hemisphere

Reykjavik Iceland is 1,787 miles from the North Pole.  Well, in 1939 it reached 86.9 degrees Fahrenheit in Reykjavik.  And of course, there was no 23 foot sea level rise that ensued.  In addition, Reykjavik reached 85F in August of 2021 as well as 85F in June of 1974, 84F in July of 1991, and 83F in June 1988.  In comparison, Esperanza Base could only get to 64.9F.  Why not 74.9F or 84.9F, like Reykjavik?

Incidentally, the year of the highest concentration of Arctic ice was 1979.   Moreover, there were years in the 1970s and even the 1960s when Arctic Ice was low ... for those particular years.  So, there is not a set course of ice coming and going, as Al Gore wants to deceive you into believing.  In fact . . .

... there is pertinence to the fact that de facto cult leader, Al Gore, amassed $280 - $330 million personal dollars into his personal financial portfolio, while sounding the "Global Warming" alarm ... which was changed to the "Climate Change" alarm ... on account of the fact that there was a cessation in Global Warming ... starting in 1999.  

You should understand this accumulation of climate alarmist financial wealth is another sign that this Global Warming Alarm was nothing more than the Global Warming Swindle.   The American schoolchild and the enrolled high school student are expected to be the accommodating dupes who will help the man-made co2 activists get even richer ... richer with US taxpayer debt which will be heaped upon the very schoolchildren conscripted into the service of Al Gore's and Michael Mann's financial portfolios.

You should understand Gore and his "associates" to be engaged in a racket, as in RICO laws and RICO indictments thereof.  You should also understand the False Claims Act, as it refers to whistleblowers who witness fraudulent climate claims that result in the payment of large sums of US taxpayer dollars to the fraudsters.  

However, as far as goes the fanatical high schoolers and even more fanatical college undergrads who do not have the wisdom that comes with decades of experience in working outdoors, you need to understand the power of indoctrination.  There was, of course, the example of the  Hitler Youth whose efforts lead them to the point of watching Germany turn into a scaled version of the craters of the moon.

Perhaps now would be an opportune time to view the 2009 Climategate Emails.

See:  =====>   The Climategate Emails w/ introductions   <=====

The lesson herein is:  Legitimate facts can easily be presented with disproportional perception and twisted into a lie. That's called "False Light" in American law.

map of Antarctica 

Dec 28, 1958.  South Pole Station.  Photo by US Navy and donated by Charlotte Koch.
 

February 14, 2025

The cause of the 2025 LA Fires that were nowhere near a record-breaking size

The Number 1 cause of the 2025 LA Fires was the "Blocking High Pressure System" ... aka "a high pressure ridge" ... in the Pacific Ocean, off of the California coastline.  Such a thing always comes with La Nina, along with a "variable Pacific Jet Stream" that does not travel through Southern California.

And of course, the Equatorial & Trade Wind ocean currents travel westward, during La Nina.   This results in a dry Arizona & Texas and a moist Indonesia & Australia.   In contrast, when El Nino is predominate, those ocean currents travel eastward, thereby making America warmer than usual.

High Pressure in atmospheric science always means "dry."  So, Southern California has been receiving perpetual dry air from the La Nina "high pressure ridge," amidst forests that were not cleared of their dead & dried timber.  Such timber is a very large matchbook, per timber piece.  Such timber, in large quantities, guarantees a tragic spread of fire.   Dry timber is fuel, and it ignited in January 2025, in the LA area.

Now, the Santa Ana Winds are also dry air winds.  They are the result of an air mass completing its "Orographic Lifting" up a "windward" mountain side.   This means that such an air mass cooled during its rise, and then created clouds, and finally rained throughout its rise up the mountain side.  

At the top of the mountain, only dry air remains in that air mass.  So, you get dry air from the Pacific Ocean's "high pressure ridge," along with very dry Santa Ana air, from the mountain tops of California.  This results in wildfires, if dry timber is in the path of the Santa Ana winds.  Incidentally, Chinook Winds, Foehn Winds, and Santa Ana Winds are the same thing.  

All in all, if you are going to be governed by clueless government officials who refuse to allow for the clearance of dead & dry wood, and if you are living between a Blocking High and the Santa Ana Winds, then expect everything flammable to go up into flames until the flames reach the shoreline.

The Hyped-up Exaggerations of LA 2025

Newscasts already used "record breaking" in the reports of the 2025 LA fires.  This was done to deceive you into thinking that this is a new phenomenon that never happened previously and which is a sign of a Climate Change Crisis by which you must surrender your freedom to Al Gore, Michael Mann, Bill Nye, and the mainstream media.  So, if you hear or read anyone claim that January 2025 had the "all-time" record breaking 1] wind and/or 2] burned acreage and/or 3] structures damaged and/or 4] financial costs during Biden Era Inflation, then respond with this:   

"Stop right here.  There were many worse fires long ago, when the atmospheric Co2 Count was much lower than today.   Plus, the satellite era is relatively new.  Therefore, there were hundreds of years of Western American fires not reported.   This means that no one has the data to know what the record is on anything involving Western wildfires."

So too is this the case with hurricanes.  Numerous hurricanes throughout hundreds of years of human civilization were not recorded.   There were no satellites available during those eras of time.  So, curb it when you get the urge to say "the all-time record."  You have no idea what the all-time record is, in any natural disaster category, when it comes to America.  America used to be called, the New World.

Numerous fires throughout history were far worse than the January 2025 LA Fires

The 2025 LA Fires consumed 41,000 acres of real estate.  The Peshtigo/Michigan Fires of 1871 incinerated 2.5 million acres.  The Great Fire of 1910 consumed 3 million acres in Montana, Idaho, and Washington State.  And the list of greater fires goes on ... and on ... and on some more.

a] The Peshtigo Fire of October 1871 consumed 1.2 MILLION acres of Wisconsin land.  b] At the same time, the Great Chicago Fire and the Great Michigan Fire burned 1.3 million acres.  Incidentally, the Great Chicago Fire only consumed 2,112 acres of land.  After all, there is a massive lake at Chicago's border.  

c] Canada's Great Fire of 1919 consumed 5 million acres in Alberta & Saskatchewan.  This fire was 122 times LARGER than the LA Fires of 2025.  d] Then, in 1950, the Chinchaga Fire of British Columbia & Alberta consumed 4.2 million acres of land and created a unique smoke pall that colored the Sun lavender and violet.

e] The 1825 Miramichi Fire in New Brunswick put 3 million Canadian acres out of commission.  The CO2 count at the time was a mere 284 ppm.  Well, according to the Al Gore Theory of Climate, no major fire eruption should have occurred during a time of low CO2.  Yet, the Miramichi Fire of 1825 was 73 times LARGER than were the 2025 LA Fires.  

f] In August of 1989, 1,147 wildfires ignited in Manitoba, burning 1.3 million acres.  g] Two years prior, in Daxing'anling  ... northeastern China ... 2.5 million acres were incinerated within one month's time.  It is known as the 1987 Black Dragon Fire.

h] The Siberian Taiga Fires of 2003 turned 55 million acres into charred remains.   i] The 1865 Silverton Fire of Oregon erased 1.5 million acres of forest.  j] The Adirondack Forest Fire of 1903 charred over 470,000 acres of New York vegetation within a six-week period.  

k] In 1889, 300,000 acres burned in California's Santiago County Fire.  l] Five years prior, in Minnesota, the Great Hinckley Fire burned 160,000 acres and took at least 418 lives, along with 12 towns.  

m] The Great Porcupine Fire of 1911 incinerated at least 500,000 acres, in Ontario.  n]  In 1916, there was the Great Matheson Fire that incinerated 490,000 acres of Canadian land.  o] Then, the Timiskaming District of Ontario saw 415,000 more acres of land incinerated, in 1922.  

p] Eventually came 1923, when the Giant Berkeley fire destroyed 50 city blocks, as well as 624 buildings, in California.  Deja Vu, America.  "It" already has happened before, in the San Francisco area, 101 years prior.  2025 was a Deja vu of 1923.

q] In 1933, the Tillamook Burn consumed 350,000 acres, in Oregon.  r] Eventually came April 1963, when 183,000 acres and 400 buildings were incinerated in New Jersey, during the Black Saturday Fire. 

s] And as far as goes the Black Friday Fire, it was actually the 1939 Black Friday Bushfire, in Southeastern Australia.  It consumed 5 million acres of drought-ridden land.   t] Eventually came 1970, when 175,425 acres were burned in San Diego County and the Laguna Mountains.   That 1970 fire was four times LARGER than the 2025 LA Fire.  Yet, the 1970 CO2 Count was only 327 ppm, compared to the 425 ppm of late 2024.

In addition, there were numerous major city fires throughout history, as well.  This brings us to a question:  What record was broken in the 2025 LA Fires?  Compared to the true record-breaking fires, the LA fires of 2025 are chump change.  Hello?  Has anyone been home, in government & in news reporting, for the past four years?  

You must stop marketing terror & fear, in claiming the existence of a never-before-seen Climate Crisis.  The past five years had no weather event worse than those that transpired previously, in decades and centuries past.  

Quit using the phrase "record breaking.'  After all, Climate involves average & typical weather.  NOT any once in a lifetime broken record.  

None the less, the LA Fires were not a once in a lifetime event.  They were a smaller version of what has been happening, since 1871.  The 2025 LA Fires were actually less tragic, less in intensity, and less in space-consumed than dozens and dozens of other fires.  Quit scaring school children and dimwitted middle-aged women who believe that CNN is the Voice of God.                  

Below:  It's information which was hidden by the Biden Administration.   It's the amount of acreage burned throughout the United States in wildfires, per year, starting with 1916.  

Remember one thing.  The reports of massive forest fires are in the newspapers of decades past.  Thus, you lie if you say that those massive & frequent fires never happened.  Moreover, mankind did NOT have the technology to put out the late 19th & early 20th Century wildfires.  Thus, such fires easily became massive ones, especially during the drought-ridden 1930s.  And concerning this, keep in mind that NASA officially stated that the greatest drought year in the past 1,000 years was 1934.  

Plus, the American West didn't have the population needed to do the fire-fighting work in the 1920s & '30s.  And as far as went the early 1940s, the American male population was literally fighting on THREE war fronts, while many women were providing logistical help and the production of battle ordnance.   Thus, in 1943, while WWII was at its height, the US launched the Smokey the Bear Campaign.  

The presence of the Smokey the Bear ads means that, even in the early 1940s, forest fires were a great problem in the United States.  Therefore, the newspapers and magazines of decades past show that the chart below is factual.  There was an outrageously large amount of timber and brush burned throughout America so much so that nothing today compares.  This includes the LA Fires which easily could have been prevented, if only Californians would vote for people of common sense & natural instinct. 

None the less, the graph below is a Pre-Biden United States government product.  It is NOT the product of MAGA hat-wearing gun-toters in Texas or Alabama.   Even at that, 77.3 million voters were not merely MAGA hat-wearing hillbillies from the boonies.  City Slickers & Suburbanites voted for Trump, too.  

More importantly, millions of American rural folk know how to read & write, as well as perform work requiring mechanical aptitude and the reading of technical manuals.  Those people have to know how to read gages/gauges, and those gauge readers are more valuable than arrogant Humanities Dept profs whose topics are mostly subjective or subjunctive.  

It's more important to master a CDL exam than a Shakespeare exam.  And this statement is coming from a guy who does have literature sitting on a Harvard University library bookshelf, a Northwestern Univ library bookshelf, etc, as well as having literature in anthologies which also contain the works of national book award winners, a Pulitzer Prize winner, a Walt Whitman Award winner, etc.

It's the network media personnel who have shown themselves to have the "lower-than-expected" intelligences.  After all, Wolf Blitzer made an embarrassment of himself on Celebrity Jeopardy.  And he wasn't the only newscaster to do so.

It was only natural that fires in "those days" and in the 19th Century were catastrophic.  The number of yearly fires since 1960 do not compare to the yearly number of fires which occurred from 1929 to 1950.  This is more evidence that there is no climate crisis.  Things were worse in the Past.  Politicians and activists looking for lots of money and power having been lying to humanity, all along.