
 |
| In review, the Atlantic would soon cool down thereafter, and sea ice would increase and then decrease and then increase the most in 1979. But, the Biden Administration kept the Truth away from humanity. The Biden Presidency was a presidency of lies. |
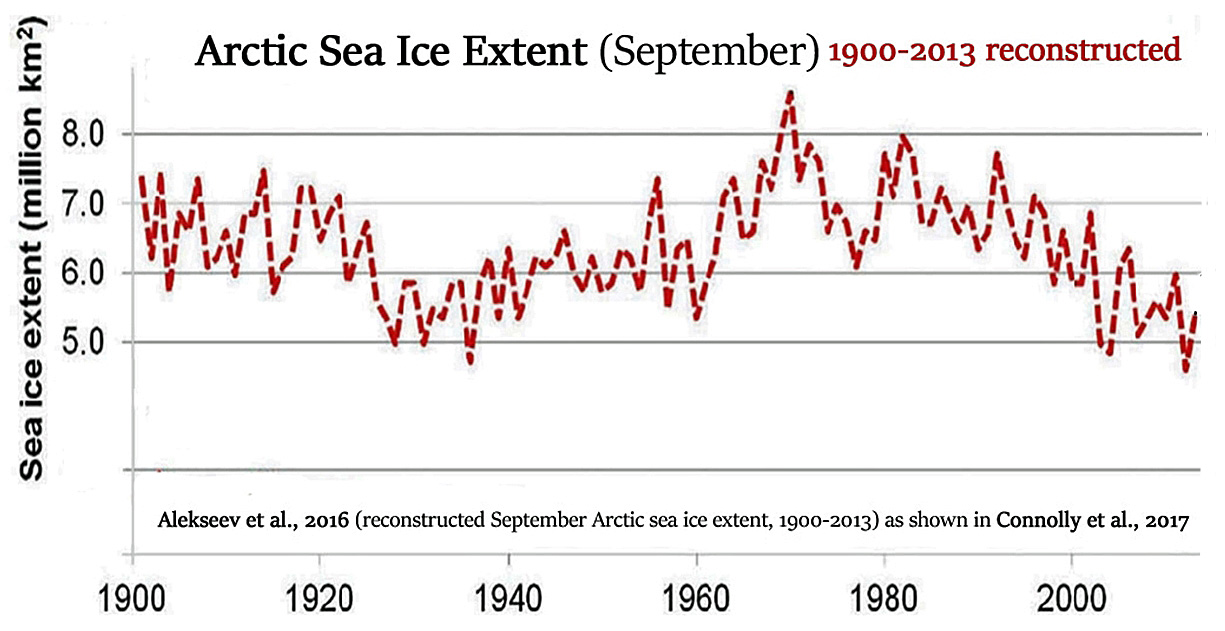
As a reinforcement of learning, here is a chart that concurs with the reality that there were low-volume (low-cover) Arctic ice years before the high volume ice year of 1979. Thus, it has NOT been a one-way decrease of ice into nothingness, as the Al Gore people would want you to believe. Climate is cyclical, like a roller coaster:
 |
| The pink-shaded part is the part that the Biden Administration no longer showed the People. None the less, Arctic Ice cover was low (at times) even before the "Global Warming" Scare began. Showing this chart to the public would negate the entire hysteria of it all. The Biden Administrators couldn't bring themselves to let the People of America be at Peace. "They" had to keep the People in a state of fear, so that "they" would not lose power. This is why Michael Crichton wrote, A State of Fear. The irony is that 77.3 million Americans couldn't tolerate the Lies of the Biden Shadow Presidency. Politicians who thought that they would remain in power through lies lost power because their lies. |
Let's also address the altered Forest Fire Chart of the less-than-honest Biden People. Today, that chart begins with the year of the least number of forest fires ... 1983. Thus, the Biden People make it look as if 1983 were an average year, and all the other years to follow had doom-ridden increases of fire ... presumably caused by increased atmospheric CO2. However, CO2 was far less in the atmosphere, when burnt fire acreage exceeded 40 million acres per year. In as much, I would like to introduce you to the true United States forest fire acreage chart which has NO CORRELATION to any level of CO2 and which came long before the very dishonest Biden Shadow Presidency.

Speaking of liars, there is also the matter of Michael Mann claiming to be the co-winner of the Nobel Prize. Concerning this, it was NOT the Nobel Prize in Science that he claimed to have co-won. He claimed to be the co-winner of the Nobel Peace Prize.
None the less, the following link will take you to the video which will show you that the Nobel Foundation does NOT recognize Michael Mann as the winner or co-winner of any kind of Nobel Prize. This illustrates that Michael Mann is nothing more than a lying con artist who has no problem absorbing American taxpayer dollars ... like a vacuum cleaner ... on steroids. You are living in the Age of Climate Racketeering.
The Next Total Falsehood from the Climate Nazi Klan: London Fires.
The following chart comes from the London Fire Brigade. It shows that the number of yearly fires in the 610 square mile range of Greater London has decreased significantly. The significant DECREASE occurred, while atmospheric CO2 levels consistently increased. In fact, it was the Year 2014 when the London Fire Brigade officially announced that present London Area fires have dwindled in number to almost half of the number of fires in the 1980s & 1990s, per year.
However, in 2022, a few liar journalists claimed that rising CO2 levels caused an untold number of fires to ignite London. Very False. The number of London Area fires SIGNIFICANTLY DECREASED throughout the exact same time span when co2 levels were incrementally rising. The London Area fires also DECREASED, while the London Area population increased by 1.3 million people, since the Year 2000.
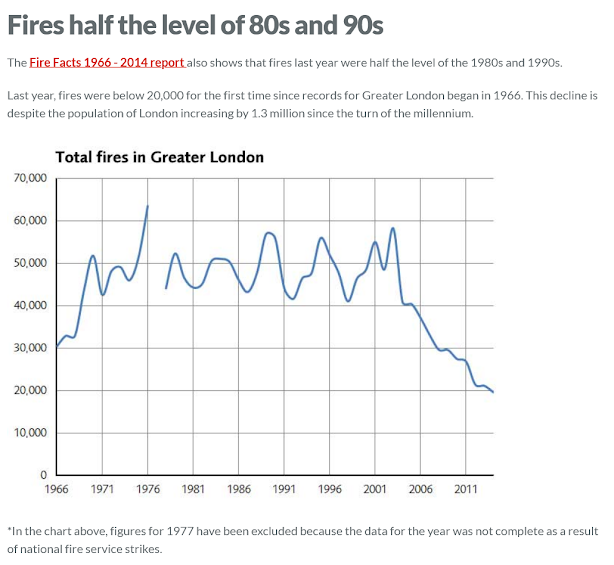 |
| Keep in mind that this chart was officially released by and through the London Fire Brigade. |
This shows that there is NO CORRELATION between co2 levels and British fires, as well as population increase and British fires. Liar journalists should be fired and sued for the intentional infliction of emotional distress. Scaring schoolchildren endlessly is a form of child abuse. It's the molestation of a schoolchild's mind.
In order to put things into perspective, know that Oxygen, Nitrogen, & Argon comprise 99.93% of the atmosphere ... minus the percentage of water vapor in the air. NOT much room left for much of anything else.
I repeatedly asked people, as a poll,
what percentage of the atmosphere is co2. The majority said "30%."
Only one person got the question almost correct. He was in Chicago,
where I experienced the coldest temperatures in my life ... and I worked
during -30F wind chills in Pennsylvania, and I endured brutal cold in
Massachusetts.
Well, everything that needed to be said was spoken in the facial expressions of the people who realized that they have been severely deceived by an orchestrated con game. They instantly saw things differently as soon as they learned that CO2 is only 416 parts per million ... 42 parts per 100,000 ... 4.2 parts per 10,000 ... 1 part per 2,403.
Meanwhile, nitrogen exists at 1,874 parts per 2,403. Oxygen exists at 504 parts per 2,403. Argon exists at 22 parts per 2,403 ... vs 1 part per 2,403 for carbon dioxide.

All in all, starting the sea ice chart at the year of the most accumulated ice accomplishes a predictable deception. It made it appear that the recent decline of sea ice were a never-before seen phenomenon. Yet, that depth of decline already occurred in the 1930s & 1970s (after man landed on the moon with technology advanced enough to detect Arctic sea ice volume.) Those two decades are not too far off in time.
The great mystery is how long will the politicians and their accomplices think that they can deceive all of mankind? The evidence proving them liars is blatant. The only trick is to hide the evidence from the People. It didn't universally work. Some people made copies of the evidence.
At this point, remember how confident everyone was on the "Iraqi Weapons of Mass Destruction." It was ALL an illusion ... a costly illusion ... a deadly illusion.
 |
| Climate IS cyclical, like a roller coaster. |
