Concerning the claim of 2022 being the year of doomsday heat: {1} Australia went through record cold weather in June of
2022, and two of the three sectors of the Great Barrier Reef were reported to have replenished very successfully. The third sector was dinner for hungry crown-of-thorn starfish. {2} In fact, Australia enjoyed one type of record crop yield in 2022, while enjoying a record high yield in another type of crop in 2021 (already covered at the Blue Marble Album.) {3} Ireland reported record crop yields for 2022, as in:
https://www.farmersjournal.ie/record-yields-puts-harvest-2022-at-an-estimated-2-42m-tonnes-736275
and
https://www.growtrade.ie/record-yields-for-many-crops-in-ireland-in-2022/
{4} Brazil went through record cold weather in May 2022. {5}
The Midwest of the United States went through record cold in October of
2022. {6} And in the middle of November 2022, the South Pole went
through back-to-back-to-back record cold temperature days, thereby
negating the claim that Antarctica is on a crash-course to
catastrophic ice melt and a sea level rise that will drown humanity. In fact, Antarctica had the coldest Winter in its recorded
history as recently as 2021. Observe the most recent news from Antarctica, as of November 2022:
 |
This Stefano Di Battista is not to be confused with the jazz musician who has the same name.
|
But of course, the focus was on the heated areas of Planet Earth, during the SUMMER of 2022. The
fact is that the equally hot summers of 1900, 1901, 1903, 1910, 1911, 1913, 1921, 1922,
1931, 1934, 1935, and 1936 all transpired when the atmospheric co2 level was
much lower than today; at only 296 to 309 parts per million. That is
108 to 121 parts per million LESS than today. In fact, during the
heatwave years of 1871, 1878, and 1896, the co2 level was even lower.
So, how could co2 be the cause of heat waves during heat waves that
transpired while the co2 level was too low to effect a change? Cirrus clouds have more heat retaining capacity than does co2, and water vapor is 90% of all greenhouse gases. Thus, water vapor is the determinant greenhouse gas, and it's carbon-free.
Meanwhile, the 1880s, the 1940s, the 1960s, and the 1970s were generally perceived as "Decades of Cooling." The 1910s, the 1920s, the 1950s and the 1990s were regarded as half-and-half. For example, 1921 and '22 were ferociously hot years, while 1928 & 1929 saw some of the coldest winter weeks in history. And of course, the 1930s were years of ferocious warming and even drought, as were the 1870s, a decade that transpired shortly after the end of the Mini Ice Age.
In sequence, 2012 was a year of heat waves. Yet, 2014/2015 gave humanity the coldest winter in 40 years. And 2015 was the record year of the most Antarctic sea ice extent. Then came heat in 2016, followed by cold blasts in 2017 & 2018, followed by heat yet again. Once again, over and over again, climate has been shown to be cyclical, like a roller coaster.
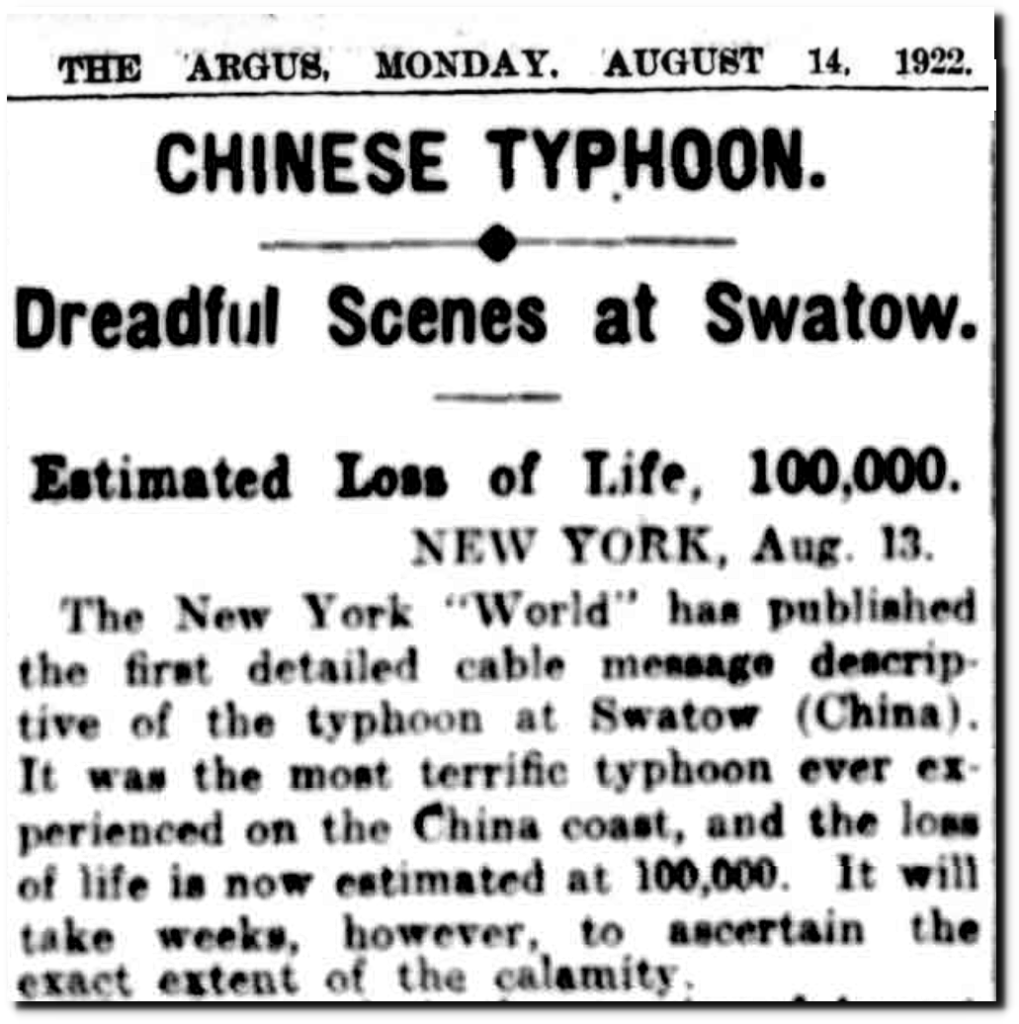
The bottom line is that the media and grant-seeking scientists stated that the weather of 2022 was "unprecedented." They are complete liars. The events of 2022 were very precedented. It all happened before, tragic time and tragic time, again and again ... all when co2 levels were very low. Casualties were still high, despite the low co2 count. Far more people died during natural disasters in 1922 than in 2022 and several other years combined.
|
| CO2 was 304 ppm --- 113 ppm LESS than today. This typhoon killed 50,000-100,000. |
Plus, on September 13, 1922, El Azizia Libya was reported to have undergone the hottest temperature ever measured on the surface of the Earth, at 136.4 Fahrenheit --- 58 "Centigrade." That temperature was put into doubt, being that El Aziza is 520 feet above sea level, in semi-arid land. However, the Jabal Nafusah mountains (located northwest) are 2,500 feet high, and this translates into the Adibiatic Heating phenomenon called the Santa Ana Winds, the Chinook Winds, and the Foehn winds.
Such winds come from "Orographic lifting" which renders an air parcel (air quantum) dry, when the air reaches a mountain top. Then, as the air parcel (air quantum) travels down the "leeward side" of the mountain, it compresses, it heats-up, and this process results in the sudden arrival of high temperatures at the lower surfaces of the Earth. In Libya, they are called, Ghibi Winds. So, that particular 1922 temperature reading has credibility too it. In fact, in 1923, the same region recorded a 135F temperature, when the co2 level was at 304 ppm; 113 ppm LOWER than today.
Despite the obvious cycle of climate between 1922 and 2022, the refrain was sung once again ... by the usual singing suspects, namely the less than factual
Al Gore and the less than honest Michael Mann. Once again, youths are
being used as useful idiots. History does repeat itself ... far too
often.
Yes, mommy and daddy won't buy into the con game. So,
schools get invaded by a predictable con artist politician bearing a very non-factual movie that told the children that massive flooding and Category 6 hurricanes would invade their homes, if they did not follow an Al Gore who was caught expending outrageous amounts of electricity at one palatial domicile, alone. In the end, the children get recruited, in place of mommy and daddy. And all that you have to do, to
make it happen, is turn teaching into the dissemination of propaganda. It's the Hitler Youth, all over again.
Gore's energy-consuming hypocrisy goes as follows:
"The Associated Press reviewed the Gores’ energy bills and reported that
the family consumed 191,000 kilowatt-hours in 2006. This was
considerably more than the amount of electricity used by the typical
house in Nashville, about 15,600 kilowatt-hours a year.
An older version of the e-mail claimed that "Gore’s average monthly electric bill topped $1,359." That figure
was just about right, according to the numbers crunched by the AP."
Take a free look at: https://www.factcheck.org/2009/06/al-gores-mansion/
Of course, in all of the propaganda that transpired, the teachers forgot to tell the
students that the $31 TRILLION debt accrued by Nancy Pelosi, Chuck
Schumer, all the "going-green" myna birds, and the military industrial complex is debt for the youth to pay ... in maybe 62 to 93 to 124 to 186 years. Or else all Americans will be caught in the middle of the nationally catastrophic bankruptcy of a worthless dollar, all caused by big mouths who were constantly given sound byte time on commercial & subscription television.
The accruing of an outrageously high debt was either an ongoing act of incompetency or outright theft done under the guise of
lawfulness. In either way, the youths pay, while the co2 level keeps on
rising, anyway.
Meanwhile, the politicians ignore the true enemies of Life on
Earth, namely Mercury, Sulfur Dioxide, Lead, and even forms of fly-ash, along with those synthetic (high volume production) chemicals not
yet under the laboratory scrutiny of the Lautenberg Chemical Safety Act. For those unfamiliar, the Lautenberg Act is as effective as a band-aid in a four car collision.
Next to be addressed is the commercial media networks' claim that mankind has to aggressively
rid the atmosphere of the industrial "carbon footprint." You need to
understand the following facts: The Earth's atmosphere is already at least 99.93%
carbon-free. The atmosphere is made of
[1] 78%
carbon-free Nitrogen, [2] 21% carbon-free Oxygen, [3] 0.93% carbon-free
Argon.
MINUS
The prevailing amount of carbon-free water vapor which ranges from 0.1% to %4.
The same atmosphere additional contains minute amounts of Hydrogen, Helium, Neon, and Xenon, all of which are carbon-free. And of course, 90% of all greenhouse gases (by volume) is the carbon-free water vapor which comprises as much as 4% of the atmosphere in the Tropics, while comprising very low amounts in deserts such as Antarctica and the Sahara.
Do you detect the con game that has been played with
humanity since 2006? 2006 was the year of the first Al Gore movie which
was an insult to the intelligence of anyone even slightly familiar with
Atmospheric Physics ... especially in what was falsely said about Lake
Chad.
At this point, keep in mind that Cirrus Clouds have more infrared
heat retention capacity than does the trace gas co2. Also keep in mind
that it is generally understood that, if the man-made compound, Sulfur
Hexaflouride gets mass marketed, then there will be a dreadful measure of
man-made Global Warming. Sulfur Hexaflouride is a world apart from co2,
in heat retaining capability, because it's so stable. In review, CO2 is fine. Sulfur Hexaflouride is potential grief. Period.
CO2 easily becomes plant food, tree refreshment, and phytoplankton subsistence. Thus, it will not build-up to the point of disaster, any time soon. And 417 ppm is not anywhere near the End of the World. After all, Venus and Mars have co2 levels at 965,000 ppm & 953,000 ppm. Meanwhile, CO2 is in great demand on Planet Earth, because it empowers nature's oxygen-making machines ... and because it is the key to photosynthesis. The co2 levels of Venus & Mars prove that there is no life on those two planets. There's nothing on those planets that consumes co2 and changes it into another molecular structure.


Back to Planet Earth: Now,
2022 was proclaimed to be the hottest, most ice-dissolving
year of them all, by media members who have no experience in atmospheric
physics or meteorology or geology or in working outdoors for decades
... or in being honest. The untrained folk with microphones and computer
keyboards used the word, "unprecedented." They claimed like faithful Nazi Party members who do not allow dissent that never before in the history of mankind have the
weather events of 2022 been seen. Well, for starters, try the Year
1922 .... one hundred years prior. One certainty is that there was
much more Arctic Ice in existence today, in 2022, than there was in
1922. In fact, 1922 actually was the Great Melt-down.
In
addition, the Years 1910 & 1911 were also far worse than 2022, as
is illustrated in a previous post, with photos of 1910 & 1911
newspaper articles included. The Year 1913 brought record heat, in fact, until 1922 broke it.
And then there was the trio of 1934 to 1936, with 1934 having been declared by NASA to have been the worse drought year in 1,000 years. In sequence, the Year 1936 hosted the hottest Summer of the 20th Century --- far worse than anything that the 21st Century thus far had to offer, including the heatwave year of 2012, 2016, and the overly exaggerated 2022.
Observe
the examples below which prove this to be very true about the Years
1922 & 1923, as well as 1923 & 1925. We begin with the 1923 news report that Glacier
National Park was melting at a rapid rate. At the time, the prediction
was that all of the glaciers at Glacier National were going to be
melted-away, by the Year 1948. It was an ongoing false prophecy. The
most recent failed prediction was that the glaciers were going to be
gone by 2020. They are still there.
None
the less, the articles posted below show the severity of heat during
the 1920s. This shows that it is a complete falsehood to claim that
there were no severe heat years until recently. The heat and the forest
fires were far worse in the 1870s, 1890s, 1901, 1910, the 1920s, and
the 1930s. As far as go droughts, the worse ones were in the later part
of the 19th Century in addition to 1934.
And
as far as goes the worst flood year, it would be 1927, for sure. Yet,
in the same 1927, there was also a brutal drought. In as much, on a
planetary globe that is tilted at its axis, one man's drought is another
man's flood.
And
then there is the matter of the worse of winters. That was definitely
the Winter of 1880-1881. There was also the Great Blizzard of 1888.
The 1880s did not have the heat experienced in the 1870s and 1890s.
The Winter of 1928-'29 was brutally cold, too. The winters of the 1960s were physically painful events, as well. I should know. I was there. The 1970s were painfully cold times, too. I was there, too. Thus, climate is cyclical.
Needless
to say, newspaper archives of decades and centuries past contain the
evidence which shows that the recently altered climate graphs and charts
of the U.S. government are outright fraudulent misrepresentations.
The
government has a conflict of interest here, being that members of
governments throughout the world advocate imposing "the carbon tax" upon
humanity. Thus, their "sales pitch" is that there never was weather
like the weather of 2022, when the truth is that many years were far
worse --- and when the truth is also that 2022 was greatly exaggerated.
Yet, 90% of all greenhouse gases, by volume, is Water Vapor. Water
Vapor has no carbon footprint. So, why put a carbon tax on air that is 99.93% carbon-free?
In
review, the atmosphere is 78% carbon-free Nitrogen, 21% carbon-free
Oxygen, and 0.93% carbon-free Argon. This equals a 99.93% carbon-free
atmosphere. Do you sense a scam amongst the Carbon Tax Lobbyists, yet? No? Well, enjoy paying the massive national debt that Nancy Pelosi and Chuck Schumer dumped on you. In fact, even enjoy the day when, suddenly, the American dollar will no longer have value. After all, when you keep printing dollars, you keep devaluing dollars, and you can't get lower than the number ZERO.
So, have fun in all the chaos to ensue, all because you listened to Al Gore, Michael Mann, and Nancy Pelosi, as well as other people who were not fit for leadership posts. There is a difference between being a leader and being in power. Non-leaders in power always abuse their power and pocket large sums of money in the process.
The Year 2022 brought nothing new; not even the
predictable con artist media personalities who told the citizenry yet
another science fiction horror story, all the while neglecting to tell
the public that the Year 2022 also had record cold temperatures within
it, along with a restored Great Barrier Reef. Huge news. But not for
the con artists.
All of this coincides with the presidency
of known liar, Joe Biden. For the record, his lies, as much as his
public hair-sniffing, are on video ... and on film. This was especially
the case during the 1988 presidential campaign, when Joe Biden became
Liar Extraordinaire. Only later did he become Hair-Sniffer
Extraordinaire.
All of this also coincides with the $174 million
worth of grant dollars given to a multiplicity of media outlets,
compliments of none other than Mr. Microbe ... Bill Gates. My! What a
coincidence! BTW, take a look at:
Bill Gates rigging the media at a discount price of 174 million "grant" dollars.
All
in all, in 1922 and 1923, it was reported that the Arctic was melting
severely. Well, Arctic Ice replenished in the 1960s and 1970s,
indicating that climate IS cyclical, and not at all driven by the trace
gas co2 ... or by methane which only exists at 2 parts per million in
the atmosphere ... or by nitrous oxide (N2O) which exists at ONE part
per THREE million.
Keep in mind that this is the report of 1922 ... NOT 2022. There is much more ice on Earth today than there was in 1922, when the atmospheric co2 level was no more than 304 parts per million. Today, co2 is at 417 parts per million.
When I polled people, asking them what percentage of the
atmosphere is CO2, the common response was, "I would say 30%." They
were only off by 29.95%. Only one person gave me an answer that was
almost correct, concerning the co2 level, and that was while I was in
Chicago. One person east of Ohio, incidentally, gave the answer of
70%. Yet, he was a very rational person who assumed that the level had
to be ridiculously high or else Al Gore wouldn't have been obsessively
harping about it for decades.
None the less, the visual aid
which helps the co2 count be understood is the one which compares the
various atmospheric molecules to a Rose Bowl audience. In as much, if
the atmosphere's constituents were Rose Bowl fans, 78,000 of them would
be Nitrogens. 21,000 of them would be Oxygens. 930 of them would be
Argons, and only 42 of them would be CO2.
As far as goes
methane, there would be one methane for every FIVE Rose Bowl stadiums.
Methane is only 2 parts per million in Planet Earth's Troposphere.
That's it. N2O is only one part per THREE million, in the same
Troposphere. That amounts to one nitrous oxide molecule for every 30
Rose Bowl stadiums.
This shows the failure of the commercial
media and the American public school system, as well as Al Gore, Bill
Nye, Michael Mann, and Bill Gates. Then again, it shows the success of
those people spreading misinformative and disinformative propaganda,
thereby deceiving anyone too lazy to read & check things for
himself/herself. Add to the contributors of disinformation certain
personnel of the United Nations who are simply trying to con American
government officials out of billions of U.S. taxpayer dollars.
In addition, when Obama's EPA chief was asked the percentage of
atmospheric co2 during a congressional hearing, she did not know the
answer. This is beyond pathetic.
 |
© Patrick Anthony Pontillo, taken during the coldest winter in 40 yrs.
|
The journalists' ironic contradiction
A
great irony in co2 climate reports is that one type of journalist
describes co2 as causing humid and sweltering days, while another type
of journalist describes co2 as causing hot, brittle dryness. So, which
one is it, journalists? In can't be both. In fact, there are weather
disasters which require low pressure systems, and there are weather
disasters which require high pressure systems. So, which one does co2
cause? It can't be both. As you can see, when it comes to scientific
details, journalists are not on the same page with each other.
Moreover,
in 1922, there were official reports that amounted to far less Arctic
ice in 1922 than in 2022. After all, in the middle of September 2022,
when the Arctic Summer came to a close, there was still 1.8 MILLION
square miles of ice remaining in the Arctic Ocean. In 1922, there was a
scarce amount of ice up to the 81st parallel.
As a reference
point or two, the North Pole is the 90th Parallel, while Helsinki and
Oslo are near the 60th parallel, with Moscow being near the 56th
Parallel. Stockholm is near 60 degrees parallel, also. Thus, 1922 was
the Great Meltdown, when co2 was only at 304 ppm (parts per million).
Therefore, co2 did NOT cause the Meltdown of 1921, 1922, & 1923.
Nor did it cause the heatwaves of 1871, 1878, 1896, 1901, 1910, etc.
Therefore, it didn't cause the heatwaves of 2012 or 2022, either. Water Vapor is the Greenhouse Gas that rules Planet Earth, and it has ZERO carbon-footprint. After all, Planet Earth IS the Water Planet, so do the math on this one.

The
truth is that, if you want to go green, then increase the level of
atmospheric CO2. It's quite simple. It simply doesn't make as much
money as does claiming that CO2 is going to wipe out humanity, unless
you give hundreds of millions of dollars to Al Gore. Meanwhile,
hundreds of billions of United States taxpayer dollars were appropriated
to those activists and "scientists" who found favor with Al Gore,
compliments of congressional "leaders" who dwell in mansions and who do
all so exceptionally well in their stock investments. What a
coincidence that the most successful investors are U.S. congressional
members!!! But of course, no insider trading is permitted. Or is it?