|
| © Patrick Anthony Pontillo |
Lesson #1: No temperature rise in the middle of Troposphere means no global warming.
From 1999 to 2016, there was NO temperature increase in the middle of Earth's Troposphere.
Greenhouse Gases in Review
~4,000 Year Pattern: The Earth's climate has changed naturally, every 124 to 600 years, from Warm Periods to "mini" ice age type scenarios, such as the Justinian Antique Mini-Ice-Age, from 536 C.E. to 660 A.D ... and the Mini Ice Age which went from 1284 (the Wolfe Minimum) to 1840 (during the rise of warmth-needing Phytophthora Infestan and the Potato Famine in the northern parts Europe.)
One of the most effective triggers of climate change, on occasion, has been ===> volcanoes.
-Wake-up Call: WATER VAPOR comprises 90% of all greenhouse gases, by volume.
-It's a Trace Gas: CO2 only comprises 21/50,000th of the atmosphere. That's 0.042%.
More specifically, CO2 exists at 1 part per 2,403. Nitrogen exists at 1 part per 1.28.
-A Lesser Trace Gas: Atmospheric Methane was only 1.886 ppm. It's now 1.909 ppm.
-Even Less: The N2O about which the UN ranted exists at 1 part per THREE million. That 1/3 part per million.
-The Ordovician Ice Age: occurred when CO2 levels were 9+ times higher than today.
-Reality Check: Cirrus Clouds retain more atmospheric infrared light than does CO2.
-Infrared: CO2 has three vibration modes. In one mode, CO2 can't capture IR heat/light.
-CO2 Watts: The radiative forcing of CO2 is 2.17 watts per meter squared; a night light.
-No CO2 means no life on Earth: When CO2 is below 150 ppm, photosynthesis halts.
Conclusion: CO2 is Plant Fertilizer . . . not incendiary Jet Fuel.
Glacial Melt: 1892: CO2 was only 295 ppm. Yet, the Tête Rousse Glacier collapsed, killing 200.
The Jakobshavn Glacier (Greenland) gained ice from 2016 to 2019, while co2 was 402-410 ppm.
Lake Mead: The population of Nevada & Arizona increased 1,700% since Lake Mead's debut. The demand for water increased accordingly.
In addition, 1.5 million acre-feet per annum goes from the Colorado River to the Morelos Dam, in Mexico. Yet, the media wonders what happened to all the water in the West's man-made lakes. BTW, an acre-foot is the amount of water needed to fill an acre basin, 12 inches. It's 43,560 cubic feet.
US Forest Fires: 1926 to 1943: 650 million acres burned. 2004 to 2021: 133 million burned.
40+ million acres burned yearly, from 1928-1934. Since 1953, burn acreage never above 10.1. And remember, so much acreage burned in the 1920s & 1930s so tremendously, because there was no one there, in pivotal places, to put the fires out.
Therefore, to claim that not much burned in 1920s & 1930s is to prove yourself to be completely out of touch with history and demographics ... and reality. The West was sparsely populated during that time span.
Roman Warm Period: Scientific Reports marked it as warmer than today by 2 degrees Celsius.
Methyl Chloride in Antarctic ice cores were highest in 900 - 1300; the Medieval Warm Period.
Monsoons: A monsoon is an extensively sized sea breeze. Wintertime means Dry Monsoons.
In the Summer of 2022, Arizona & Nevada had record high rain during their Monsoon season.
Surface Ocean PH: In 1751, PH was an alkaline 8.25. 1996: PH was 8.14. 2022: PH is 8.07.
There are fish that thrive in moderately acidic pH waters, such as discus, tetras, and angelfish.
The Al Gore CO2 Climate Theory: The belief that the steering wheel moves the driver's hands.
Air temperature first rises, then evaporation slightly increases, causing added co2 in the sky. The tremendously high amount of NEW coal burning plants in China is another cause of added co2 in the sky. Thus, America could vanish, yet the co2 count in the atmosphere will continue its pronounce rise. None the less, other pollutants in sky coming from unfiltered coal plants is what matters. NASA already proved that the Earth has been "greening," while the co2 count in the sky rose.
The phrase"fossil fuels" is the most illogical, buffoonish, & asinine phrase thus far used to replace, "combustible fuels." Think: Liquid & Gaseous Fuels NEVER fossilize. If they did, they would be crystallized calcite. When you put fuel into a fuel tank, it combusts. It doesn't fossilize. The "going-green" people have no common sense.
Climate History
-Panic-free climate.gov: "Sea level has risen 8 - 9 inches (21 - 24 cm) since 1880."
-U.S. satellites: From 1992 - 2017, the aggregate sea level rise was only 2.8 inches.
-Hottest Year on Record: The hottest year on record in U.S. history was *1934*.
-The worst drought in 1,000 years: NASA announced that it occurred in *1934*.
-The largest amount of Antarctic sea ice extent: It occurred in the Year *2014*.
-Cold Start: Record low N. American cold-wave continued into January *2018*.
-Coldest Finish: The coldest cloud mass recorded was -168F on Dec 29, *2018*.
-Encore: Worse N. Amer. cold-wave (4,700 cancelled flights in 2 days) in *2019*.
-Record Cold Numbers: 4,000+ record lows in U.S. from Oct 24 to Nov 1, *2019*.
-Depending on locale: Coldest February since 1936 & 1989 was February *2021*.
-The Antarctic Winter: The coldest Winter in Antarctica's history was in *2021*.
Responding to Global Warmists' predictions that there will be mostly failed crops:
-Agro Exports: The record high year for U.S. Agricultural Exports was in *2021*.
-Record American Harvest: America's record high soy crop harvest was in *2021*.
-Record harvest: Australian farmers harvested their largest wheat crop in *2021*.
-Record Rice: India's all-time record high rice production of 121 mt was in *2021*.
-Record high sugar cane crop: For the State of Louisiana, it's #1 year was *2021.*
-Greenland Snow: Greenland's record 12 GIGATON snow gain was in May *2021*.
-Cloud Altitude: Temp minus dew point ... divided by 4.4 ... times 1,000 = Cloud base.
As a general rule, the higher the cloud mass the more infrared heat it can retain.
Dew
refers to the appearance of liquid water as temps decrease. Dew appears when the air is saturated with water vapor. Yet, water vapor is 90% of all
greenhouse gases. Thus, it's quantity on Earth is limited, because of the
existence of the dew point. It's can't rise to the point of over-heating the Earth.
Water Vapor cannot perform any type of
"runaway feedback" that leads to the temps of Venus. The other
greenhouse gases, combined, are minor when compared to water vapor. Yet, there is more to the heating equation, namely Albedo. Albedo is the amount of sunlight reflected back into outer-space, as soon as it makes contact with something reflexive on Planet Earth.
The color white has a high albedo. Sunlight reflecting off of a mirror has 100% albedo. Moreover, from the Parallel Latitude, 40 degrees, all the way to the Pole, more heat constantly leaves Planet Earth's atmosphere than enters into it. This is the case in the northern and southern hemispheres.
The least albedo on Earth occurs with black asphalt. Asphalt is a great retainer of infrared heat. Plus, Cirrus Clouds capture infrared heat far more effectively than does co2.
 |
| Western Massachusetts in the Summer of 2024. No Climate Crisis hear, folks. |
-The photographs directly above & below illustrate the carbon footprint of CO2.
 |
Water Vapor has ZERO carbon footprint, and it's 90% of all greenhouse gases, by volume.
|
Evidentiary support needed to prove false the many doomsday climate assertions:
{1} A century & a half of newspaper & magazine articles. {2} Old government records (which have NOT been "homogenized" with numerical alterations). {3} Present-day observable sea levels in comparison to unaltered
past records of the same. {4} The present-day state of the Antarctic
Ross Shelf, as video-recorded by New Zealand scientists, in 2017. {5} a
private pilot training program's Weather Theory textbook {6} the failed doomsday predictions of none other than ... drum roll please
... Jim Hansen ... who is not to be confused with the Jim Henson who
founded the Muppets. {7} Add Al Gore's failed predictions, too.
Preliminary Note:
Climate misrepresentations are spread by /|\certain scientists,
/|\media networks that subsist mostly on corporate advertising dollars,
and /|\certain congressional members, in quest of {1} more NGO grant
money, or {2} more Congressional funding, or {3} the enactment of the
very fraudulent carbon tax, or {4} grass roots funding popularity, or
{5} TV ratings, being that fear sells.
The
first task of the climate racketeer, in order to obtain large amounts
of money, was to that the climate racketeer needed to become the primary influence of people, without allowing
debate or counterpoint. Thus, the first goal of the Climate Racketeer was to become a Climate Nazi. No free speech.
Next came attempts to make society feel a sense of urgency, followed by people demanding governments to fund the scientists ... or impose the carbon tax ... or something else manipulative & unconscionable.
Preliminary Summary: During the Cambrian Explosion, when sea-life & shell-life came into being and proliferated throughout the oceans of the Earth, the co2 levels were approximately 16 times HIGHER than today.
Yes, it was 16 times higher than at today's 421 ppm. Yet, shell-fish thrived, instead of experiencing dissolving shells. It would take centuries for the present 8.1 PH ocean to decrease to a neutral 7.0 PH. In fact, at the end of the Pre-industrial Era, the average ocean PH was 8.2.
Moreover, due to the oceans' currents, ocean PH is NOT uniform. In addition, correctly measuring the PH in specific ocean areas can be difficult. Firstly, the apparatus usually used is a "standard laboratory liquid junction glass electrode." This tool has a membrane, and ocean particles attaching themselves to the membrane can become charged, negating the reading thereof. There's more. There is so much more to include, in this subject.
At this point, it's a reminder to state that certain government websites also present the ocean PH issue as another form of the end-of-the-world. After all, for a politician to succeed during re-election time, he/she must make you think that the world will come to an end, if you don't vote for him/her.
The Oceans' PH level topic is covered here: The Oceans' Average PH Level
The London July 19, 2022 False Light Reports (pun intended)
The
fraudulent, very false light reporting of the press, concerning the one
July day when London was reported as having gone over 100F, is easy to
prove a fraud via the official London Fire Brigade statistics dating
back to 1966. The fraud is NOT in the one-day temperature reading at Carlwood, Surrey. The fraud is in the claim that fires were on the increase in the Greater London area, due to rising co2 levels. The truth is that, by 2014, the number of Greater London fires fell almost 50% of the numbers that existed in 1966, when fire record keeping began. Now, there was this hysteric claim that the month of July set off a number of fire so large that the fire brigade was being overwhelmed. Here's the statistical truth:
According
to the London Fire Brigade's records department, at its very lowest
amount of fires (2019), London averaged 49 FIRES A DAY, everyday in
2019. During the year of the Greater London area's most fires, the daily average was 82 fires per day.
Now, concerning July 19, 2022, on social media reports I found a
grand total of NINE fires reported in the Greater London area on that
day. That constitutes 40 less fires than the average day. Well, recourse to the LFB records dept is a must, sometime in the future.
Let's review a bit more stats, concerning London's fire history, so that you will understand the widespread lying that occurred in response to that one Carlwood Surrey day when temps were PROVISIONALLY reported at 39.1C (102.4F):
~
the LEAST amount of fires that Greater London had in a year's time was
17,993, in 2019. In that year, the London Fire Brigade also reported
that London fires have been reduced by 34%. It furthermore stated that
"fires in the home" decreased by 23% since 2010.
In
fact, a statistical chart provided by the LFB shows that fires
decreased steadily since 2001. Moreover, the 2001 number was equal to
late 1980s' number and mid-1990s, per year. That same one report also stated that the
Greater London Fires of 2010 numbered 27,462 (9,500 more than in 2019).
OCTOBER 2022 UPDATE
As an update, it turns out that the Year 2021 was the one with the least number of fires, since record keeping began in 1966. 14,929 is the number. The previous low year was 2020, with 17,409.
As far as goes 2022, up to October 10, there have been 14,633, thus far. This shows that, as the atmospheric CO2 level steadily increased, London area fires steadily DECREASED. This proves that the commercial media lied to the public about co2 causing London to burn. Its personnel should be fired and replaced with honest journalists.
See: London Fire Brigade Incident records
The chart above is the smoking gun that proves media dishonesty. (For those in the American public school system, the pun is in the word, "smoking," as in the proven false claim that rising co2 levels set London on fire and caused smoke to rise, in 2022.") For others, take note that, from 1968 to 2003, there were OVER 40,000 fires per year in the Greater London Area.
From that point onward, the yearly number of fires decreased to half or so. Meanwhile co2 levels were rising, as London fires were DECREASING. Conclusion: The rise in co2 does NOT trigger more London Area fires. It only triggers more journalists' lies.
Since record keeping began in 1966, the average fire per day in London
was gone from 82 a day to 49 a day. Case closed. A lot of news
reporters need to be fired, for lying about the cause of the fires ... pun NOT intended.
Back to the Dishonest July 19th Game
Of
course, it was reported that July 19, 2022 was the height of an ongoing
heat wave that resulted in 103F heat and burning houses. The
temperature was reported as the hottest England ever had experienced.
Well, it was a matter of one PROVISIONAL temperature report from
Carlwood, Surrey, England, at 39.1C (aka 102.38F) Carlwood and London
get the same weather, incidentally.
Anyway,
the day prior was a day reported as 99F (aka 37.2C), and the day prior
to that was an 86F day which is non-spectacular for America and a lot of
other places on Earth.
Incidentally,
the 99F day was amended to a lower temperature (94F in one chart and
96F in a different chart.) None the less, official protocol is that, in
order for a time span to be declared a heat-wave, the heat must
continue consecutively for five days.
The 39.1C (102.4F) in
Carlwood, Surrey, England was "amended" (officially revised) within
11 days, to the downward temperature of 99F (37.2C), by one reputable
weather website. And it was only reduced to 102F by a different
reputable weather site. So, which is the true amended temperature?
 |
By the way, photosynthesis comes in many colors. This is a tulip fueled by CO2.
|
Concerning
the media ratings hunt, Project Veritas has a visual & audio
recording of one-time CNN technical director, Charlie Chester. In it,
he says that CNN's next campaign will be "Global Warming Awareness,"
without him having made any mention of the scientifically certified
"Global Warming Pause of 1999 - 2016," & without him having
mentioned the 1940-1975 temperature decline. This means that CNN has
predetermined what the breaking news is going to be months before
breaking news occurs.
27 Gigaton Gain in Five Days. 12 Gigaton Gain in One Day.
Neither
are you to expect to hear CNN mention the 27 gigaton snow gain in
Greenland, from April 14-18, 2020, as well as similar Greenland snow
gains. Similar gains include the May 26, 2021 snow gain of 12 gigatons --- all in one day. Concerning that one day:
Observe
the blue graph line's vertical end. It's a line of blue that shoots
straight upward. The chart attached to the blue signifies the "Surface Mass Balance"
of Greenland, from Sept 2020 to August 2021. Incidentally, the gully
in the graph, where no snow gain occurred, is called Summertime. The
seasons are caused by the tilt (the obliquity) of the Earth; and not by
co2.
Of course, do NOT expect CNN to detail Antarctica's Winter of 2021.
It was the coldest Winter in its known history, and the timing of that
coldest winter was a wooden stake directed straight into the heart of
Global Warming Hysteria.
Also forgot about hearing the details of the 2021 record high soy crop harvest in America and the 2021 record
high wheat harvest of Australian farmers. Also add to the CNN Ignore
List the record high agricultural exports from the United States which
occurred in the same year of 2021.
In like fashion, assume that there will be no attention given to the 21% gain in the 2021 American cotton crop, as well as America's professional success in its 2021 corn crop. Add to the no-attention list India's record high rice production of approx 121 million metric tonnes which also occurred in the Year 2021.
These
things are important to hide from you, because the recent harvest
successes prove Al Gore completely wrong in his assertion that an
elevated level of co2 will result in a disastrous fate for agriculture
on Planet Earth. Only crop failures will be reported by CNN; not crop
triumphs.
See: Greenland gained 27 gigatons of snow in five days, in 2020
Perhaps you noticed that CNN ratcheted-up the climate doomsday scenario as far back as August 2021, after the MASSIVE Greenland snow accumulation of May & June 2021. It's explained further inside these written (as opposed to spoken) discourses.
East Australia Joined in the Record Cold Club
For
now, take note that the Australian East Coast, as recently as 2022, was
undergoing record lengths in cold phases, while CNN was hyping-up the
one July day, and one July day only, when one Carlwood Surrey
thermometer read 102.38F (39.1C). Canada had record cold in 2021 and this year (2022), too. But, don't expect that to be mentioned by CNN very often, if ever at all.
See: 2022 Australian record cold
See also: Australian regions coldest in 100 & 33 yrs.
And: Aussie "record long" cold spell during sole London 100+F day
Newsflash: There was Global Cooling and Global Warming occurring on a Planet Earth during the same general time span, in 2022. On a round planet, one man's flood is another man's drought, and one man's heatwave is another man's cold spell.
In as much, while CNN was screaming, "Global Warming, Global Warming," the
Northeast of the United States experienced record breaking cold in the
Winter of 2021/2022. CNN will remain steadfast in the deliberate
infliction of emotional distress upon school children with horror story
after horror story of the life-giving photosynthesis molecule, co2.
See: Record Cold in Northeast America, 2022
See also: Record breaking cold visits the Northeast of America
There
will also be no expected mention of NASA having reported, with
satellite samples, that the Arctic region of Planet Earth has become
greener during the Summer. Nor will there be mention of other geographic sectors of
Planet Earth becoming greener.
A
conclusion nine years prior was that the biosphere in a given Arctic
latitude is now as green as it was 430 miles more south, in 1982. MSN
News actually reported this in 2013. Anyway, there are videos
testifying to the greening of Arctic latitudes; ultimately testifying to
the fact that more co2 is NOT doom. More co2 simply means more
photosynthesis on Planet Earth.
Lookie see: NASA affirms that the Arctic is now greener.
 |
If you want to go green, you must increase the co2 level.
|
At this point, sea levels should be brought into focus. Now,
concerning the reported sea level rise of 2.8 inches in 25 years, it
was assessed as such via the Topex-Poseidon Satellite and the Jason
series (1, 2, and 3). No polar bear is drowning in that 2.8 inches.
There
was also the report that the average sea level rise since 1880 (to the
Year 2020) was 8 to
9 inches. Doomsayers claim it's ten inches ... in 142 years of time.
Do you see how unremarkable and non-apocalyptic these numbers are?
Plus, 1880 was shortly after the Mini Ice Age. Some thawing was to be expected. The present-day surmise is that the modern-day sea level elevation occurs at a rate of +3.6 mm every year. At this point, take two pennies, stack them, and look at their sides ... look at their thickness. The two pennies are 3.5 mm in thickness. Is that anywhere near end-of-the-world quality sea level rise?
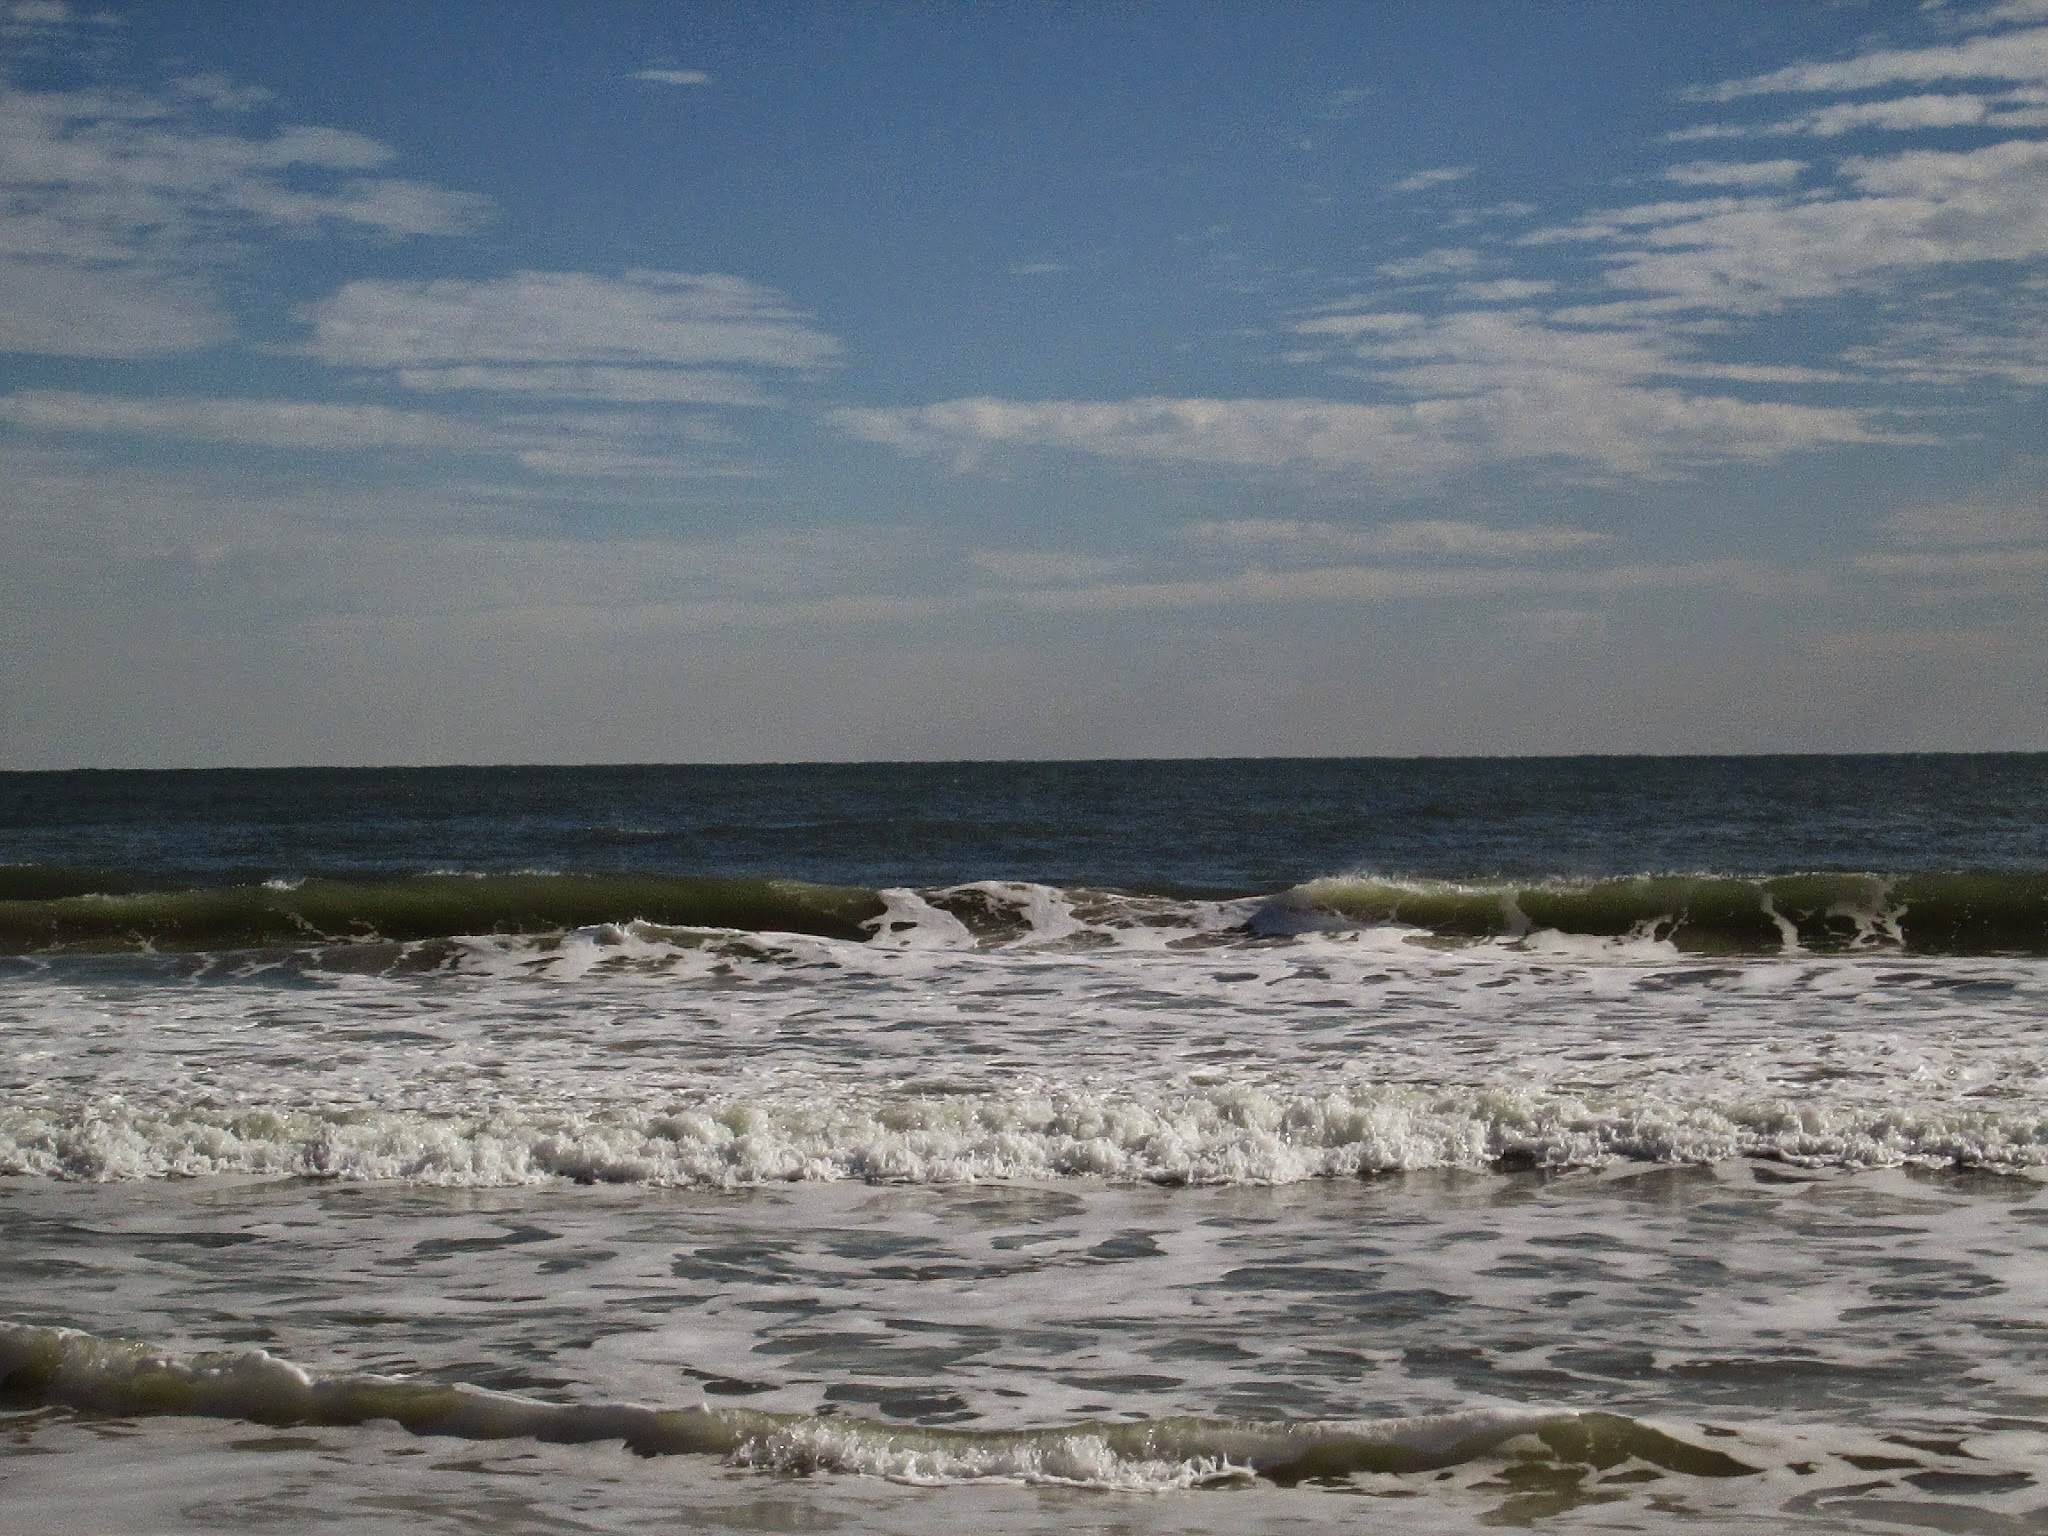
 |
Catastrophic Sea Level Rise? Newsflash: The Piers aren't underwater.
|
|
Let's
also address the report that, during the 20 twenty year period of April 2002 to June 2021, Greenland lost approximately 4,471
gigatons of snow/ice. Sounds like a devastatingly
high amount which can put the eastern coastlines underwater, correct? Well, it corresponds to a sea level increase of .
. . no more than 1.2 centimeters. That's one point two centimeters. That's also .47 inches. That's half an inch of sea rise ... in 20 years' time. Excuse me, but where is the end-of-the-world doom in all of this?
Let's go through the numbers, to show how minuscule 4,471 gigatons are, in relation to the oceans of Planet Earth.
Greenland is three times the size of Texas. It's one and a quarter times the size of Alaska --- and eight times larger than Colorado. Massive allotments of ice are there. Now, 4,471 gigatons of melted ice were reported as having entered the Atlantic Ocean, in a 20 year period. The news reports acted as if we all were going to drown. At this point, keep in mind that ALL oceans are connected to each other. No walls separate them.
Firstly, a gigaton is a billion tonnes. It's concisely 2,204,622,621,848 lbs. 4,471 gigatons = 9,856,867,742,282,408 lbs.
The mass of the Earth's atmosphere is 5.5 MILLION gigatons. That's 5,500,000 gigatons times 2,204,622,621,848 lbs = 12,125,424,420,200,000,000 lbs.
At present, we're speaking of ice melt in Greenland. So, we need to calculate in terms of gallons of water. A gallon is 8.333 American pounds (lbs.) The 4,471 gigatons of melted Greenland ice translates into 9,856,867,742,282,408 divided by 8.333 = 1,182,871,443,931,646 quadrillon gallons of water.
Now, the Earth's oceans hold circa 352 quintillon gallons of water (add 18 zeros).
Gallons of water in all oceans: 352,000,000,000,000,000,000
minus 4,471 gigatons melted Greenland snow 1,182,871,443,931,646 =
351,998,817,128,557,068,354 gallons
In adding the melted 4,471 gigatons to existing ocean waters, one yields 352,001,182,871,443,931,646 gallons
Now for a percentage: The percentage of the 1.182 quadrillon gallons of Greenland water, in comparison to the Earth's 352 quintillon gallon oceans = 0.000335%
Compared to the connected oceans of the Earth, 4,471 gigatons coming off the Greenland ice sheet --- in a 20 year period --- is insignificantly tiny. It's an insult to the common citizen's intelligence, when the common citizen does basic mathematics on the issue. The ice melt quantity could not yield any sea level elevation more than an equally insignificant 1.2 centimeters (aka .47 inches --- aka a half inch), in 20 years time.
And this is supposed to be the end of the world. It's con artistry that is easy to uncover as such. "They" think that you're stupid and easy to intimidate. It's the ongoing theft of the American taxpayer.
Reference: 1.2 cm sea rise in 20 yrs of Greenland ice melt
Record High Sea Level in 2020 ... a rise of mere inches
The National Centers for Environmental Information, a subsidiary of NOAA, reported the following:
"In 2020, global sea level set a new record high---3.6 inches (91.3 millimeters) above 1993 levels, according to NOAA."
That's all? That is supposed to be Doomsday? Well, don't go high-diving into 3.6 inches of water.
The lesson here is that, when a government claims to have broken a climate record or an ocean record, the numbers involved are petty and insignificant. A 3.6 inch sea level rise is not the end of the world. Perceive the pettiness under the guise of earth-shattering, record breaking, we're-all-gonna-die, climate change news.
Of course, the response from the Global Warmists is that the fresh Greenland water will lesson the salinity of the Atlantic Ocean and cause an Ice Age in Western Europe.
Well, the facts are that Spain (the land of some of my people), Sicily, mainland Italy (also a land of some of my people), and Greece (the land of some of my other people) reached temperatures in the 100F and even 110F department as recently as 2022, or even 2021, 2020, etc. It's the Mediterranean. That's what it does in the Summer, there. The 90s are common for parts of Spain, Italy, Greece, etc. So, where is this new Mini Ice Age caused by CO2's wanton melting off the Greenland ice sheet into the Atlantic Ocean?
BTW, how can co2 melt Greenland's ice sheet when there is constant albedo deflection/reflection/refraction occurring at the massive ice sheet there? For those in the American public school system, albedo is the "angle of deflection" when UV rays enter Earth's atmosphere, hit the color white, and literally jet back into space at the speed of light. All in all, where there happens to be no infrared light, there happens to be no heating power for CO2. Even at that, CO2 action only happens to occur at 3.7 watts per meter squared, anyway.
CO2 is plant food ... not jet fuel. The greenhouse gas which rules the world is Water Vapor. In fact, CO2 is to Water Vapor what a pinch hitter is to the lead-off hitter of a baseball team.
The climate hysteria falsehoods that were spread are sleight-of-hand distortions more than they are outright lies, with one exception. The exception was admitted to have been a common enough practice, according to the 2009 Climategate Emails. The exception is that record high temperatures were reported in Africa where there were NO WEATHER MONITORING STATIONS. Those officially stated temperatures have no empirical evidence, and therefore no foundation.
Mostly, however, the fraudulent misrepresentations were/are hyped-up exaggerations, always prodding those unfamiliar with basic atmospheric science to believe that the end is near. This translates into the uninformed and the misinformed members of humanity believing that they have to submit to Draconian measures, even to the point of killing off a painfully significant percentage of the human population. This is called Eugenics. Eugenics includes sterilization, abortion, & "euthanasia."
The
other technique in corporate media dishonesty is to omit reports about record cold and the replenishing of glaciers wherever ice re-accumulation
is occurring. Only the ice loss gets reported, as if it were permanent loss, and as if we're all going to die from it. This is de facto censorship. This is the act of hiding the truth.
In a free society, there is Point/Counterpoint, and a second round of debate. Today, there is only censorship by high tech tyrants and the now-dictatorial corporate advertisement media. None the less, newspaper archives of decades past can expose false declarative statements spread by Climate Doomsday Racketeers.
For example, the Gore CO2 Doctrine is easily refuted by the 1970s newspaper & magazine articles that addressed the long-experienced cooling trend of the 20th Century. The New York Times article below is one of many pieces of archival evidence.
According to Al Gore and company, there should have been temperature increases during and after WWII, due to the tremendous amount of industrial manufacturing that took place at that time. Ironically, the opposite happened. The world entered into a 40 year cooling phase while the war was still in progress. An example is the bitter cold endured during the Battle of the Bulge, aka the Siege of Bastogne.
 |
Above: American B-24 crew stationed at an air base in East Anglia England.
|
There were brutally cold temperatures during the Korean war, also; 1950 to 1953. American industrialization continued, none the less. Yet, the temperature decline held its course for 35 or so years.
See: The depth of cold in the Korean War
A peace time example of the temperature decline was the Big Freeze of 1962. Having begun in December 22, it did not subside until March of 1963. It was the coldest winter in Central England since 1740, and 1740 was within the depths of the Mini Ice Age.
By the time 1978 arrived, the climate was already recognized as having gone through a "thirty year cooling trend," despite the industrialized uptick in co2 levels. This dispels the Gore Doctrine. This, alone, proves non-scientist Al Gore to be completely wrong.
Gore is as wrong at this atmospheric co2 assertion as he was when he went on the late night NBC show hosted by the extremely intelligent Conan O'Brien. Gore claimed that the center of the Earth is millions of degrees. Well, Brain Cells Gore didn't realize that the Earth would have vaporized long ago, if its core were millions of degrees. The center of the Earth is 9,800F to 10,800F. That's hot enough.
Yet another scientific finding that disproves Gore's doctrine
The 2017 crystallization of the bottom of the massive Ross Ice Shelf in Antarctica dispelled it too, as did the regrowing of the Jakobshavn Glacier, along with the fact that the glaciers of Glacier National Park did not melt into non-existence, by the predicted year of 2020.
 |
The Ultimate Reality Check for co2 doomsayers. While co2 rose, Earth underwent a cooling trend.
|
Needless to say, the goal in all the climate exaggerations and in the censorship of Climate Whistleblowers is this: To keep all of mankind convinced that a rise in the co2 level will automatically result in a rise in temperature and a rise in "weather disasters;" --- and to simultaneously have mankind believe that all of the weather disasters are caused by industrial factories and the operating of combustible engines, instead of decadal ocean oscillations and the Sun Spot Cycle (aka the Milankovitch Cycles) .
Even in mentioning coal, the media only mentions its emission of life-giving co2, while omitting from the conversation the true pollutant in coal --- namely, deadly airborne mercury. Coal needs high tech filtration processes --- or coal needs a clever natural filtration process that only the common sensed can conjure.
The great outrage of obsessing over man-made co2, in a Troposphere that contains less than one half of one percent of co2, is that the true environmental enemies of mankind are ignored and neglected for the most part. Today's great environmental enemy is ===>
. . . the irresponsible distribution & use of synthetic chemicals, as well as the dissemination of any petrochemical that goes unfiltered or unregulated. Add to this the use of toxic construction material and furniture-making material.
~~~
A review of the contradictions of the corporate advertising media, in its collective climate doom predictions, includes the following:
{1} CO2 levels having been 9+ times higher during the Ordovician Ice Age than today. {2} The graph presented by Al Gore at the start of his first movie having been narrated backwards, in that ice-cores showed that a rise in global temperatures came first, followed by relatively a small rise in the co2 level. Plus ===>
{3} The atmospheric physics rule of pressure gradient forcing which means that warm periods do not have hurricanes and other low pressure storms in high numbers. {4} The Year 2021 having been a year of record high crop harvesting and record high agricultural exportation for India, Australia, and the United States, thereby proving wrong Al Gore's predictions of crop disaster in any heightened co2 environment.
In fact, growers purposely add co2 to their greenhouse air. Those growers proved that, if you want to go green, you must increase the co2.
Another great irony in co2 is that, in its liquid states, co2 is commercially used as ... a refrigerant.
 |
Zero major hurricanes made landfall in the U.S. between Wilma (2005) and Harvey (2017)
|
In fact, the great irony about the first Gore movie is this: The year after the movie was released, the U.S. did NOT have a major hurricane making landfall on its shores for 12 consecutive years. The opposite of what Gore predicted in that movie occurred. It's now 18 years later, and there still has NEVER been a Category 6 hurricane. Plus, NO hurricane ever rose to the speed of an EF4 or EF5 (T10+) tornado. Hurricanes did NOT become more intense, in any capacity, as Gore's predicted.
The hurricane record, alone, proved that Gore was and is a lying & thieving charlatan. None of his doomsday predictions ever came true.
Failed doomsday predictions::: 1} The Maldives did NOT go underwater, but instead, became frequented by financially affluent Arabians who are apparently really really happy with the place.
2} The Arctic Ocean has not even come close to an ice-free Summer. The closest to Gore's prediction was 1.32 MILLION square miles of ice remaining intact at the end of the Drought Year of 2012. That's the lowest.
3} The previously mentioned "Category Six Hurricane" prediction & the general intensification of hurricanes prediction. Include the previously mentioned fact that never in known history was there any hurricane equal to an F4, EF4, or an F5, EF5 tornado.
4} Gore predicted that lower Manhattan would go underwater. Everyone in New York, New Jersey, and everywhere else knows that it didn't do so.
~~~
BTW, keep in mind the US Supreme Ct case law authority known as Times vs Sullivan. It is lawful for a private citizen to make known his opinion of a public figure, where there is no malice. Malice involves intentional deceit, and not the surmise of easy-to-proof factual information. In my opinion, Al Gore is an unconscionable con artist who was repeatedly proven wrong in his predictions.
All
in all, the trick has been to render you and all of society in a state of
paralyzing fear, and then rob you. If you were too smart to fall for
their contradictions and false climate history assertions, they would
resort to bullying you with bratty name calling.
If
you didn't get intimidated by the name-calling, the climate racketeers ended
up trying to terrorize your mind by seeking government coercion and the
abuse of governmental power. This included seeking laws that result in the arrest,
prosecution, and imprisonment for climate whistleblowers of influence.
Senator Robert Kennedy Jr already
did this psychological ploy, in mentioning out loud (in front of a camera) that the climate
whistleblowers should get their "cot & three meals" at the
International Criminal Court prison in Scheveningen, Netherlands. Well,
he mentioned "the Hague." But, close enough.
 |
Above: The true carbon footprint left behind by co2. CO2 is the "going-green" molecule.
|
Now, there was the relatively recent change of data numbers of past charts, tables, and grafts related to climate and weather. They are now the amended charts & graphs, done in the name of "homogenization." Thus, the record heat that was reported in hundreds of newspapers in the 1930s is now recorded by NOAA as not worth our attention. And even though research scholars proved, via proxy evidence, that 1934 was the worst drought in one thousand years, it will no longer indicate this on certain adjusted government graphs of recent.
The De Facto Original Climate Record
Keep in mind that the newspapers of old (as in the weather disaster Years 1871, 1878, 1911, 1921, 1922, 1934, 1936, etc) additionally reported on the human pain experienced, as well as the heat deaths, the fire deaths, the crop losses, and the mass exodus from cities during heat waves; not just the temperature numbers. Thus, the newspapers are the original climate record.
This means that, if today's amended numbers in the charts, tables, and graphs of the National Oceanic & Atmospheric Administration fail to reflect the newspaper reports of the actual temperatures, the pain, and the loss reported at the time of the actual weather disasters, then you have yourself a case of massive fraud, with the motive being the predictable ploy for Congressional money, NGO money, publishing prestige, etc.
Let us review a couple of these weather disaster allegations which either qualify as outright frauds or as gross misinterpretations of valid data or erroneous data --- and therefore they constitute artificially created media hype designed to capture higher ratings:
Sample #1 of the endless end-of-the-world climate hysteria being once again disproved is ===>
August 2021: Media giant CNN & US government administrator NOAA reported with full certainty that July of 2021 was the hottest MONTH for the entire planet in our collective lifetime. Now, this would infallibly translate into guaranteed crop failure in major proportions, by September or October of 2021, according to the Al Gore Pretend School of Atmospheric Physics. This would have also guaranteed that there would be no positive record-breaking crop success anywhere in the same year.
Newsflash: The 2021 American, Indian, and Australian harvests were the opposite of the type of harvest that results from disastrous heat. NOAA's Rick Spinrad has a lot of 'splaining to do.
Undeniable Fact #1: The United States Department of Agriculture officially reported that the soybean harvest of 2021 resulted in the United States' all-time record HIGH. The same USDA reported that the corn harvest of 2021 was near the United States' all time record HIGH. In fact, 2021 cotton production was up 21% from 2020. Thus, there was no heat-related weather disaster in the American farmlands, in 2021 ... especially in July.
See: soy at record high, corn near record high, cotton up 21%.
Moreover: In the Year 2021 . . . in the year that was reported to have had the hottest month of July ever, and which would have infallibly resulted in widespread crop disasters . . .
The USDA furthermore reported that the United States of America's "AGRICULTURAL EXPORTS SHATTERED RECORDS IN 2021," "eclipsing the previous record, set in 2014, by 14.6%."
See: U.S. agricultural exports shatter records in 2021.
In re: India's record rice production
See: India's rice exports up 46% in 2021
See also: India's 2021 rice production, 121 million metric tonnes.
In re: Australian Agriculture
See: Australian farmers harvest record wheat crop
Antarctica had its Coldest Winter in Known history in 2021
Yes, the supreme asininity of NOAA's doomsday heat claim of July 2021 consisted in the fact that Antarctica ended up having its coldest Winter in recorded history in 2021. July 2021 was during the coldest Antarctic Winter in history. This negated everything that the NOAA asserted.
The reason why July 2021 was claimed as such by NOAA was this: In May & June of 2021, Greenland underwent winter conditions which was the undoing of the co2 Global Warming theory. Then, in July, Greenland's surface temperature went up significantly. So, the NOAA used the July temperature record to hide the cold temperature record of the preceding months. This is a form of deception.
~~~
We
continue with the sham report (or else the heavily misinterpreted
report) about July 2021. Now, it was reported to have been the hottest
month worldwide, in the lifetimes of everyone alive. Well, observe the
temperature reports of the entire month of July 2021, in the following
sample of international cities. So, where is all this man-made co2
driven temperature anomaly doom?
Ladies & gentlemen, I first present to you Mexico City, a place far south of the hot hot southern states of the United States. Looking at its July temperature record instantly makes you ask, "Where are all the hideously high Summertime doom temperatures, during the hottest July of our lifetime?" During July 2021, a person literally had to wear a light jacket at night, in Mexico City.
Let's now go to the capital city of the African Congo. It's called Kinshasa, and it should have been exceptionally hot in that African town, during the hottest month in human memory. Right? Well, there was nothing to write home about. All July 2021 days there were in the 80s Fahrenheit, except for three days in the low 90s. Two days were at 90F and one day was at 91F. This does NOT constitute the kind of weather disaster you would expect to witness during the hottest month known to living beings.
]In all honesty, the hottest of the hot years were 1931, 1934, and 1936. In fact, the hottest daily temperature ever recorded occurred during 1913. Hottest months should be located within those years.
We now travel to the African capital of Kenya, Nairobi City. It should have been super hot there, during the hottest month in human memory. Right? Not even close. In July 2021, there was NOT a day over 75 degrees Fahrenheit. So, where is all this Kenyan Global Warming doom that Al Gore mentioned in his 2006 movie? It looks like someone was committing pretty intense fraud, in the making of that movie.
Let's take a look at Los Angeles, in July of 2021. LA should be a high temperature place during the hottest month known to all the living. Well, it wasn't. It was average Summertime temperatures. Nothing epic. Nothing apocalyptic. Only one out of 31 days in the low 90s. You could find this kind of weather up north.
We travel further eastward, to the modernized megacity of Mumbai, Maharashtra, India. It's located at the center of the Western Indian coastline, next to the Arabian Sea which, too, is supposed to be undergoing ocean warming at the hands of evil evil man-made co2.
Plus, Mumbai is a Northern Hemispheric city, at the same latitude as is Mexico City. Well, in July 2021 not a single day was over 92 degrees Fahrenheit, and after July 7, 2021, there was not a single day over 89F, in Mumbai. And remember, there are cities, such as New Dehli and Phoenix Arizona, where temperatures are habitually over 100F, two weeks in succession, even with temps going into 111F or 112F for consecutive days at a time. Mumbai is not one of them. July 2021 was a typical month there; not the hottest in memory.
We continue our rotation around the Earth and land in Quito, Ecuador. Now, this is a place where the angle of the sun makes a direct hit. So, the hottest month in the memory of every living human should have been one where Quito was absolutely cooking. Well, there was no heat wave in Quito that month. Throughout that entire month (July 2021) in Ecuador, it was Autumn coat weather.
I can go further, with numerous examples. But, hopefully you get the message. You have been the recipient of distortion and dishonesty, at the hands of dishonest abusers of power.
More Examples of Hyper-exaggeration
Then
comes the sensationalized two-day period in London, this past July. It
was heralded as the arrival of the Apocalypse of Mankind. In July 18 and 19 of
2022, there was a report of a 99F Monday followed by a 103F Tuesday in London. The days immediately surrounding these two days were utterly average.
True Newsflash: The July 19th temperature was recorded as PROVISIONAL, at 39.1C (102.38F). The sole place where this 102.4F temperature was recorded was Charlwood, Surrey, England.
The reputable weather sites marked the Tuesday temperature as being 103F. Eleven days later, there appeared in a couple weather websites an amended temperature. Monday's 99F day was downgraded to 96F. At one reputable weather site the July 19th temperature was downgraded to 99F. At another reputable weather site the July 19 day was posted at 102F. It was only two days of heat. An official heatwave required at least five consecutive days of heat.
Rare Occurrence in London:
The
more the press kept stating that it was {1} London's hottest day since
August 2003, & {2} it's first 100+F degree day since 2006, &
{3} Britain's hottest night since 1990, the more it was confirming that
such temperatures have been extremely rare in Britain and are not part
of any habitual Global Warming pattern.
Evidence of true Global
Warming would consist in a pattern of repeated days over 100F, year
after year. Global Warming is a weather habit. It's a repeatedly
experienced pattern; not a once-in-every 32 year (or a once in every 16 year) event.
Okay
now. Here's London, in July of 2022, where the media was claiming that a
deadly heat wave was hovering throughout its city limits. Now, look at the July 2022 temperature chart (before the revision was made), and show me where the Climate Heat Apocalypse
is.

Then comes a video example on how the typical classroom climate doomsayer lies in the midst of blatant contrary evidence, under the guise of being a "scholar." This literally qualifies as Idiocy 101.
See: Sample of Climate Doomsayers' Ridiculous Misrepresentations
 |
One prediction was that children would no longer see snow. Explain this, then.
|
Before
anything else, take more than a moment looking at the chart below.
It's the statistical average (per decade) of deaths due to natural
disasters. Also keep in mind that "natural disasters" used to be called
Acts of God. But, they are now called man's fault in an Anthropogenic
Climate Crisis that presently has no "data base" statistics that prove
increasing numbers of any kind of an atmospheric crisis.
As
examples which prove that the statistically opposite of climate doom
predictions have occurred, the Blue Marble Album posted proof showing
this to be the case in a number of occasions:
As one example addressed below here, the Blue Marble Album
has posted on it the LFB (London Fire Brigade) statistical chart
showing that there have been far less Greater London Area fires, since
record keeping began in 1966, with a steady downward decline beginning
circa 2003 and continuing in 2021. The least number of fires was
17,993, in 2017. Greater London means county-wide; not merely within
the city perimeters.
As another example addressed below, the US Forest Service provided a chart (that was posted at the Blue Marble Album) which statistically illustrated that there were 5 times more forest fires in decades past than there are today.
On
the positive number side, record high crop harvests, crop production,
and crop exporting has been regularly occurring, especially in 2021.
Links to those official announcements, with occasional official charts,
are have been posted at the Blue Marble Album, too.
In
fact, it was also in 2021 when Antarctica had its coldest winter on
record, and such a thing negated any semblance of Global Warming, as
opposed to localized warming here and there.
All
in all, look at the natural disaster death rate chart, and notice how
intensely the deaths have decreased, thereby showing the U.N. and all of
its Third World propagandists to be utterly dishonest.
The U.N. Writers Need to Study Math & Algebra
The
first algebra-mathematics lesson is this: The American taxpayer of off
whom numerous nations have leeched has no more money to spare. The
United States is over $30 TRILLION in debt. There is no money for the
typical political con artist to tell the U.N. assembly that the world is
going to come to an end tomorrow, if the United States taxpayers don't
shell out all their available money today. You've drained America dry,
and Chinese money has predatory loan strings attached to it. That would
leave you with Russia and its petrol sales profits.
The World is once again coming to an end tomorrow and the tomorrow after the next one.
In
September 2021, as the United States was engaged in record high crop
harvesting and exporting, there was an onslaught of media press releases
about the U.N. declaring that there were 11,000 "weather disasters" in
the past fifty years, due to the rise in co2 (and other greenhouse gases).
The same U.N. declared that there are 4-5 times more weather disasters
today, than there were fifty years ago.
It's time-out time, for a moment, here.
Example
1 is the list of the deadliest Atlantic Ocean hurricanes. The vast
majority of those deadly storms occurred much before the turn of the
Millennium. Only Hurricane Maria was a 21st Century storm. Other years
of the most deadly of storms included 1780, 1900, 1963, 1776, 1928,
1775, 1909. These deadly storms occurred when co2 levels were much
lower than today. Once again, the Al Gore - John Kerry - Michael Mann
co2 causation theory doesn't ride a wave in this statistical department.
This
"table" also indicates that the U.N. authors are quite the liars, in
having claimed first that there are far more deaths today than in days
of old. The actual September 2021 document states the opposite, in
having stated that fatalities decreased due to modern technology.
However, the media, the press, the TV stations, the internet video sites
claim that there are more natural disaster deaths today. That's a big
lie.
 |
Ben Franklin was literally alive during THREE of the most deadly Atlantic hurricanes.
|
of
the contradiction in that U.N. claim: You perhaps looked at the
Climate Discourse which displayed the official US Forest Service chart
which showed that, in the 1920s, '30s, & '40s, forest fires consumed
5 times more acreage than today ... and in the 2010s, the 2000s, the
'90s, the '80s, etc. The numbers comprise 650 MILLION acres burned
between and including 1926 to 1943. Only 133 million acres were burned
between and including 2004 and 2021.
FURTHERMORE,
the statistics & press releases of the London Fire Brigade attest
to the reality that Greater London Fires, by the Year 2014, occurred at
half the frequency than in the '60s, 70s, etc. The chart looks like a
sliding board, in displaying the decrease of Greater London Area fires.
None the less, in its least year, (2017), the Greater London Area had
over 17,000 fires. Every year since 1966, Greater London had at least
935,000 fires. Which one of those fires were counted by the U.N. as
weather disasters? Any fire that occurred on July 19 in England was
declared as such.
The first question: What constitutes a U.N. weather disaster?
If
this sensational U.N. claim is true, it means that there was an average of
one disaster every 40 hours, for 50 consecutive years. This translates
into 4 weather disasters every week for 2,600 consecutive weeks
(50x52=2600).
This
also translates into 18 weather disasters every month, for the past 600
months. Now, where is all the archived newspaper, magazine, and TV
coverage on these events? The phrase, Weather Disaster, is understood to
mean "Front Page News" --- "Once in a lifetime" event ---
"your-life-will-never-be-the-same-again" event, much like war. A
weather disaster is assumed to be a special occurrence which deserves to
be reported & published . . . in the newspaper. So, where is all
the newspaper coverage for 11,000 incidents?
On
the other side of the mathematics tree is the fact that US forest fires
occur in the tens of thousands yearly, and not merely 11,000. So,
which fires get counted as one of the UN's 11,000 "weather disasters?"
As
an example of the numbers, at the turn of the millennium, in the Year
2000, there were 92,500 American wildfires that consumed 7.4 million
acres. In 2005, there were 64,303 wildfires that consumed 8.5 million acres
of American land. In fact, 2010 saw 71,971 US wildfires consuming 3.4
million acres of American land.
All
in all, that's 401,287 America wildfires were counted in only three sample
years. That's a lot more than 11,000. It makes the UN's 11,000 number
not so intimidating.
The
realization is that the attempt to shock Americans into submitting to
the will of the UN, Bill Gates, Michael Mann, Al Gore, and John Kerry is NOT going
to work with all of the non-defined & vague numbers that the UN
keeps shoving in front of humanity's faces. Where are the data sets
that were used by the U.N. for the September 2021 end-of-the-world
proclamation?
Methane & N2O: Insignificantly low atmospheric quantities
The
U.N. harped on the greenhouses Methane (CH4) & Nitrous Oxide (N2O),
as if they were the other foreboding presences in the atmosphere.
Well, Methane has 28 times more power in capturing infrared heat than
does co2, and Nitrous Oxide is reported to have 265 - 298 times more
atmospheric heating capacity than co2. The cancel-out factor is this:
There's not enough N2O or methane in the atmosphere for them to make any
difference in anything.
Here's
the reality check ====> Methane exists in the Troposphere at 1.889
ppm. That's One Point Eight Eight Nine parts per million. Nitrous
Oxide exists at 1/3 part per million (aka one part per three million,
aka 330 parts per billion.) Climate Doomsayers always withhold & even hide decisive facts. That's the sign of deliberate liars acting in tandem.
Africa
Now,
it was the Climategate Emails of 2009 which showed us that temperatures
in certain African regions were made-up. In fact, there were record
high temperatures being recorded about Africa where there were NO
WEATHER MONITORING STATIONS. Are those fake African temperatures
counted among the 11,000 alleged weather disasters of the past 50
years??
It's Brain Cell Usage Time
Do
you remember in 2003, when almost every American believed with assured
certainty that there were Weapons of Mass Destruction in Iraq? Do you
remember reading how solidly the 1930s Germans believed every damning
accusation leveled against the Jews per se? It is now a modern day
flashback to acknowledge that an entire nation of Hitler Believers did
all they could do to do away with every Jew on Earth --- except for the
occasionally defined "noble Jew."
Even
in matters of science, do
you remember reading how "the science" affirmatively assured humanity
that every ulcer was the result of emotional stress, when the truth was
that the Helicobacter Pylori Bacteria causes them?
Do
you remember "the science" proclaiming that brain damage is permanent?
Then came the hippocampus being restored in patients. Also came the
discovery that the brain can be replenished of Brain-Derived
Neurotrophic Factor.
Then there is the matter of the
original assessment of cigarette smoking ladies --- that they only
smoked out of a desire to be a man, instead smoking on account of the
addicting power of nicotine.
All
in all, when foreboding declarations are made, test them for cracks.
In fact, discern the motive of the people making the melodramatic
allegations. A lot of
times, the motive is money, as well as TV networks trying to improve
their ratings. Of course, networks seek to improve their rating for
money purposes.
In
light of the aforementioned thoughts, a reasonable person would
conclude that any or all of the disastrous weather events counted by the
U.N. should not include any event that happened in the midst of MONSOON
SEASON, being that monsoons are naturally occurring events which help
rice crop harvests, and grains planted after Monsoon season.
This
would include landslides that result from decades of erosion, while a
Monsoon is in progress. In fact, any flooding that results from land
grading
projects and the such, must also be excluded in the UN tally sheet.
Well,
were Monsoon season events and poor landscaping work counted among the
"11,000 weather disasters," by the U.N.?
You know, the U.N. has its
ulterior motive, too. The motive is to reach deeper into the United
Stated taxpayers' pockets and pull out as much as possible, even for
Third World Nations. All that the U.N. needs to do is be honest and ask
for charity dollars. It didn't have to create nightmarish hype equal to
Orson Welle's War of the Worlds presentation.
Monsoons
are naturally occurring and regularly occurring. CO2 is NOT a factor
in them. The factors are the tilt of the Earth and cold air entrapping
moisture for an extended period. In fact, the tilt of the Earth is the
sole reason for the four seasons. Well, at the Poles there are only two
seasons.
Tsunamis
must not be counted either, being that earthquakes are not triggered by
any atmospheric gas. They are triggered by tectonic plate motion.
Wintertime
events must be excluded from the tally sheet, too, even though the
Global Warming political wing started to blame record winter weather on Global
Warming. This is only possible when a snowstorm comes nine days or less
after a heat wave. Heat waves up North are usually in June, July, and
August. Snow storms are usually in December, January and February. That's
much longer than nine days. None the less, co2 levels have been claimed
as the instigator of every misfortune by climate racketeers, including record cold.
More People = More Infrastructure = More Financial Loss when the Big Bad Wolf Strikes
Any
disaster is more costly today, because far more people live on Earth
and inhabit areas visited by turbulent weather events, such as the
coastline, regions near ample waterways, & Monsoon regions.
BTW,
proof that there is Climate Change Con Game transpiring is in the
observation that the prices for coastline property are still in the
upper echelon level. If people believed the Al Gore horror story of
rising shorelines, there would have been a mass exodus from all
coastlines.
Today,
those coastal areas that do get visited by occasional weather
turbulence have much more man-made infrastructure on them. There are
now more houses and more buildings for a big bad wolf to blow down.
Thus, the hurricane damage is more costly per hurricanes. HOWEVER,
there still has not been a Category Six hurricane. Hurricane
intensities did NOT increase. In fact, in the 12 year period between
Huricane Wilma (2005) and Hurricane Harvey (2017), ZERO major hurricanes
made landfall on United States shorelines.
The contradiction in the number of weather disaster deaths
Now,
the news reports stated that the UN claimed that 2 million lives were
lost in weather disasters. Yet, the September 2021 UN report stated
that less lives were lost in the modern weather disasters, due to modern
technology. So, which is it? Have more people died or less people,
during weather attacks? You can't have both.
Ironically,
the most deadly disaster was in 1970, specifically in Bangladesh. That
disaster took away 300,000 lives, as did a 1980s drought in Africa.
So, what goes with the numerical contradiction?
 |
"Fear sells," said a one-time CNN employee.
|
Concerning
the 2021 reports coming from the UN, it will suffice to state that 2021
wasn't third hottest year in the history of anything. After all,
Antarctica had its coldest Winter in recorded history, in 2021. Plus,
Greenland had a very cold June, and Greenland also was the place where
12 GIGATONS of snow fell on it in one day; that day being May 26,
2021.
For the true heat years, look at 1911, 1913,
1931, 1934, 1936, and 1871, as well as 1878. And
don't forget to review the Years 1921 & 1922, when it comes to
pronounced arctic ice melt, as was reported by seafaring witnesses.
~ ~ ~
Next
is an example of the scientific findings that the climate doomsayers do
NOT show you. This one concerns Antarctica, and it blows out the window of all the ice melt horror stories that the media has been telling
humanity about Antarctic ice shelves.
The following finding was/is decisive. Conveying this to school-children can relieve the pernicious feeling
of dread that students are forced to endure. The climate doomsayers
want you to be constantly afraid, so that you will give-over your money, your freedom, and your life to them. Thus, they hid (and still hide) a lot of evidence from you. Watch the
video posted below, and you will see that they are one-sided con artists
who deprive you of needed info. It's a National Geographic video, thereby giving the subject prestige.
Let traumatized youth see this: Crystalizing ice seen at bottom of Antarctic ice shelf, instead of melting ice
Many a Public Servant Has Been Public Enemy #1
At this time in history, in the silence of your thoughts, you need to remind yourself
that governments, financial entities, the corporate advertising press, and political factions
have lied to humanity, time after time, again and again. So, why would
they suddenly stop doing this now?
In as much, whenever you are told
hyper-sensational declarative statements, you have to test them for
cracks, instead of being mindlessly acquiescent to the claims made.
Think: Iraqi Weapons of Mass Destruction. In fact, there are lies told
500 years ago that are stilled believed today. That's a topic for a
different discourse, however. None the less:
The
sign of a political con artist is the accumulation of exceptional
wealth in that person's financial portfolio, while he/she promotes a
cause under the guise of being the new enlightenment. Are you aware of
the amount of money that was transferred into the hands of Climate
Doomsayers? One answer is ::: hundreds of billions of US taxpayer dollars. That's a topic for another discourse, due to time &
printing space considerations.
Perhaps you remember hearing someone say, "If they could tax
you for the air you breathe, they would do it." Well, this is what the
Climate Doomsayers are doing, in an inverted way. They are simply trying
to tax you for the air you exhale.
 |
| Smokey the Bear, 1944. Between 1926 and 1943, 650 MILLION acres burned. Between 2004 and 2021, only 133 million acres were in flames. The existence of that ad proves that there was an alarming amount of wildfires in the 1930s and 1940s. It's posted here, pursuant to 17 USC 107, the Fair Use Act. | |
We now continue with forest fire facts. They're not what the media or the Biden admin claims. Forest fires were far worse in the 1920s & 1930s & 1940s than today. Observe:
According to the United States Forest Service's official statistics, there were FIVE TIMES MORE forest
fires in the United States in
the 1920s, 1930s, & 1940s than there have been in the most recent years of the same time duration. Yet, co2 levels were notably lower during the days when
raging forest fires compelled the US Forest Service to create their
first edition of the Smokey the Bear
poster.
The
first such poster appeared in 1944, after an 18 year period of forest
& grassland incineration, to the tune of 650 MILLION American acres
(1926 - 1943). In contrast, the amount of American acreage burnt in
the 18 year period comprising 2004 to 2021 was 133 million acres. Yet,
the 21st Century climate doomsayers have incessantly claimed that
today's "weather events" are the most severe & numerous ones in
decades, centuries, and even millennia, on account of a rise in co2 levels. The truth is, "They're not
even close."
This needs to sink into your mind and liberate you from the fear & dread being marketed worldwide: In
1926, the co2 level was 305 ppm. In 1943, it was 310 ppm. Today, it's
418 ppm. Thus, in the early decades of the 20th Century, there were 5 times MORE wildfire acreage consumed in the US than during this present era, even though the co2 level
was 108 to 113 ppm lower than today's 418 ppm. The Al Gore law of co2 behavior is now disproved. Incidentally ====>
Al Gore, Climate Spaz Extraordinaire, was never a scientist or an engineer, and he never won the Nobel Prize in Science. The peace prize is a different animal.
 |
Are you ready to start thinking yet? Or do you insist on believing the media mindlessly?
|
As
an added example of US wildfire rates, the acreage burned in the Decade of the 2010s was 65 million. If
you double this number, making it equivalent to a twenty year span, it
will amount to five times less than the 18 year span of 1926 - 1943. There is a lot more co2 today. Yet, there are a lot less forest fires.
So, if you are a "financially compensated" Climate Doomsayer, you'll abridge the Forest Service graph, and make your starting point, 1984. This will deceive the viewer into assuming that 1984 was an average year, instead of the lowest. The viewer will then think that the US is now out of control. The viewer will feel obligated to donate money to Bill Nye's Union of Concerned Scientists or to the UN, assuming that America now has to be saved. It's one of many sleight-of-hand deceptions used by the climate hysteria faction, as they present things in a False Light.
The Most Important Feature of co2 as it Applies to IR Light
CO2 has three varying vibration modes, concerning polarity which, in co2's case, is dipolarity.
In one of those three vibrations, co2 is incapable of capturing
infrared heat. This is how & why there can be an ice age during a
time when co2 levels are 9 times higher than today. Such a thing
actually happened on Planet Earth. During
the Ordovician Ice Age, co2 levels were more than NINE TIMES HIGHER
than they are today. This negates the Al Gore & John Kerry
assertion that rising co2 levels raise the temperature commensurately.
Important ===> See: CO2 Vibration Modes <===
At this point, keep in mind one more thing: At first, every climate spaz kept saying that the ultimate climate disasters are coming. This included the failed predictions about the Maldives' sea level, the glaciers at Glacier National Park, and Arctic Sea Ice performing a disappearing act. However, after years of failed predictions, the climate spaz faction now says that the climate disasters have been here all along, for the past fifty years. Well, why didn't they say so ten years ago, twenty years ago, or thirty years ago?
CO2 Gives Life. It Doesn't Take Lives Away. It's the Key to Photosynthesis
The much demonized co2 only comprises 0.042% of the Earth's first layer of atmosphere which happens to be called the Troposphere. In fraction form, co2 only occupies 21/50,000th of the aforesaid Troposphere which mostly reaches a height of 9 - 11 miles in the sky, but only 3.7 - 5 miles in height at the Poles.
In fact, co'2's radiative forcing is a humble 3.7 watts per meter squared, and such a thing can be compared to a night light, and not a military-grade flamethrower. This shows that co2 is not in a position to be the driver of an entire atmosphere, especially in terms of turbulent climate.
HOWEVER, co2 is the driver of some of the Earth's Biosphere, by having itself absorbed piece by piece & one by one, by plant after plant, tree after tree, flowers and grasses alike, as well as sea vegetation, one living unit at a time.
 |
This is symbolic of the rise in co2. During the rise, there is more green all around.
|
The Key to Life on Earth: Photosynthesis, the needed activity when going green.
CO2 is the gateway to photosynthesis. In fact, if co2 levels ever go below 150 ppm, all photosynthesis on Earth will cease. Life on Earth will follow suit. So, contrary to all of the doomsday hype of today, sung by those who ever-so-coincidentally make large sums of money on the hype, co2 is the first requirement in going green.
When a population increases, so too do the needs of greater crop yields. CO2 is the catalyst of greater food growth. To suppress it is to starve others. So, if you want to go green, then increase the co2 levels in the atmosphere.
According to the US Census Bureau, the world population is 7.9 billion. Fifty years prior, the population was 3.8 billion. A hundred years ago, the world population was estimated to have been 1.9 billion. When it comes to recognizing the actual needed level of co2, in as far as concerns the production of grains and vegetables, do the math.
As was previously stated, there was an Ice Age (Ordovician) that transpired when the co2 levels were more than NINE times higher than today. And naturally, it was the era of "calcite geochemistry." This, this explains the high level of airborne co2 at that time span. Equally as obvious is the fact that today's level of co2 is NOT death threatening to the respiratory tract. In fact, US satellite operators noticed that the increase in atmospheric co2 made the Earth greener. One of those witnesses is called NASA.
See: NASA's Satellite Technology is a witness to the added greening of the Earth
NASA reports a greener Earth of recent
CO2 levels making Earth Greener
Added co2 and added plant growth demonstration
 |
END OF INTRODUCTION
|
As far as concerns the California fires, they were the result of pathetically negligent forest maintenance which is addressed later in this discourse. Those fires cannot rightfully be counted as co2-generated weather disasters.
In addition, California is host to THREE deserts which are older than the gasoline engine. Incidentally, an official US agency declared that drought conditions in the US Southwest have been natural and long-term. The detailed quote pertaining to this is posted further inside this discourse.
%20Anvers%20Island.jpg) |
Photo by Marissa Goerke, Jan 6, 2021. Palmer Station, Anvers Island, (aka Antwerp Island.)
|
Another Example of Climate Doomsayer Deceit: This one involves Antarctica
It
was reported that Antarctica reached a record high of 63.5
degrees Fahrenheit, in the Southern Hemisphere's Summer of 2017, as if
Antarctica were in a super meltdown. Then, in the Summer of 2020, the
same
location recorded a "record high 64.9 degrees F." Upon this news, the
prognosticators & commentators came out like a deliberated jury who just convicted a defendant.
The truth is that the
place where those temperatures occurred was located 1,840 miles
away from the South Pole, at a research station that was located 206
miles OUTSIDE of the Antarctic Circle. In fact, it was located 700
miles from Argentina and/or Chile. It's called the Esperanza Base, and it's located near the tip of the Antarctic Peninsula.
Continuing "False Light" Saga
Then came a balancing-out event. In the following year, the Year 2021, the entire Antarctic continent underwent the coldest Winter in recorded history.
This
record-breaking Winter technically NEGATED all Global Warming claims, as
did the "Hiatus" (AKA "the Global Warming Pause") which endured from
1999 until the beginning of 2016. Likewise, this negated the Global
Warming hype as much as did the "decline" of circa 1940 to circa 1975.
Incidentally,
the year
of the highest concentration of Arctic ice was 1979. Moreover, there
were years in the 1970s and even the 1960s when Arctic Ice was low ...
for those particular years.
There
is pertinence to the fact that de facto cult leader, Al Gore, amassed
$250 - $350 million personal dollars into his personal financial
portfolio, while sounding the "Global Warming" alarm ... which was
changed
to the "Climate Change" alarm, on account of there having been a
cessation in Global Warming, starting in 1999. You should see this
wealth accumulation of Gore and others as
another sign that this Global Warming Alarm System was nothing more than
a money swindle, filled with deceit.
The lesson herein:
Legitimate facts can still be presented with disproportional perception
and twisted into a lie. That's called,"False Light" in American law.
 |
Dec 28, 1958. South Pole Station. Photo by US Navy and donated by Charlotte Koch.
|
And now, a segment of . . .
Decline Hider & Canadian Court Lawsuit Addict Michael Mann
This episode: His
very false claim that he personally was a co-winner of some kind of
Nobel Prize, when the liar is NOT recognized as such by the official
Nobel Prize Office, itself
The
Nobel Prize office, itself, was the evidence to disprove one of Michael
Mann's audacious lies. It consists in an audio recording, recorded by a
British journalist working for the National Review.
This recording
assures us that Michael Mann is NOT on the list of co-winning Nobel Prize
laureates, in either the science prize, the literature prize, or the peace prize. The
evidence (evidentiary audio) that Mann is a definitive con artist is
linked directly below. So, you do NOT have to feel that you have to be
bullied by him and submit to him.
And
you surely don't have to submit to the present-day press-media who
happens to be filled with people not known for common sense, honesty,
reason ... or humility. All
in all, Michael Mann is the ultimate Climate Denier in having denied
the existence of the Medieval Warm Period & the Mini-Ice-Age, not to
mention part of the 1940 to 1975 temperature decline, with all his
"math trick"ery. See: climategate emails.
In
his hockey stick climate
graph, Mann obviously omitted the decline of 1960 to 1975. So, why did
he not also omit 1940 to 1959? Was it because WWII and Korea were such
well remembered wars that history students will recall how bitterly cold
it was during some of those battles, especially those in Korea?
* * * * * * * * * * * * * * ** *
Audio Proof that Michael Mann's Nobel Prize Claim is a fraudulent misrepresentation (aka lie)
* * * * * * * * * * * * * * * *
At
this point, it's also important for you to realize that Al Gore NEVER
won the Nobel Prize in SCIENCE. Neither did the Intergovernmental Panel
on Climate Change (IPCC) win the science prize. The two entities, in a joint
awarding, won the Peace Prize, in 2007. The peace prize is separate from the science prize.
In addition, Michael Mann, Al Gore, and the IPCC never won the Nobel Prize in literature, as well.
Also,
Michael Mann never revealed the data sets that he used to justify the
drawing of his asininely ridiculous hockey stick climate graph that
denied the Medieval Warm Period and the very well chronicled Mini Ice
Age.
The
irony to that graph was that it was a straight declining line for 1,000
years. This meant that, according to Michael Mann, there are no
natural mechanisms to create weather variations on an upward temperature
trend. This would subsequently mean that the Planet Earth was headed
to a straight-line crash course into an irreversible Ice Age. According
to Mann, the Earth was saved from the Ice Age by a mere 317 ppm of CO2
(in 1960), followed by not-so-high 325 ppm of CO2 (in 1970) and then a
moderate 338 ppm of the same CO2 (in 1980), and then to a more moderate
354 ppm (in 1990).
Well,
there were a number of climate change scenarios in the past 4,000
years, when there were no combustible engines or coal power plants, and
in some cases, even chariots. Michael Mann's graph is an insult to
human intelligence. Well, all of Michael Mann is an insult to human
intelligence ... not merely his hockey stick graph.
The 2nd most asinine thing Michael Mann ever said in front of a camera.
Michael
Mann was asked how much CO2 must be removed from the atmosphere. Mann
confidently said, "Half the carbon dioxide in ten years," ... in order
to prevent a 1.5C catastrophic temperature rise. Stop there. Proxy
history showed that not even a 2C rise is catastrophic, but rather, a 2C
rise accompanied the rise of the great & historic Roman Empire, the
empire of half of my DNA base-lines ---the empire of half my ancestors.
For
the record, it was scientifically & professionally surmised, via
Mediterranean proxy material, that the Roman Warm Period was TWO degrees
CELSIUS warmer than today, and my ancestors fared very well during that
time, even during the hot hot African enterprises, and well as during
expeditions of Greece. Plus, the temperature rise helped my ancestors
finally conquer a hard hitting Gaul army, in an eight year-long war, in
present-day France. Thus, a 1.5C rise today is NOT anywhere near
catastrophic.
None
the less, here is the supreme asininity of that one Michael Mann
assertion, for those of you who spent your early years in the
mind-limiting American public school system:
{1}
Half of today's level of co2 = 209 parts per million (ppm). That
constitutes 51 ppm LESS THAN during cave-man days. That constitutes 87
ppm LESS THAN the start of the 20th Century. Both time periods were
when the human population was much smaller than today.
Here. See for yourself: ===> CO2 levels since 1800
{2a}
Today's population is 7.9 BILLION human beings, meaning that much more
crop harvesting is needed today than during cave-man days and during the
start of the 20th Century which had a estimated 1.9 billion humans
living on Earth. Thus, much more CO2 is needed, and coincidentally
enough, the atmosphere is presently providing the needed amount of CO2
for our era.
{2b}
CO2 is the KEY to PHOTOSYNTHESIS. When CO2 goes below 150 ppm, all
photosynthesis halts. Life on Earth soon follows suit. Dropping the
co2 count to 209 ppm is irresponsible.
In as much, pursuant to the NY Times vs Sullivan case law authority, I, a private citizen, state my opinion of public figure, Michael Mann:
Michael
Mann is a contrived fad. He's an artificially propped-up mouthpiece,
presented as the wisdom of the ages. Yet, he never showed the public
the data sets upon which his neon-lighted hockey stick climate graph is
founded.
Thus,
the one hockey stick graph which made him an artificially constructed
news show icon has never been tested for cracks. It has never been
test-driven. Would you buy a car you never test-drove? Of course not.
So, we the People of the United States do NOT buy Michael Mann's
untested climate change hockey stick graph.
Plus,
Michael Mann has a very financial conflict of interest in the promotion
of his hockey stick graph which omits the super obvious mini-ice-age
whose depth of cold went from 1645 to 1710, and which also included
within its time span the 1816 Summer that Never Was. Why don't the
newscasters ask Michael Mann how much personal money he personally made
since the publishing of his hockey stick graph? Why doesn't Michael
Mann simply come out and let us Americans know ... especially how many
taxpayer dollars went into his personal pockets?
None
the less, for the past 4,000 years, climate change has literally been
occurring every 124 to 600 years. Climate is a long-term roller
coaster.
A muscle-waning, very non-athletic, and equally non-aesthetic presence, with the most waning muscle being his heart muscle.
Michael
Mann proved himself to be utterly heartless, if not an indifferent
psychopath, against an elderly retired Air Force pilot, on account of
the pilot saying that, even though Michael Mann was teaching at Penn
State, he should have been at the State penn. One sentence spoken, and a
ridiculous amount of Canadian civil lawsuit attorney fees ensued.
The
retired and elderly pilot who earned a doctorate degree let me know how
much suffering Mann put him through, and he informed me that he
intended to let the world know about those sufferings after the lawsuit
ended. Well, the lawsuit ended. I don't know what happened. There was
no communication between me and the Canadian gentleman since I left
Chicago, in 2019.
For
now, I'll keep silent, out of civility. If the gentleman does pass
into eternity any time soon, I'll be the one letting you know about the
suffering caused by Michael Mann. Michael is hatefully ruthless, for
starters. He also thinks that you are completely stupid and gullible.
And remember, pursuant to NY Times vs Sullivan,
a private citizen may publicly state his opinion of a public figure.
I'll be politely reserved for now. I only stated half of my opinion
thus far.
It
suffices to state that some people in this world are really sick jokes,
and for long periods of relative time, it appears that they will get
away with every wrong they ever performed. But, appearances are not all
that they appear to be. History repeats itself.
Do
the math on this one ... on the person causing schoolchildren dread,
causing gasoline prices to skyrocket, and causing an elderly air force
pilot the loss of life savings and the accompanying dread. Justice, in
the end, prevails.
For
now, allies, be like a charming Latin gentleman, even if you hate us
Latins to the marrow of our beings. Charm doesn't hurt, though.

Once, an individual experienced in government contract work testified before a state senate committee, on climate issues. At the end of the session, one of the senators pulled out a pile of folders containing peer-reviewed science papers on atmospheric co2 issues. The senator acted as if he were the ultimate Sherlock Holmes who caught his man red-handed. The senator asked the scientist-witness to explain all those science papers, if the witness were so correct. Okay now, if this happens to you, you do the following =====>
{ 1} Slam on your witness table pile after pile after pile of 18th, 19th, and early 20th Century newspaper articles which show that the weather "back in those good ole days" was tragically worse, time period after time period. Newspaper archive services will be invaluable to you.
{2} Include piles of scientific papers which attest to the true existence of the Medieval Warm Period, the Mini Ice Age, the Justinian era Antique Little Ice Age, the Roman Warm Period and similar time spans in human history.
{3} Also slam on your table a copy of a private pilot training course's Weather Theory textbook, notifying the senator that Al Gore and Bill Nye teach contrary to the settled textbook science.
{4} Finally slam on your witness table a file of the 2009 Climategate Emails which proved to the majority of the People that the Global Warming Alarm was a money-grabbing scam, in the search of handsome outlays of Congressional funding, private contributions, and NGO grants.
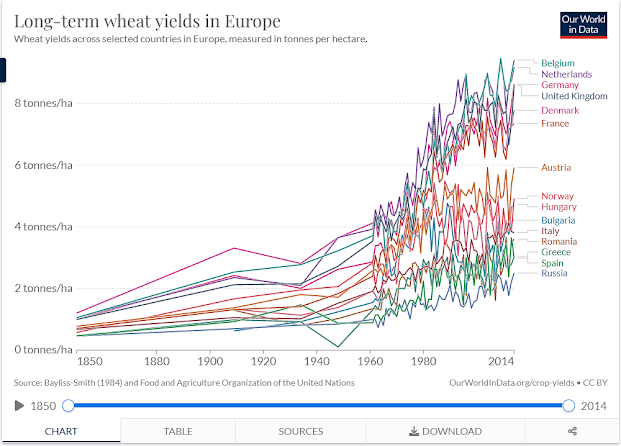 |
Question: Uhmmm, where on this graph is the man-man co2 driven Anthropogenic end-of-the-world Climate Crisis, again? This looks like a-need-of-some-dieting chart.
|
American Sales Training
In
American sales training, the trainees are told that one must create a
sense of urgency in the potential buyer's mind, in order to make a sale. The
Global Warming Hysteria is the act of scientists trying to make a sale.
They are doing everything they can to create a sense of urgency,
allowing school children to be filled with dread, in the process.
And
of course, the goal is to gain massive Congressional funding and/or NGO
donations, along with the absolute power one gets when an emergency is
declared. So, the picture constantly being painted by the Michael Manns
and John Kerrys of this world is that the world will soon come to an
obliterating end, and only they can save it. So remember, they're too
good for you. You should shut it and say, "Yaas sir" to everything
these guys who happen to be white have to say. They are willing to
dictate, but they refuse to debate or to explain themselves to you ...
because you and I don't count.
~ ~ ~
Okay
now: Back to trying to make sense out of the constant declarations of a
near-death Earth in an emergency, while the stats, facts, plain sight
of Planet Earth, and its history show the exact opposite to the
Declaration of Climate Doom.
Let
me try again. Now show me in this graph where the end-of-the-world,
man-made climate crisis is, again? I'm having trouble finding it.
Okay.
One more try. How about this chart? Now, the man-made climate crisis
which is causing the immediate end-of-the-world is indicated exactly
where here? Me no can find.
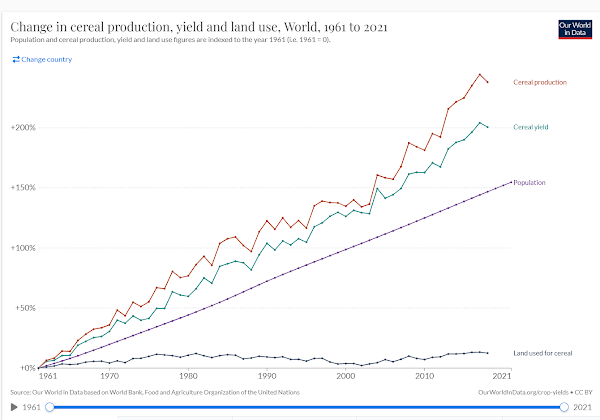 |
Nice End-of-the-World you got there guys. Oh, I'm terrified over all this cereal production.
|
We now bring greenhouse gases onto the scene
Climate
Doomsayers mention that co2 levels started to rise at the beginning of
the Industrial Age which is defined as having begun circa 1760. Fair
enough. That was 262 years ago. Well, science data shows that co2
levels
have been rising in the Earth's atmosphere for the past 6,700 years.
Of course, the rate of rise has advanced significantly in the 21st Century, even thought the United States co2 emissions decreased from 2007 to the beginning of 2020 --- during the final two Bush Jr years, most of the Obama years, and the first three Trump years. Therefore, if you are
searching for correlations in the rise in atmospheric co2, look at the
significantly advanced growth rate of the human population for the same time span. Then compare it to co2 levels.
In
fact, compare corn crop harvests to human population growth and to the
rise of atmospheric co2 Troposphere. The graph lines look very similar.
In as much,
Climate Doomsayers have shown definitive signs of being
eugenicists at heart, if not manipulative & pernicious ones in application. After all, do you deny that these same
alarmists see humanity as the great enemy of the Planet Earth?
Whatever
be the case with the psychological components of the typical Climate
Doomsayer, the center of each one's activism is Carbon Dioxide, when it
should be mercury, residual lead, synthetic chemicals, sulfur dioxide,
and the irresponsible stewardship of plastics. So, let us review carbon
dioxide, while first making a quick review of the Earth's Troposphere
in general:
Firstly,
water vapor in the atmosphere exists in varying quantities throughout
the Earth, ranging from .2% (2/1,000th) of the Troposphere to 4%
(4/100th) of the Troposphere. For now, water vapor percentage numbers
are omitted from the simplex equation below. The following numbers
generally apply at a relatively constant percentage:
The
Troposphere
comprises 78% Nitrogen, 21% Oxygen, & 0.93% Argon. This means that
99.93% of the Troposphere is NOT carbon dioxide. This furthermore
means that co2 is a Trace Gas which is too small in quantity to drive
the climate. In fact, Climate Change has been
naturally occurring throughout the existence of the Earth's atmosphere,
like a roller coaster, despite the level of co2.
When
Climate Change has arrived naturally in years, centuries, and Millennia
past, the change has been sudden. The only possible drivers of such a
sudden impact throughout the Earth is either 1} Sun Spot Activity or
other solar behaviors which affect the Earth's Magnetic Field or 2}
Ocean Oscillation Behavior. There is no other known factor which would
be a candidate in possessing such potential.
As
a pertinent point made in passing, the Sun's Irradiance is NOT a
factor, being that it is mostly constant. Those emissions from the sun
which do vary do matter. At your convenience, look-up Coronal Mass
Ejection (CME). Look up the Milankovitch Cycles.
A
Numerical Review ===> Firstly, today's level of atmospheric co2 is
418 parts per million, whereas, during caveman days, it was 260 ppm.
In fact, at the end of the most recent major Ice Age, it was 180 ppm.
Today's level translates into 0.042% of the Troposphere being co2. In
as much . . .
99.93% of the Troposphere (Nitrogen, Oxygen, Argon) + co2's 0.042% = approximately 99.972%
~ ~ ~
This
leaves us with approximately 0.028% of the atmosphere which is occupied by the following Trace
Gases:
1}
Xenon, 2} Helium, 3} Hydrogen, 4} Krypton, 5} Neon, 6} the vilified
Nitrous Oxide, and 7} the vilified Methane which, at last count, existed
in the Earth's 21st Century atmosphere at no more than 1.889 parts per
million. That's One-Point-Eight-Eight-Nine Parts Per Million. And
Nitrous Oxide, as was previously stated, is 1 part per 3 million, aka
330 ppb ... with the "b" meaning, billion.
Oh, and then we need to include the #1 greenhouse gas on Planet Earth which is WATER VAPOR. It leaves behind ZERO carbon footprint.
Water Vapor: 80% of all greenhouse gases by mass and 90% of the same, by volume.
Now,
water vapor exists in variable proportions throughout the Earth's
atmosphere, due to the differences in temperature, pressure systems,
& land elevations throughout the Earth. It's presence in the
atmosphere ranges from 0.2% to 4%. In fractions, water vapor is
1/500th to 1/25th of the atmosphere.
If
you insist on a slightly more concise measurement of the molecular
components in the Earth's Troposphere, subtract the applicable
percentage of water vapor from : 1} The 99.93% constant of Nitrogen,
Oxygen, & Argon ... 2} and from the 0.042% of the "gliding variable"
known as co2 ... 3} and also subtract it from the 0.028% of the other
trace gases. Next, add the Water Vapor number. However, without being
meticulous, you already have a sufficient idea of the amount of co2 in
the air, as well as the amounts of other molecular compounds and atomic
elements there.
In
terms of a fraction, as of 2022, co2 amounted to 21/50,000th of the
Earth's atmosphere. If you were to compare the atmosphere's molecules
to a Rose Bowl audience, 78,000 of the spectators would be Nitrogen,
21,000 of the fans would be Oxygen, 930 would be Argon, 42 would be
Carbon Dioxide, and 2 would be the much maligned Methane. N2O wouldn't even make the scene.
The Cirrus Cloud Factor, a Predominant One
At
this point, another revelation needs to be repeated ===> Cirrus
Clouds possess far more ability to capture / absorb / retain infrared
heat than does co2. The great irony here is that cirrus clouds are
entirely composed of ice.
In
addition, the irony about Carbon Dioxide goes as follows, especially in
light of the fact that modern activists accuse it of orchestrating a
conspiracy to heat the world to the point of destruction: In its liquid
state, Carbon Dioxide is commercially used as a . . . refrigerant.
Inconvenient Goof
Concerning
the large CO2 graph that Al Gore presented to the audience at the
beginning of his first science fiction movie, that which actually is
shown is that temperature first rises. Then co2 levels follow ... in
terms of centuries later. The rise in air temperature comes first. Then the rise in co2 follows.
The
understanding is that, as the oceans' surfaces warm, evaporation
occurs, and more co2 molecules are released into the air. But, the
warming of the ocean comes first. All in all, claiming what Al Gore
claimed about temperature & CO2 . . .
. . . is equivalent to claiming that "the steering wheel moves the driver's hands."
 |
Now remember, co2 levels have been rising for the past 6,700 years.
|
Concerning that time or two when you heard someone say, "If they could tax you for the air you breath, they would do it:::"
Remember that the climate doomsayers are trying to do this ... in the
inverted way ... in taxing you for the air you exhale, proverbially
speaking. Well . . .
The
average human exhales 2.3 lbs (circa 1 kg) a day --- 839 lbs a year x
7.9 billion humans = 6,628,100,000,000 lbs = 3,314,050,000 US Short
Tons per year. It might sound alarming, but 'tis no big deal in the
grand scale of the massive-sized Troposphere. Don't let anyone spook
you into Eugenics.
Most Important Feature of co2 as it Applies to Infrared Light
CO2 has three varying vibration modes, concerning polarity which, in co2's case, is dipolarity.
In one of those three vibrations, co2 is incapable of capturing
infrared heat. This is how & why there can be an ice age during a
time when co2 levels are 9 times higher than today. Such a thing
actually happened on Planet Earth. During
the Ordovician Ice Age, co2 levels were more than NINE TIMES HIGHER
than they are today. This negates the Al Gore & John Kerry
assertion that rising co2 levels raise the temperature commensurately.
Extremely Important: CO2 Vibration Modes <=====
*******************
And remember, it has been recognized that the radiative forcing of co2, when it
can capture infrared heat, is 3.7 watts per meter squared. That's a
night light. After all, CO2 is plant fertilizer ... NOT jet fuel.
 |
And remember folks, photosynthesis comes in many colors.
|
The True Correlation, or lack thereof, between co2 and land surface temperatures:
In
contrast to the predictions of doom, it has been repeatedly observed
that, as the co2 levels on Earth rose throughout the 20th & 21st
Centuries, the life expectancy of humans also rose throughout the
world. And amidst the political damning of life-giving co2, the Earth
has been increasing its acreage of greenery, as well as enjoying rising
crop harvest numbers & record crop harvests. In as much, if you
want to go green, you must first increase the co2 level in the Earth's
atmosphere.
See: How an increase in co2 increases plant size
& NASA Studies a Greening Arctic
Also See: Study Observes Rising co2 Levels & the Re-greening Effect on Earth
All
in all, Carbon Dioxide replaced the Iraqi Weapons of Mass Destruction,
as an excuse for creating fear amongst Americans. The Weapons of Mass
Destruction Scare was in 2003 & 2004 The CO2 Global Warming Scare
started with the first Al Gore movie, in 2006. Ever-so-Coincidental
Timing.
All in all, Carbon Dioxide replaced the Iraqi Weapons of Mass Destruction, as an excuse for creating fear amongst Americans. The Weapons of Mass Destruction Scare was in 2003 & 2004 The CO2 Global Warming Scare started with the first Al Gore movie, in 2006. Ever-so-Coincidental Timing.
Droughts
Scientists and archeologists have repeatedly conjectured the existence of a 150 year mega-drought in the American West, starting in the final century of the Medieval Warm Period. In confirmed specificity, (via tree ring analysis), there was a Great North American Drought which occurred between 1276 &1299 C.E. This occurred long before the invention of the gasoline engine, when co2 levels were notably lower than they are today. This shows that the Medieval Warm Period WAS a global event occurring in more than one Hemisphere, and not merely something limited to Northern Europe.
For the record, the Medieval Warm Period endured from circa 800AD to 1348AD. In addition, the Mini Ice Age which followed endured from 1348AD to circa 1850AD.
Despite the scientific discovery of a great Medieval drought in America, it was in 2014 when NASA released the details of a study which found that the Drought of 1934 was the worst one in a thousand years. That drought encompassed 71.6% percent of the western North American land mass. This is more than the land mass affected by the Drought of 2012, which encompassed 59.7% of the same geographic area in general. None the less, the second most severe drought in America, as recognized by scientists, was the one of 1580, when co2 levels were significantly lower than today, and when the invention of the combustible engine was 310 years away.
See: NASA Study finds that the worst drought in the past 1,000 years was in 1934
Also See: The Worst Drought in a Thousand Years
 |
May 1934 was only the beginning of it all. Summertime was yet to come.
|
The media deception employed today is to deceive the public into believing that no heat wave or drought in the past thousand years comes close to the one of 2022. This also diverts attention away from the fact that, the year prior, Antarctica underwent its COLDEST WINTER in known history.
The drought of this Summer (2022) extended thus far to 39.8% of the US. The droughts of 1934, 1580, and 2012 have got it beat. Plus, 1954 was a year of severe drought, as was 1936, not to mention the trio of 1988, 1989, & 1990. There is also a drought list of centuries prior. All in all, the United States government officially asserts that "Drought is a normal climate pattern that has occurred in varying degrees of length, severity, and size throughout history."
The exact same United States government declared that:
"Tree ring archives indicate that
agricultural droughts such as those that happened in the United States
during the 1930s Dust Bowl era have occurred occasionally over the last
1,000 years, and climate
model simulations suggest that droughts that may last several years to
even decades OCCUR NATURALLY in the southwestern U.S." (This negates Michael Mann's and David Attenborough's claim that the weather/climate of the past one thousand years was predominately benign and stable.)
This recognition of the American Southwest's natural drought potential also includes Southern California. In fact, it includes what is properly regarded as the Leeward Side of California, as well as the Santa Ana Side, and as well as the Death Valley side of the state. Therefore, Gavin Newsom was 100% lying to you, when he stated that co2 levels finally reached the stage where the Apocalypse came to California.
The lack of "controlled burns" in California for consecutive decades caused the disastrous volume of burnt acreage, in recent years. When you let massive acreage of fallen trees sit for decades, you create kindling wood that can easily torch forestland as easily as can gallons of gasoline. Even at that, the forest fires of the 1920s, 1930s, & 1940s, in acreage burned, were far worse than the ones in the 21st Century ... the Century of Liars in Power.
See: US National Integrated Drought Information System
The horror stories of present doomsday droughts have one huge folly which makes the scientists announcing the dreadful conditions look like the stereotypical high school ~nerds, ~dorks, ~dweebs, ~geeks, ~wedgy boys, ~swirly boys, etc. And that is this ====> No one in America is thirsting to death in societal quantities. Bodies are not strewn throughout the lands, in heart-wrenching scenes. Houses are not covered with windswept dust.
The other outrage is in claiming that certain victims of war are victims of Climate Change. In as much, there is a difference between a drought refugee and a war refugee coming out of Adiabatic Heating deserts or 30th Parallel convection deserts. Example, Syria does have a desert and has had it for a long while.
It then got to the point where large snowstorms & record colds were attributed to evil evil Climate Change. Sometimes, it was done by misinterpreting "Lake Effect Snow." At other times, subtropical low pressure systems were called the cause of such storms, in a delayed effect of moisture retention in the sky. However, it does not work "that way" when the time delay goes from August to December. This is because, according to NASA, a water molecule endures in the atmosphere for an average of nine days only. Therefore, a heated August will NOT be the cause of heavy January snow.
All of this Climate Change Hysteria has been another sequel to the Revenge of the Nerds. Do you remember how weird "they" (the real nerds) were in high school? Well, they're still weird, today.
 |
My travels through Southern California during the Summer & the Drought of 2012.
|
Even during the 2016 Democratic Party presidential convention, Sigourney Weaver stated, as the narrator of a film presentation, that mankind never saw such disastrous weather events as it did in the 21st Century. However, weather events were far worse or far more frequent in the 1930s, 1920s, 1890s, 1870s, 1650s, 1600s, 536, etc. After all, it was during the centuries said to be mild in climate by climate doomsayers when massive sea storms wreaked havoc on entire naval fleets.
See: Sigourney Weaver's really really REALLY big lie told at 2016 Dem. National Convention
Learning of the Grindelwald Fluctuation (in Switzerland) alone would have been enough to awaken one to the reality of the true existence of the Mini Ice Age. In fact, the Dust Bowl Years were not centuries prior to Sigourney's birth. It was mentioned in classrooms in 1960s & 1970s. Yet, Sigourney became the ultimate climate denier in having denied massive weather disasters throughout the past thousand years.
There was a super huge irony to this. She's known as a SCIENCE FICTION actress, in the COMEDY sector of science fiction film making. That particular political convention night turned out to be nothing more than another science fiction performance. All in all, the lessons at hand go as follows ===>
1} Nuclear Winter is worse than Global Warming could ever be.
2} There is a distinct difference between a drought (temporary) and a desert (permanent).
3} There is also a difference between Crisis Flooding and a yearly Monsoon Season.
Next comes the Al Gore & John Kerry list of weather disasters which both non-scientist politician claims are caused by increased levels of co2 in the atmosphere. Some of those disasters require high pressure systems, while other disastrous weather events require low pressure ones. So, which one is it, Al Gore & John Kerry followers? Does added co2 trigger low pressure disasters such as hurricanes or does it trigger high pressure ones such as droughts?
Actually, according to mainstream atmospheric science (aka textbook material), the cooling of the atmosphere causes the major weather disasters, due to something called, "Pressure Gradient Forcing."
The law of pressure gradient forcing is elementary and it goes as follows ===> The smaller the numerical temperature difference between the Poles and the Equator, the LESS is the atmospheric TURBULENCE that occurs. Such an atmospheric turbulence is a hurricane, where the atmosphere is evening-out the heat distribution of the Earth, by sending northward the excess heat in the Tropics.
4b2} During Global Warming phases, there is less "equalizing heat" to transfer northward. So, during true Global Warming phases, such as during the Copper Age Warm Period, the Minoan Warm Period, the Roman Warm Period, & the Medieval Warm Period, atmospheric disturbances are less frequent.
4b3} Likewise, if there is a greater difference in temperature between the Poles and the Equator, as there is during any Global Cooling phase, there is more of an imbalance of heat, and that amount of extra heat gets transferred northward ... or even southward until meeting the 50th Parallel South, which is called the Roaring 50s, at its seas. This transfer of heat is a balancing act.
Incidentally, northern hemispheric hurricanes spin counterclockwise, and southern hemispheric hurricanes (aka typhoons) rotate clockwise. Hurricanes are incapable of crossing over the Equator.
Moreover, low pressure systems in the Northern Hemisphere rotate counterclockwise, while high pressure systems throughout that same hemisphere rotate clockwise. Welcome to a Round Earth that spins at a 23.5 degree tilt, at 1,037 mph around its equator.
All in all, disastrous weather events abound during Global Cooling phases, including wintertime. After all, it's only during the wintertime when the Polar Jet Stream meanders so wildly at times. And it does NOT do so, on account of increased co2 levels, as Bill Nye fraudulently claimed. It does so, on account of Pressure Gradient Forcing. All in all, introduce yourself to Heat Transfer science.
Lying Wolf in Shepherd's Clothing
Concerning Bill Nye in all of his passive arrogance, watch him (in the video linked directly below here) belittle an MIT professor, as if the professor were an incoherent lunatic. This resulted in the public seeing that Nye actually knew nothing about atmospheric physics. Concerning this, Nye disrespectfully said that the professor's assertions were recognized by 1 in 100,000 scientists. Well, even if it were true that 97% of the scientists agreed on the co2 climate theory, (It was proven false) 97% translates into 32 to 1, and not 100,000 to 1. Liars exaggerate.
Moreover, the MIT professor stated that what he mentioned was "textbook material," and if the "Union of Concerned Scientists" were correct in their claims, then all of the schools (colleges) should be closed-down. The professor was conveying the common understanding of Atmospheric Physics; not Bill Nye.
See ::: Nye being corrected by MIT atmospheric physics professor
Speaking
of deception, the Climategate emails revealed that many temperature reports
of the African Continent were made-up. In fact, record heat was
reported in African places where there were absolutely NO WEATHER MONITORING
STATIONS.
Now watch (in the video linked below) how Bill Nye's Union of "Concerned" Scientists get caught making notably erroneous doomsday assertions which means that those scientists are either deliberate frauds or pathetically incompetent buffoons. Being that fund-raising was involved, one can suspect deliberate fraud as the motivating factor in the invalid doomsday assertions made by those people.
See ::: Sea Level Fraud at the Union of Concerned Scientists
 |
The majority proportion of water in the oceans exists at 39 degrees Fahrenheit.
|
Concerning Global Warming History, science researchers recently found that it was TWO degrees Celsius WARMER during the Roman Warm Period than it is today. Therefore, according to Bill Nye, it was impossible for there to have ever been a Roman Empire, in that the 2C degree heat increase would have resulted in a climate so hostile that no one could organize government and society. Well, that warm-weather empire did exist and it flourished for centuries, even in hot-hot Africa.
Okay, if they're so great, then where are the Romans today? Well, one of those DNA-certified descendants of the Roman Empire is typing-out this discourse as a public service to those who are being readily deceived by con artists who hold a lot of Congressional funding dollars and/or NGO grant money, as well as carbon credit residuals in their bank accounts, not to mention them holding their names on the deeds of luxurious living quarters & the titles of luxurious cars.
Incidentally, this discourse is being typed in a construction trailer, six feet away from a drafting table. No wall to wall carpeting is here; or any other luxury that you will find in the homes of Gore, Kerry, or DiCaprio.
For the sake of time orientation purposes, know that the Roman Warm Period is more concisely understood to have begun at the time of Julius Caesar or Caesar Augustus, and it is understood to have ended at the start of the dreadful Justinian Plague. In fact, 536 AD was regarded as the most disastrous year in human history ... not 2022.
See ::: The Roman Warm Period was 2 degrees Celsius warmer than today.
The cooling period that started during the reign of Justinian is known as the Late Antique Little Ice Age.
It was described by scientists as "an abrupt 124 year freeze," and it
was marked by aridity and famine. It left continents of people weakened and vulnerable to the invasions of a newly formed religion which imposed death or a tax called the Jizya upon those who did not adhere to the newly formed religion. The abrupt cooling period is conjectured to have been
triggered by three major volcanic eruptions in an eleven year period, the first one erupting in 536AD and the most massive one erupting in 540AD.
Notice the pattern ::: A couple mini-ice-ages each start at the beginning of a plague. Think.
During a volcanic eruption, a lot of co2 and a lot of sulfur dioxide is released into the atmosphere. Now, with the tremendous amount of co2 being thrust into the Troposphere, one would think that the weather after a volcano would be warm. The truth is, after a volcanic eruption, cold weather ensues. An example is the 1815 eruption of Mt Tambora. It resulted in the 1816 "Summer that Never Was."
The truth is that the sulfur dioxide thrust into the atmosphere by volcanoes supersedes co2 and causes drastic cooling. This is because sulfur dioxide molecules are like mirrors that reflect solar radiation back into outer space. Such cooling is known as "the aerosol effect."
None the less, before the Roman Warm Period, there was a cooling period marked by glacier advances on Earth. In fact, the existence of the Copper Age Warming Period occurred circa 2913 B.C.E. This began the gradual aridification process of Egypt. There was also a Bronze Age Warm Period, circa 2040 BCE. This was a time marked by aridity and famine, too. It also marked the start of the Egyptian Middle Kingdom.
When speaking of Cooling Phases being more likely to accompany disastrous weather events, take the common tornado as an example. That which is required for a tornado to form and to activate is ====> "a downdraft of COLD air." Without the cold making an appearance, there are no tornadoes.
Incidentally, Global Warming was first mentioned on air in 1983, on the NBC Nightly News, by the late Jessica Savitch. Tragically, Jessica died in late October of that same year, in an automobile accident. She and a New York Post manager were found under five feet of water, in the Delaware Canal, 30 miles from Philly. She was only 35.
The True Textbook-Defined Signature of Global Warming
If there is no temperature rise in the middle of the Troposphere, then there is no global warming. There was no Tropospheric temperature rise between 1999 and 2016. This was called the Hiatus (the resting --- the "Global Warming Pause").
Then certain scientists schemed to find a way to claim that there was no hiatus between 1999-2016, as if scientists didn't get smart until 2017. They literally claimed that the accumulated heat was hiding in the oceans. Stop here. Penalty Flag Time. Insult to the Intelligence. This declaration is more of a matter of False Light "sleight-of-hand" deception than a completely false statement. But, it's instantly invalidating. Let's go through the steps that will dispel the deception:
The United States National Oceanic & Atmospheric Administration recognizes that ===>
>Functionally Effective Sunlight does NOT penetrate the oceans any deeper than 656 feet. This layer of ocean water is known as the Euphotic Zone. From the 656 foot point downward, photosynthesis is impossible. So, throughout an added depth of 2,624 feet (which is directly below the Euphotic Zone), the descending sunlight becomes the increasingly darker. The twilight layer of an ocean is the Dysphotic Zone.
>Below this line there is no light, and this super deep layer of ocean is called the Aphotic Zone. It begins at the 3,280 feet mark of sunlight's descent into any ocean. The Aphotic Zone is marked by darkness and cold, until one reaches the bottom of the ocean where "hot spot" volcanoes and other heat sources sit. And remember, remember, remember: CO2 has no heating power in the dark of the ocean.
>Moreover, at the depth of 660 feet, directly below the Euphotic Zone, the ocean's Temperature drastically decreases, to approximately 55 degrees F (13C). This spot in each ocean is called the Thermocline, and when traveling past this depth which happens to beat the 660 feet mark, the temperature decreases to approximately 39 degrees F (4C).
This decline in temperature takes 3,280 feet to achieve. This 39F is the temperature of the rest of each ocean ... through the descent to the bottom of each ocean. At the bottom are ocean floor heat sources (aka Hydrothermal Vents.) Incidentally, those vents exist where the tectonic plates of two continents are spreading apart, usually.
Next in consideration is the fact that actual Heat Transfer into the ocean only occurs at the first meter of the ocean's surface. It happens at the top. It stays at the top. And one meter of water is not a Fort Knox vault that can hold ever-increasing amounts of heat. So, how much heat can one meter of salty ocean water hold? Here is the follow-up question ===>
>Where
in any salty ocean is there room for added heat caused by greenhouse gas
absorption, in light of the absence of infrared light to be captured by co2? The surmise is that, when ocean temperatures do rise, they
only slowly rise as a result of heat from the ocean
floor ... from hydrothermal vents "aka hot spots" which can reach 700F. Concerning the rise in heat, there is a line in each ocean called the Pycnocline. It has a lot of influence as to where that heat will or will not float.
| Ocean depths | |constant 39 degrees Fahrenheit in Aphotic Zone|
Atlantic | avg ~12,881 ft \ deepest ~28,232 ft \ Aphotic Zone depth ~ 9,601 ft
Pacific | avg ~13,215 ft \ deepest 35,840 ft \ Aphotic Zone depth ~ 9,915 ft
India | avg ~13,002 ft \ deepest ~23,812 ft \ Aphotic Zone depth ~ 9,702 ft
Arctic | avg ~ 3,953 ft \ deepest ~17,881 ft \ Aphotic Zone depth ~ 653 ft
Southern | avg ~10,728 ft \ deepest~ 25,383 ft \ Aphotic Zone depth ~ 7,428 ft
 |
No sunlight = No infrared heat = No co2 heat absorption.
|
Now, there was the matter of the 2018 "Keeling Paper," authored by Ralph Keeling's team and not by the Dr Charles Keeling of the 1950s. It was actually called, the Resplandy Research Group Paper. None the less, the 2018 paper claimed that oceans heated 60% more rapidly than previously realized. The paper's subject matter was regarded as "startling," and the media heralded it as the smoking gun which absolutely proved the existence of a "climate crisis."
Within two weeks of time, a mathematically inclined gentleman associated with a Georgia Tech Atmospheric Science professor discovered decisive mathematical errors in the Ocean Warming Paper. This discovery negated the entire conclusion of the paper. A Nicholas Lewis found the errors.
In sequence, one of the 2018 paper's authors publicly admitted the errors, as did the prestigious publisher of the paper. However, any retractions from the rest of the American media could not be located.
None the less, at the outset of the study, it was obvious that the paper's thesis statement was a falsehood. This is because it contradicted a well known scientific fact involving Seas Breezes and Land Breezes. Very simply, a change of temperature at any of the oceans is much more slowly accomplished than is the change of temperature at any land surface. And being that there was no 60% rate increase in land surface temperatures anywhere, there surely would not be this phenomenon at the oceans. Thus, the Keeling Paper (aka the Resplandy Paper) was guaranteed to be marked with error.
As was previously mentioned, an ocean's warming would NOT come from co2 engaging with infrared light at the surface thereof. It would come from the heat sources at the bottom of that ocean which can reach 700F. None the less, it's notably cold throughout the 9,000 and 7,000 foot descents to the bottom of oceans. The means that the present heat source for the constant 39F temperature is not at all daunting.
See ::: Team Keeling & Publisher admit to decisive mathematical errors in doomsday paper
See also: Widely Reported & Alarming Ocean Warming Study is Wrong
This too: Media Gave Blanket Coverage to Flawed Climate Paper
Mathematician's Statement: Major Problem with Ocean Heat Uptake Paper
The Methane Scare is the Most Absurd of the Doomsday Claims
Methane only exists in the Earth's Troposphere at 1.886 parts per million. Therefore, methane is NOT a factor in Global Warming in any capacity, even though a methane molecule has 28 times more IR heat retaining capacity than does a co2 molecule. There is simply not enough methane in the atmosphere for you to worry.
 |
A Rocky Mountain Top in New Mexico, 2012. The clouds stayed on one side of the mountain. Welcome to Adiabatic Warming.
|
a} That which is called the result of "global warming" is actually the result of Adiabatic Heating which occurs on the the Leeward Side of mountain ranges; mostly the east side. This is because, as clouds rise up the Western side (aka the Windward Side) of a mountain range, they release moisture during the ascent. This is known as the process of Orographic Lifting. This lifting of a cloud mass accompanies the release of rain as the clouds' ascent continues. By the time the same air mass reaches the top, all that is left is a cold & dry parcel of air which descends the mountain range, thereby creating deserts. There is the matter of heating which occurs during the air parcel's descent.
b} The dry air parcels which descend mountain tops are called ::: ~Foehn Winds, ~Chinook Winds, ~Santa Ana Winds, & ~Down-sloping Winds. As a dry air parcel descends a mountaintop, it encounters higher & heavier pressured air which easily exists at the surface of the Earth. As a result, the down-sloping air compresses and shrinks in size. This causes the molecules within it to collide and vibrate more aggressively, resulting in a sudden rise in temperature.
c1a} Proof that this dryness is the result of Adiabatic Warming, and NOT co2-driven Global Warming, exists in the fact that, when you are out West, you notice that the clouds in the sky never cross over the mountain tops. The clouds stay on one side.
c1b} Incidentally, I'm the son of a native Wyoming gal. In fact, I have literally been at the southernmost tip of the Rocky Mountains, in New Mexico. I witnessed it. I was there.
At this point it would suffice to state that the vast majority of Climate Change activists need to do something called, "go outside," and not merely to the park. People who worked in the outdoors hour after hour and year after year have a more clear understanding of weather behavior, simply by means of decades of experience. Back to the matter hand:
c2} Examples of deserts created by Adiabatic Heating ::: The Red Desert of Wyoming is in the center south of the State. Plus, the center of Oregon has a desert located east of the Cascades and south of the Blue Mountains. The Leeward Side of California is desert land extraordinaire, and it was that condition long before 21st Century co2 levels increased. Etc go the examples.
c3} Plus, the super large deserts of the Earth are all on the 30th parallel (north & south) wherever the desert was not the result of Leeward Adiabatic Warming. 30th Parallel deserts were caused by very large "convection cells."
Example ===> The Sahara Desert is the size of the USA, and 6,000 years ago the Sahara was a lush forest/jungle, with cave wall drawings that looked like the ones in France. This time span is known as the African Humid Period. There were no gasoline engines to turn the Sahara into a desert. It was a major convection cell at the 30th Parallel that caused it. The super large convection cell still exists. It's presently called the Hadley Cell of the Northern Hemisphere.
When viewing Globes or maps, do not forget the 23.5 degree tilt (aka obliquity) of the Earth.
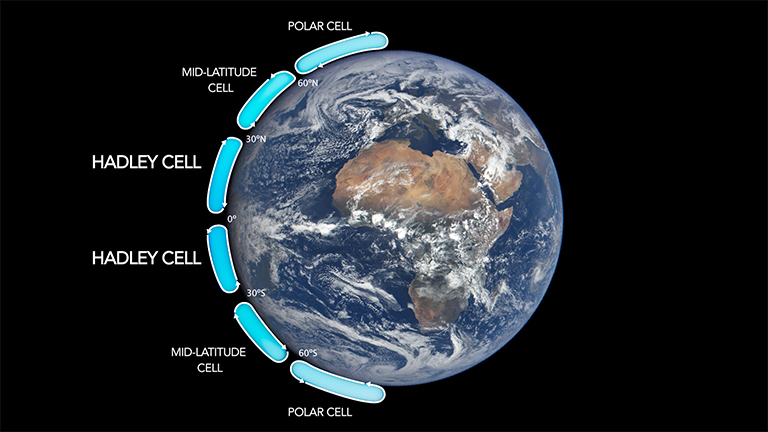 |
The geometry of the vast Sahara region and the northern hemispheric Hadley Cell.
|
And then there is the alternating of directional ocean flow between El Nino & La Nina ocean oscillations, at the Equator. This is when ocean water does NOT travel like a rotating gyroscope, but rather, the current-flow travels west to east to eventually west again, etc. The El Nino & La Nino equatorial currents travel between Longitudes 120E & 80W, and it has had a huge effect on American and Australian weather.
An El Nino event is one that starts during late December and endures for approximately four years (from 2 - 7 yrs, actually). It was named after the Christ Child, and it is associated with heat in the American Continent. La Nina is the eventual counteraction of those equatorial ocean currents, and it is associated with colder than usual temperatures on the American Continent. The Year 1998 was an El Nino Year. It was associated with a warm American Winter which frightened everyone who had no experience in atmospheric science. Yet, it was pleasurable. It was the Winter of little shivering.
The El Nino Southern Oscillation is abbreviated ENSO.
At this point, it is important to note that, throughout the rest of the Earth, the ocean surfaces are composed of massive GYRES which rotate like gigantic gyroscopes. This is why ocean waves crash into the shoreline at an angle, instead of doing so in a straight line. This angular wave motion is one of many proofs that the Earth is round, and it involves something known as the Coriolis Effect which you can look-up at your convenience.
The Coriolis Effect also involves something known as Eckman Transport which can refute one of Al Gore's paranoiac claims about climate doom in the northern part of the Atlantic Ocean. Gore and his team claimed that fresh-water ice from Greenland will progressively melt into the Atlantic, thereby lessening the ocean's salt content, and thereby causing the ocean to stop circulating and to cause an Ice Age in England. Well, if such a melting scenario were possible, it would only result in suppression of ocean down-welling and upwelling. In order to get the oceans to stop moving, you need to stop the rotation of the Earth and you need to stop the formation of wind.
Incidentally, if you want to identify a climate fraud, simply ask that person this: "What is the definition of wind?" The fraud won't know the answer. Wind is high pressure air traveling toward low pressure air ... denser air making a route to empty itself into air with less compacted air parcels. It's high pressure gravitating toward low pressure. You can even effectively define wind as high pressure air chasing low pressure air. The concept is understood as such.
Upwelling involves the providing of nutrients to sea life which abides in the Euphotic Zone. Concerning this, nature apparently has within it compensatory features throughout the Earth. Nature apparently has a Plan B, when upwelling is mitigated or halted. This is because a certain food source unexpectedly super-multipled as of recently, and such a thing will prevent any environmental oceanic crisis caused by the blocking of upwelling. It's called coccolithophore phytoplankton. In fact, there is an area in the Gulf of Mexico which used to be called the Dead Zone, due to the negligent draining of residual industrial fertilizer there, via the Mississippi River. It's back to life now, and a major presence there is the coccolithophore phytoplankton.
Concerning the effort to understand ocean down-welling, it is needed to look-up Pycnocline.
This discourse also omits mention of Sublimation and Deposition. Sublimation is when ice turns into vapor without going through the melted liquid stage. Deposition is when vapor suddenly turns into ice.
Two points to make about sublimation, before we move on: A sign that sublimation has occurred is that the ice is jagged. When ice is partially jagged and only partially smoothed-out, that's the result of partial sublimation, needless to say.
The greatest example of sublimation is at the top of the Himalaya Mountains. The greatest example of partial sublimation is seen on the walls of calving ice. Contrary to mainstream media's explanation thereof, calving ice is NOT the result of melting ice. Melting ice simply recedes. It does not perform a grand dive into the ocean. Calving is the result of an increase of snow toward the center of a landmass, pushing out the snow at the shorelines. Yes, calving is the sign of increased snow, while calving ice walls are partially jagged and partially smoothed-out.
Concerning the Thermohaline Circulation which is not to be confused with the Thermocline
An activist giving a speech might simultaneously show a world map projection marked with a colorful band/line traveling through the Indian and Atlantic Oceans. It looks like a ribbon. This can deceive the untrained public into assuming that the water motion symbolized by the ribbon is located at the surface of the Atlantic and Indian Oceans. Well, the previously mentioned gigantic OCEAN GYRES are what exist at the surface of the oceans. In fact, the massive gyre in the American side of the Atlantic ocean is called the Sargasso Sea. Al Gore is not a good teacher, in his withholding too many facts.
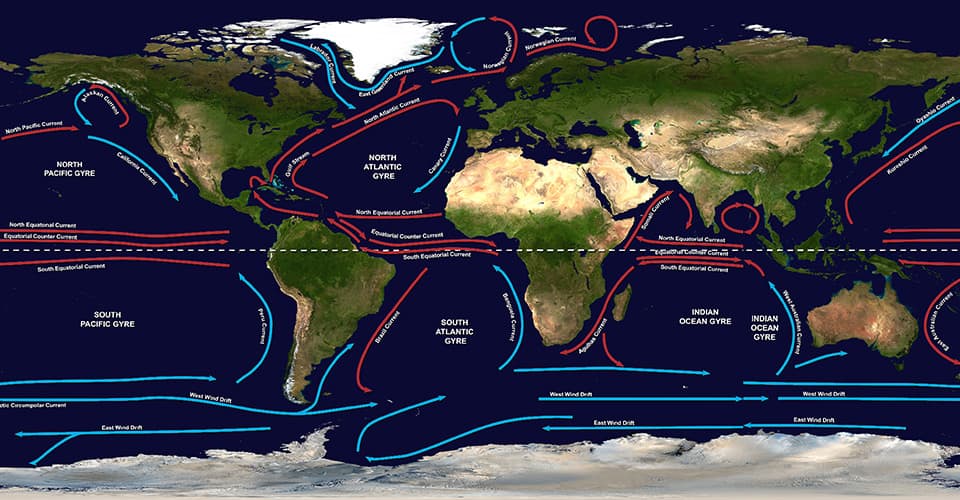 |
From the United States National Ocean Service --- (the NOS)
|
Being that ocean gyres are important in understanding how much of a fraud the Al Gore people have been, one needs to understand the Coriolis Effect. This involves the rotation and tilt of the Earth (aka the Earth's "obliquity"). Firstly, the Earth presently tilts at 23.5 degree slant. Secondly, the Earth is revolving around the sun at 66,660 miles per hour. At the Equator it rotates around itself at 1,037 miles per hour. Moreover, the Earth's Rotation Speed at various latitudes go as follows, in miles per hour (mph) :::
10 degrees: 1021mph 20 deg: 975mph 30 deg: 898mph 40 deg: 795mph
50 degrees: 667mph 60 deg: 519mph 70 deg: 355mph 80 deg: 180mph
~~~~~~~~~~~~~~~~~~~~~~~~~~~~~~~~~~~~~~~~~~~~~~~~~
Now, keep in mind also that the warmest latitude on Earth is NOT always the Equator. The warmest latitude is the Summertime Tropic, at 23.5 degrees, if a Summertime is in progress, as opposed to an Autumn or Springtime.
Spring vs Autumn CO2 Levels
Speaking of Springtime, Al Gore stated in his first science fiction movie that, during Springtime, co2 is abundant, and during autumn's harvest season, co2 levels in the atmosphere are low. The truth is that the difference between the Springtime level of co2 and the Autumn level is no more than 2%. It's merely a 2% difference. Again, Gore was a terrible teacher.
Heat's Entrance & Exit Rates at the Earth's Various Latitudes
It would also have helped for someone to have admitted that, 24 hours a day, 7 days a week, the following occurs ===> From the 40th parallel of both hemispheres to the poles of both hemispheres, more heat exits Planet Earth's atmosphere into outer space than enters Earth's atmosphere from outer space. The Earth's only viable source of heat is the Sun, and the Earth's storehouse of heat mostly exists from Latitude 40 degrees N to Latitude 40 degrees S ... or visa-versa.
Two more things, regarding this ::: 1} The Earth is FARTHEST from the Sun during the Northern Hemisphere's Summer and the Southern Hemisphere's Winter. 2} The Earth spins from West to East.
Their Failed Doomsday Predictions & Hypocrisy
The Global Warmists failed in ALL of their doomsday predictions, mostly made circa 1988. All of the predicted climate doom was supposed to have been complete by 2018-2020. In fact, during this present time span, when the media obsessively barks out "Climate Change," Antarctica recently had it coldest day in recorded history, so recorded by satellite technology ::: a MINUS 135.7.
Furthermore, in 2021, the same Antarctica had its coldest six-month period on record. Even the prejudiced & slanted CNN reported that fact. BTW, this Antarctic six month period is more commonly known as WINTER.
The Antarctic held its coldest winter in known history, in 2021. That's a sure sign that the phenomenon of NOT-Global-Warming is occurring throughout the Earth. The temperature gets evened-out in such scenarios.
Examples of failed Climate Change predictions go as follows :::
~The Maldives were predicted to be underwater by 2018. In 2022, the Maldives are alive and well, with financially affluent human life there.
~ The glaciers of Glacier National park were supposed to be gone by 2020. Actually, there were originally predicted to have been gone by 1948. They are still there, and a lot of snowplowing goes on at Glacier National in April, May, and even June, to make the tourist roads clear.
~And of course, the Arctic Ocean's sea ice didn't completely or even almost melt away in any Summer since the 1988, or in any Summer since 1388. However, in 1904 was the sailing of the Northwest Passage, slightly north of Alaska and the such.
The least amount of sea ice in the Arctic Ocean was during the Summer of 2012. The remaining ice there was still 1.32 million square miles in size. In fact, to travel over the Arctic Ocean's 2012 Summertime sea ice sheet was equivalent to driving from Fargo North Dakota to San Diego California, as well as driving from the Southern border of New Mexico to the northern border of Montana. That is a lot of road travel. That is a lot of Summertime ice. Etc go the examples of failed doomsday prophecies.
There turned out to be a great irony in the Climate Doomsayers having selected the
Year 2020 as the predicted year of completed melting. It goes as follows: In the
month of May 2020, North American towns & cities underwent 233 record low
temperatures vs a mere 18 record highs for the same month.
See and hear: 233 record lows in month of May 2020
In
fact: Antarctica's massive Ross Ice Shelf (the size of Spain) was
found to be crystalizing at its bottom, instead of melting in any degree
thereof. This was discovered by New Zealand scientists, and it was a decisive discovery:
See: The Crystalizing of the Ross Shelf
Incidentally, the Arctic Ocean is the exact same size as is the Antarctic Continent; 5.5 million sq miles. One more thing ::: The largest and driest desert on Planet Earth is not the Sahara. It's Antarctica.
BTW, Barack Obama purchased an oceanside mansion located at Massachusetts' Martha's Vineyard. The president who claimed that ocean levels would tragically rise is literally at an ocean's shoreline, living in luxury. And Obama cannot claim that he solved any co2-driven Global Warming problem, because co2 levels rose throughout Obama's presidency and throughout every year after his presidency. None the less, during the final years of his tenure, co2 emissions in America did decline. But, it had no worldwide effect. CO2 emissions in the United States also declined during the tenure of President Donald Trump.
In sequence, Hypocrite Extraordinaire, John Kerry, purchased an $11.75 million beachfront mansion which is also in Martha's Vineyard. It's within walking distance of the ocean shoreline. In fact, Kerry owns 18 acres of land there. The logical surmise is that Mr. I'm-Leaving-on-a-Jet-Plane apparently has no belief that the oceans will rise and cause 18 acres of beachfront property to be submerged.
In 2020, Bill and Melinda Gates spent $43 million on an oceanfront mansion in Del Mar California, doing so the year prior to them parting company and going their separate ways as much as is possible for billionaires in charge of a charity organization. Yet, Bill Gates repeatedly warns of sea level rise and the eventual submerging of shoreline property. He spent $43 million on shoreline property.
In the 1970s, there were warnings of Global Cooling and an oncoming Ice Age.
The Climate Doomsday Forecasts of the 1970s involved the conjecture that a mini ice age might be returning. The '70s involved the "decline" mentioned in the infamous Climategate emails of 2009. Very simply, it got really cold back then, and this was only 120 years after the last mini ice age ended. Refer to newspaper and magazine archives, to prove that articles were being written on the decline of temperatures throughout the 1960s & 1970s. I was there, as a young child and then as a teenager. It was cold in the Wintertime. It was really cold.
Then came the Global Warming Scare, on June 23, 1988, with James Hansen in front of the US Senate Committee on Energy & Natural Resources. The kick-off of Climate Doomsday was being announced by Hansen, such as in his prediction that the Maldives would be underwater within 30 years (by 2018). Of course, that never happened in any degree.
Moreover, Hansen ... and others ... have taken raw climate data and changed it, and in having done so, they ever so coincidentally fitted the "newly amended" climate record to their co2 warming assertions. They adjusted the numbers to fit the story line. Doing the numerical changes was called "homogenization" by those changing the temperatures. Others called it fraud. Speaking of government employees committing fraud, watch the following:
See: NOAA Gold Medalist accuses NOAA of deliberate temperature record keeping fraud
All in all, none of Hansen's predictions have come true. Now, in a 2007 deposition, with Hansen being an expert witness in the case, he "averred" (claimed) that most of the Greenland Ice Sheet will have melted by 2107, and that the sea level rise will have amounted to 23 feet. No such melting at the rate predicted is occurring yet. At present, the Greenland Ice Sheet is at a range of 6,600 to 9,800 feet high.
 |
The Earth's climate has been a cyclical roller coaster ride throughout its history.
|
If you want evidence that today's scientists are lying about the 21st Century being the hottest and the one most visited by weather disasters, go to the newspapers archives of 1871, 1878, 1896, 1901, 1906, 1911, 1921, 1922, 1934, 1936, 1954, etc. In fact, go to the 1970s archives, where an oncoming ice age was the predicted event. You will find that climate catastrophes were much more intense and more frequent in the past 80-150 years than they are today. The blame for the climate disasters was originally Solar activity, or the lack thereof. That which was blamed for those weather disasters of the 1970s was ====> Global COOLING.
None the less, if you want to learn about true atmospheric science, purchase a private pilot training course's textbook on Weather Theory.
Hockey Stick Time
If you are a youth who was enrolled in the American public school system, you were probably shown Michael Mann's "Hockey Stick Graph," without being shown any data to back up his claim of a sudden rise in global temperatures. Well, he allegedly mixed apples with oranges in the following way ===>
He allegedly first used tree ring data which actually tells the amount of moisture in the atmosphere at the time surveyed, and NOT the temperature, per se. None the less, those tree rings did indicate a decline in moisture (and presumably temps) from approximately 1960 to 1974. So, Mann allegedly stopped using the tree ring data at 1960 and allegedly substituted it with thermometer data, doing so without justifying any "benchmark" of the tree ring data to any thermometer scale. To make a long story short, the 2009 East Anglia Climategate Emails mentioned Michael "hiding the decline." Specifically, the decline of temperatures between approximately or exactly 1960 and 1974 is what was hidden.
First see: The late Michael Crichton on Michael Mann's Hockey Stick Graph
This paragraph involves the illustration located five paragraphs away: A number of tree ring scores/tallies were available to Mann. Predictably enough, he ALLEGEDLY ignored all of them EXCEPT the one with a pronounced incline, when he was morally obligated to submit as fact the average of all of the tree ring samples combined. Look at the tree ring sample YAD061. It looks like a ski slope in comparison to the nine other ones. That is what he ALLEGEDLY used for his very exaggerated hockey stick graph, in addition to him using other pieces of proxy data.
Now, in the background of Mann's hockey stick graph is the jagged "bar of uncertainty" or "error bar." That's a line that represents what the correct temperatures might possibly be, in lesser statistical probability thereof. Well, if you look at the top of Mann's jagged Error Bar at the left-hand side, you are looking at the Medieval Warm Period. And if you look at the bottom center-right of the jagged "error bar," you will see the Mini-Ice-Age of 1350 to 1850. Mann included both climate periods. He simply hid them in the background, while denying their existence in his speeches. An image of the hockey stick graph is not included herein. False graphs & erroneous charts are not permitted to be posted here.
In definitive terms, is it a complete FALSEHOOD to claim that the temperatures of the last 1,000 years were mostly stable. It's an equal falsehood to claim that the climate of the last 1,000 years was mostly mild and unvaried throughout that time span. There were intensely turbulent times, and there were distinctively different climate phases throughout the past 1,000 years. Climate is and has been a roller coaster ride. Incidentally, the coldest part of the Mini Ice Age was between 1645 and 1710. Sunspot activity was at its lowest, back then.
In recent years, Michael "Hockey Sticks" Mann filed a lawsuit against a retired Canadian meteorology professor who was once a Royal Air Force pilot. The aging Canadian man said that Michael Mann belonged in a prison, so Mann sued the retired professor for defamation, in a Canadian court.
Eventually, Mann sought to have the lawsuit dismissed. In order to agree to the dismissal of the lawsuit, the Canadian defendant promised to let the lawsuit end, on the condition that Mann show him the data that resulted in the hockey stick graph's drastic upward curve. Mann never revealed the data to the Canadian gentleman. None the less, how much apparent or pernicious fraud was committed by Mann when he was allegedly using the other alleged proxies for his hockey stick graph?
Anyway, observe Sample YAD061 below, and know that Mann allegedly used multiple "proxies," for his hockey stick graph. Incidentally, a proxy is replacement evidence for natural phenomenon. The prime example is the tree rings which are used to determine temperature at a certain time in history. All in all, Mann still refuses to share his hockey stick graph data.
The Al Gore Science Fiction Movie #1
Concerning the co2 & temperature graph that Al Gore showed the audience at the beginning of his first movie, he neglected to say that a rise in atmospheric heat will cause an added amount of co2 to be released into the atmosphere via oceanic evaporation. In fact, it's a well established scientific teaching that the water vapor above the oceans is latent heat.
Now, a prime example of this phenomenon, where the rise in co2 follows the rise in heat is in a recent research finding about the end of the last Major Ice Age (aka "the last glaciation.") It was found that the heating at the end of the last Ice Age actually began at the bottom of the oceans, with the heat rising to the ocean surfaces. The time it took for the heat to rise to the top of the oceans was 1,300 years, according to the paper's authors/researchers. Then, and only then did co2 levels begin to rise. Therefore, in the natural history of the Earth's most recent 650,000 years (or "time units"), temperatures always rose first, and then the co2 levels followed. The changes in co2 levels throughout that time were not at all pronounced, compared prior eons of time. They were relatively small changes.
See: Univ of Southern Cal: CO2 did not end last Ice Age 🌿🌿🌿🌿🌿🌿🌿
A British Court Had Its Say About Gore's First Science Fiction Movie
In that first Gore movie, there were 9 assertions contested to be falsehoods in a British court. The British court ended up adjudging that the Al Gore movie could not be presented or advertised as educational material in England. One of the assertions was that a rise in co2 levels caused Lake Chad to dry out. Super fraudulent was that assertion. Observe ===>
Dispelling the Lie that Al Gore Told About Lake Chad, in His First Science Fiction Movie
Lake Chad is located directly below the massive Sahara Desert. Thus, Lake Chad has very little ground water or water shed "tributaries." The Sahara doesn't provide much rain, either. Furthermore, Lake Chad is a shallow lake, and its water capacity is much smaller than Lakes Tanganyika and Lake Victoria. Observe:
Lake Chad's water volume capacity is 17 cu mi ... vs Lake Tanganyika's 4,500 cu mi capacity ... vs Lake Victoria's 660 cu mi capacity. This means that Lake Tanganyika's water capacity is 264 times greater than Lake Chad. Lake Victoria's water holding capacity is 38 times more than is Lake Chad.
Moreover, it was only the northern lobe of Lake Chad which dried-out in intervals of time throughout the 1970s and 1980s; not the entire lake. Do
you see what a liar Al Gore has been, while he was amassing
approximately $250-350 million into his own bank accounts and/or financial portfolio?
One more point about Gore's first science fiction movie is this ::: It involves Gore's claim that atmospheric co2 first rose, followed by temperatures. Well, if that is the case, then what caused those co2 levels to rise, in the first place? There were no coal plants, no factories, and no combustible engines. Hello? Anybody home? To claim what Gore claimed is equivalent to claiming that a steering moves the driver's hands.
More on Gore
In his second movie, Al Gore claimed that his prophecy about (Lower) Manhattan being submerged under water came true. He showed a video clip of the very temporary storm surge of a certain tropical storm. After the storm surge ended, no Manhattan concrete was underwater. Go to NYC today and see for yourself, if whether or not sea level rise has encroached itself on Lower Manhattan's roads and sidewalks.
Deception through the Help of the Media
Now, Hockey Stick Graph Maker, Michael Mann, told a newscaster that today's co2 levels must be cut in half within ten years. Well, if that's done, the Earth's atmospheric co2 level will even be lower than it was when cavemen (or cave women) were giving art exhibitions at their cave walls.
Caveman co2 levels were at 260 ppm. By the Year 1800 or so, the co2 level was at 280 ppm. Mann is prescribing a level of 209 ppm. In as much, this indicates (in my opinion) that Mann is deliberately marketing fear, in order to get all the more taxpayer dollars & NGO grant dollars into his bank accounts and financial portfolio. It's called Theft by Deception. This is what the US Federal False Claims Act was enacted to undo. And upon me stating this, I advise you to keep in mind the Times vs Sullivan First Amendment Case, where it was adjudicated that a private citizen may publish his opinions of a public figure.
If atmospheric co2 levels drop below 150 ppm, no photosynthesis could transpire, and plant life dies. Plus, we have a heightened population today, meaning that we need greater crop yields. Thus, we need more plant food. In as much, CO2 is the plant food needed in higher levels today. So, what is Mann thinking? All in all, if you want to go green, you must increase co2 levels.
Incidentally, the billions of taxpayer dollars that were unleashed were unleashed under the title, Climate Change Adaptation and Climate Change Research. Moreover ====>
In the Climategate Emails of 2009, it was discovered why the title "Global Warming" was changed to "Climate Change." This is because there had been NO Global Temperature increase in ten years. Being that there was no global warming, the scientists had to change the name of their project, in order to deceive you and everyone else all the more.
As a fact, if there is no increase of temperature in the Middle of the Troposphere, there is no Global Warming. There was zero increase of such temperatures from 1999 until 2016. Somewhere within the same general time span, the United States went 12 consecutive years without a major hurricane making landfall on any of its shores. Thus, the opposite of Al Gore's hurricane predictions resulted.
 |
The majority of water content in every ocean (except the Arctic) exists at 39 degrees Fahrenheit.
|
As far as goes the atmospheres on Venus and Mars being almost entirely composed of co2, it simply proves that there is no life on those planets. Life dines on co2.
The most important thing to do at present is to go through newspaper archives of the past 80 to 150 years, and locate reports on the heat waves, fires, record rains, floods, hurricanes and other natural disasters which occurred during that time. It was a time when co2 levels were distinctively lower than today.
Locate and read the November 1922 edition of Monthly Weather Review, wherever you can find it. All of the aforementioned becomes the evidence which proves Climate Change activism to be a fraud. It's all a money grab for taxpayer dollars ... and NGO dollars.
Next go through 1970s newspaper and magazine articles that spoke of a coming mini-ice age. Yes, even though co2 levels had risen, the 1960s & 1970s were times of a lot of painfully cold weather. Thus, the 1960s & 1970s proved invalid and fraudulent the claim of Al Gore, John Kerry, & company
Arctic Ice volume reached it height in 1979. This is why Global Warmists omit the ice volume facts of the 1970s, even though there was satellite technology dating back to approximately 1974 or even sooner. They simply begin their charting in 1979, the year of the highest amount of ice, so that the succeeding years will be made it look as if the world is now melting away like never before.
They omit the 1970s Arctic Ice Volume statistics as much as they omit the 1920s & 1930s forest fire stats If
they let you know that ice volume rose while co2 rose, then the Al Gore
CO2 Warming Model of Science is defunct, invalidated, and found to be
historically false.
In addition, you will find the stumps of rooted trees near the Arctic Ocean. Moreover, Iron Age skis were found under permafrost that had melted. This means that there was a time when there was no permafrost there. Climate is cyclical.
So, go to the newspaper & magazine archives. You will discover how much you are being deceived on a major, expensive, and immoral scale. You are being used as a Useful Idiot ... by other idiots who have no idea what life & essence is all about.
To all of you Climate Doomsayer computer modelers out there, in order for you to have a clear insight of climate, you need to do something called, "Go outside."


 Deaths due to natural disasters mercifully plummeted greatly in the 1970s. The trend continued, even into the 2010s. The 2020s, of course, have only just begun.

 c
c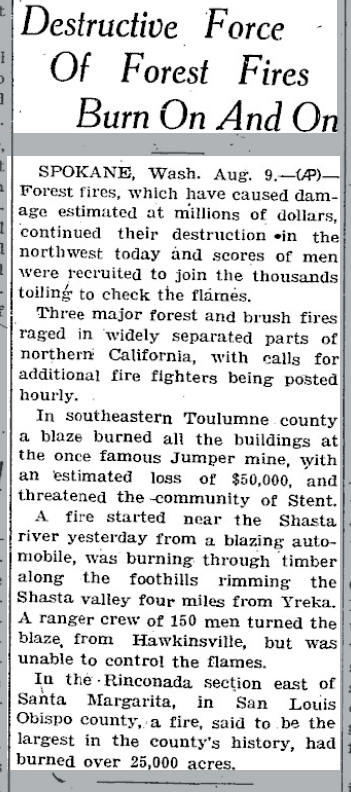
.png)


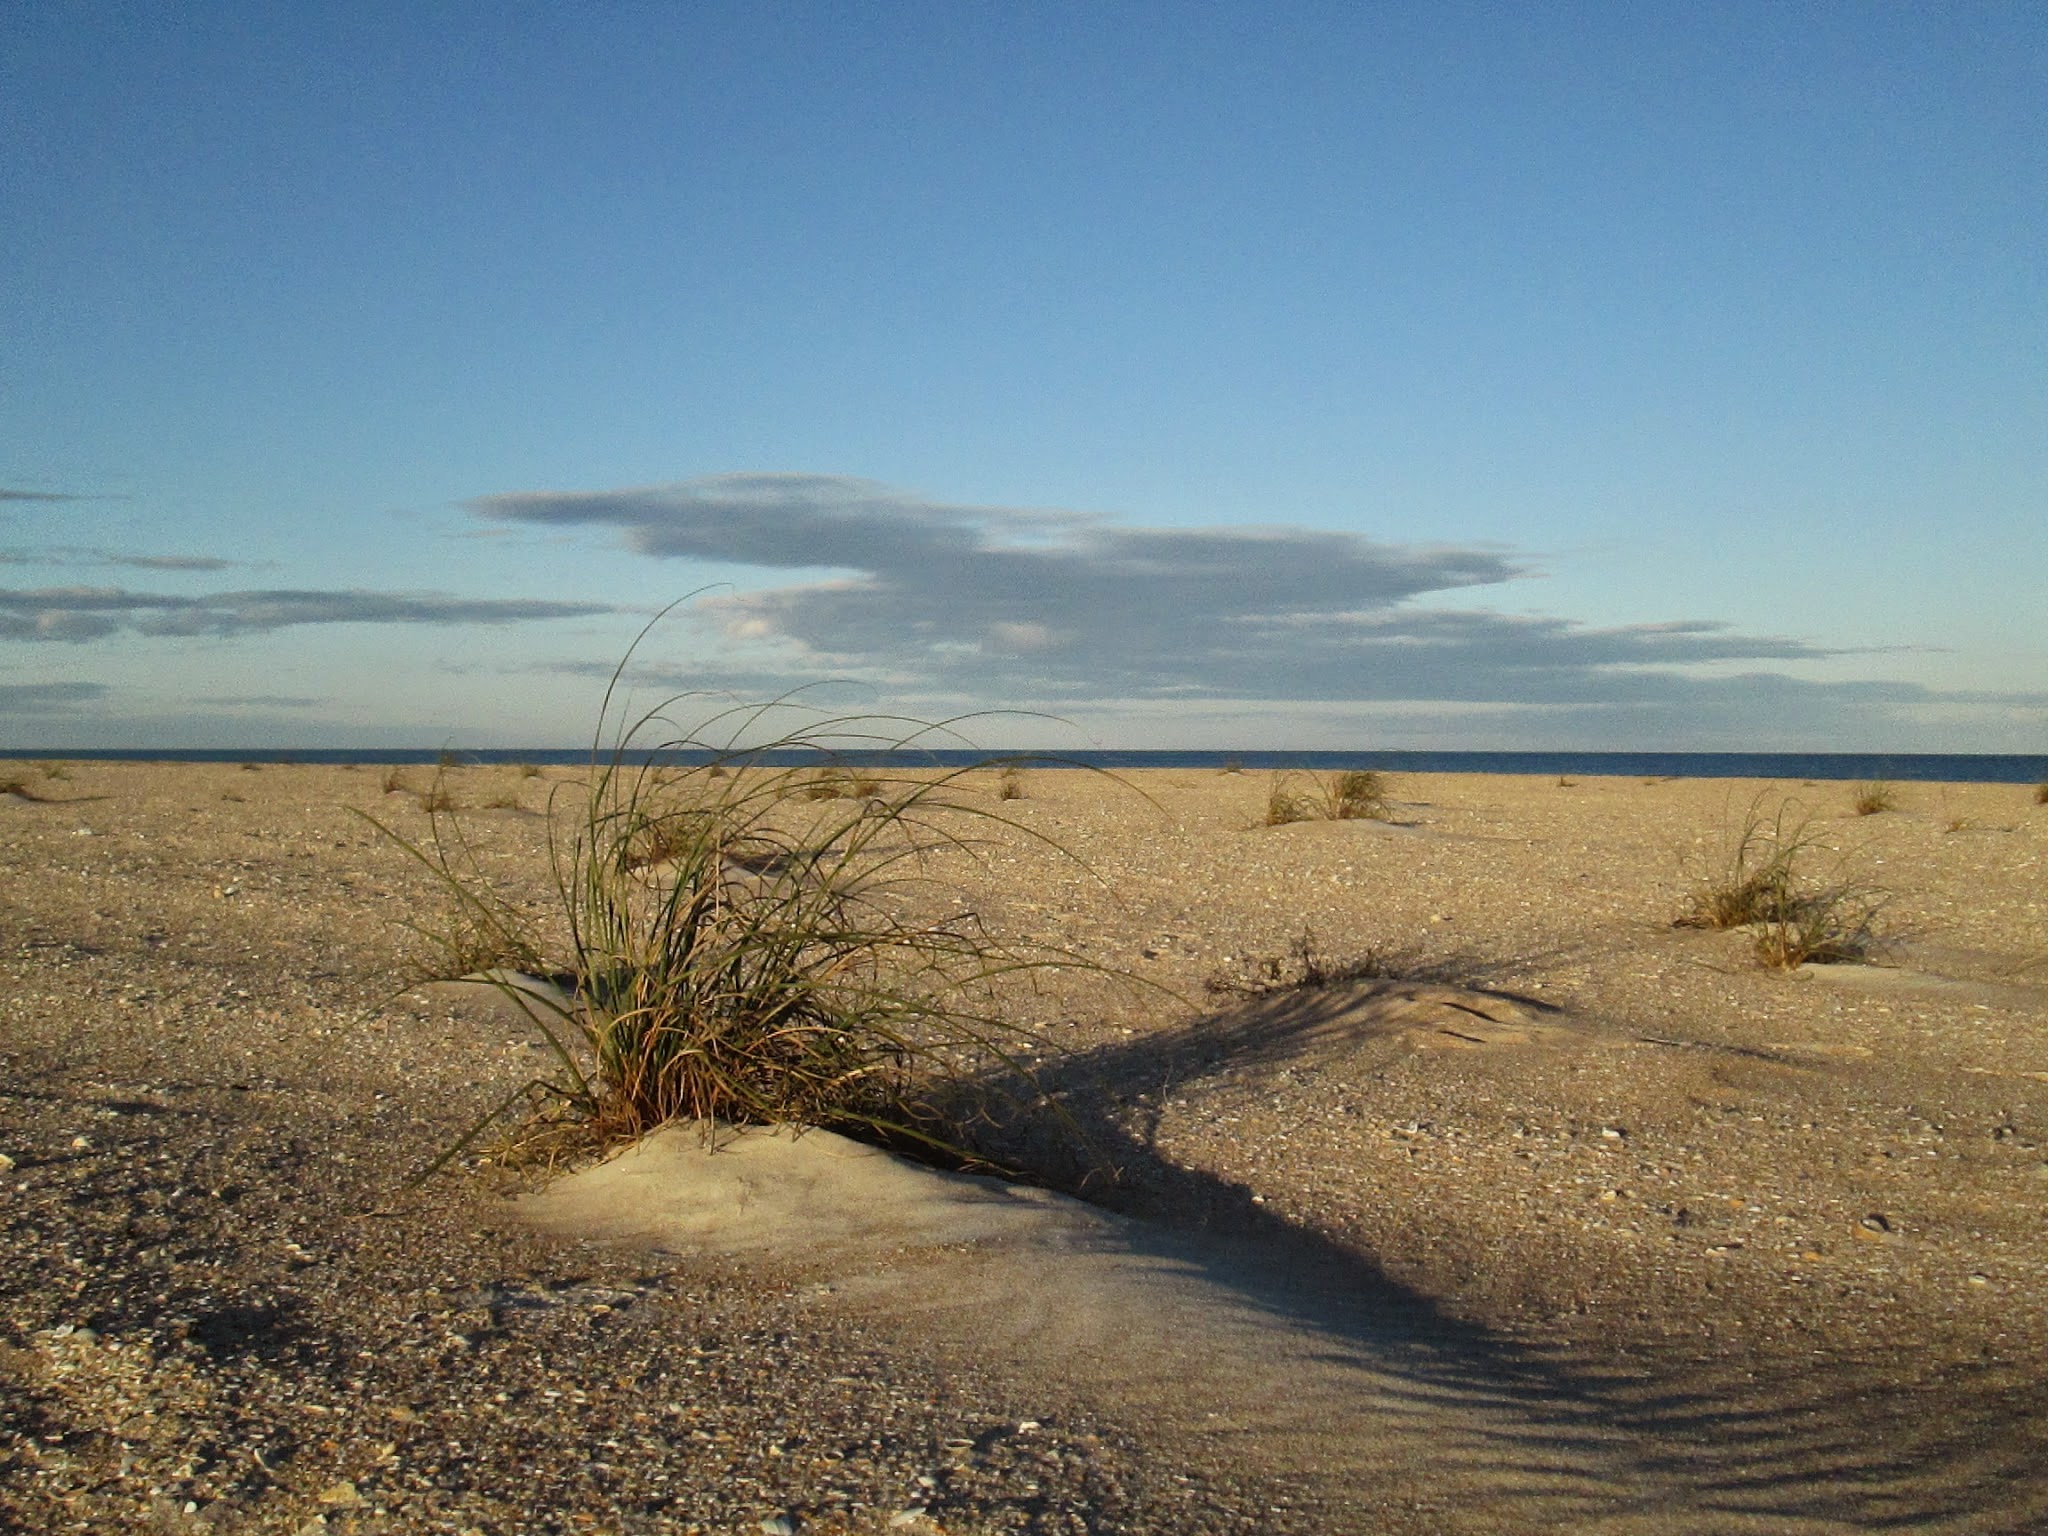


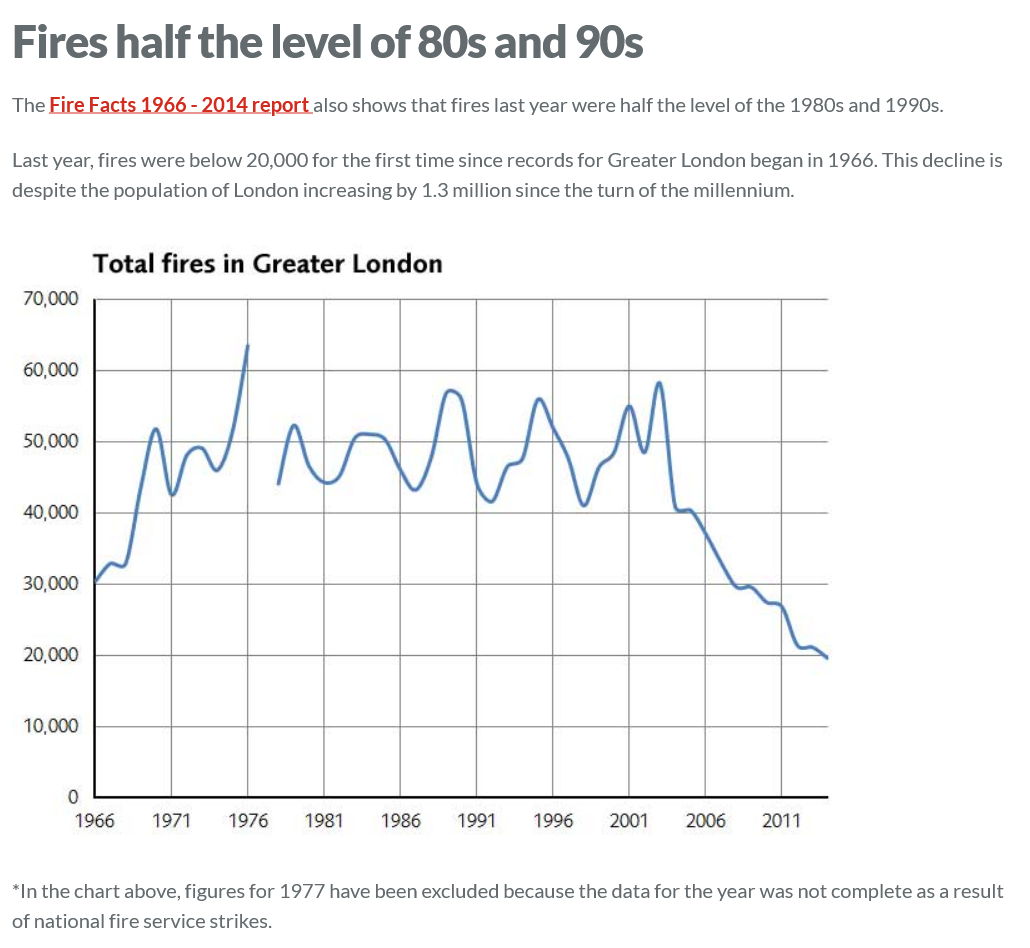
.png)


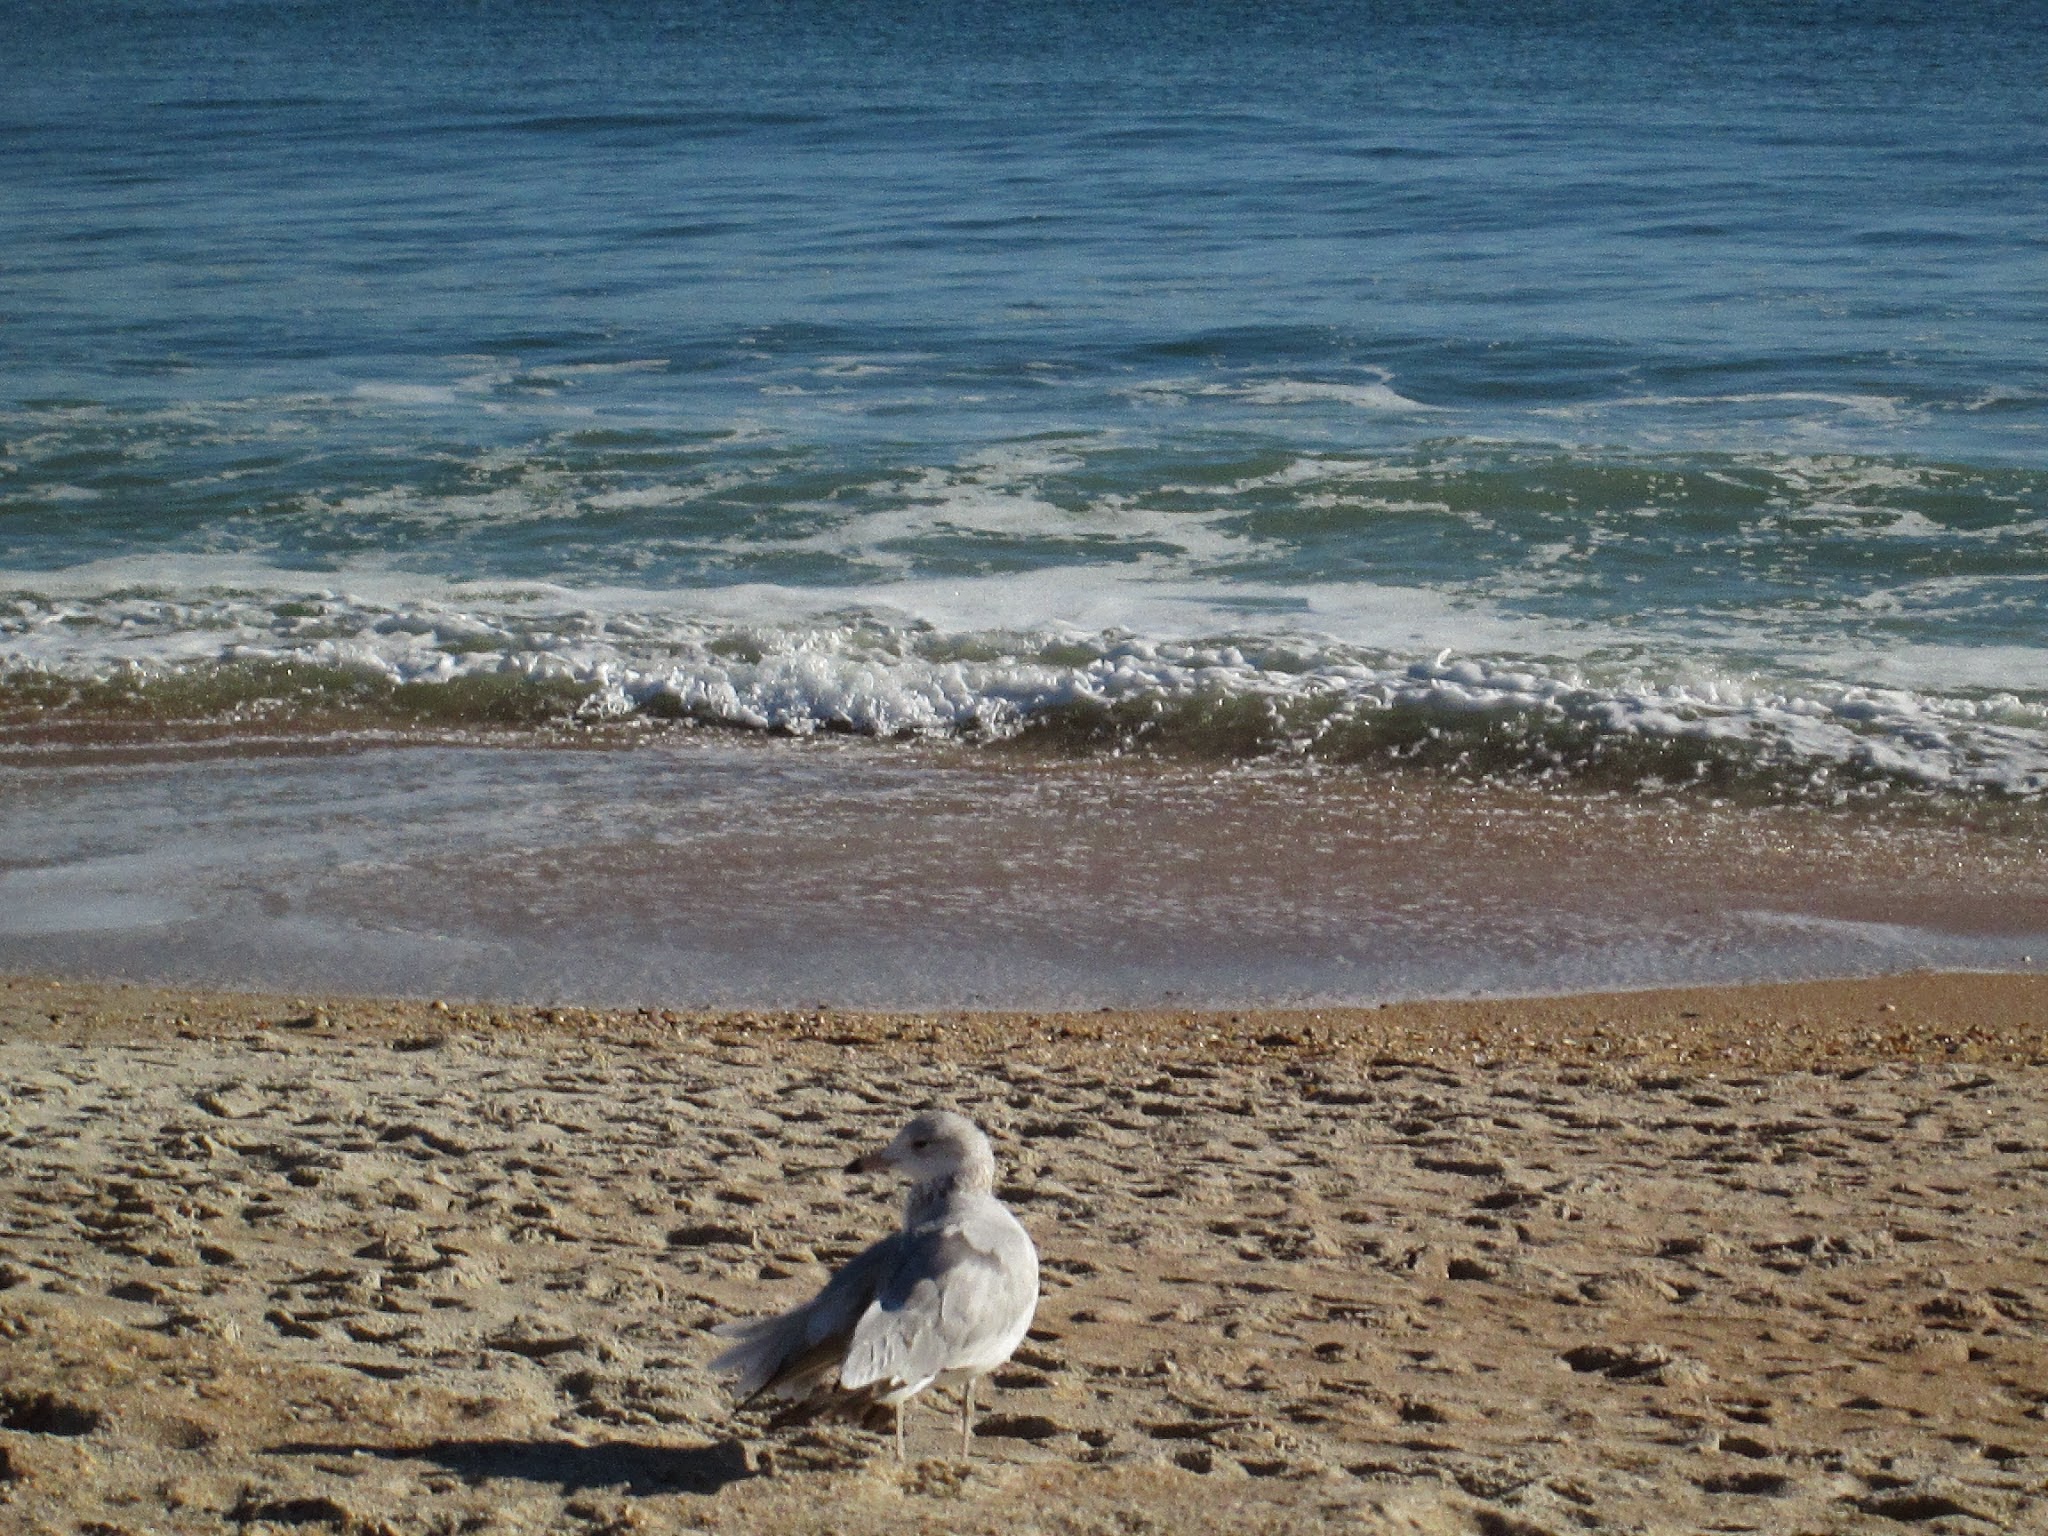


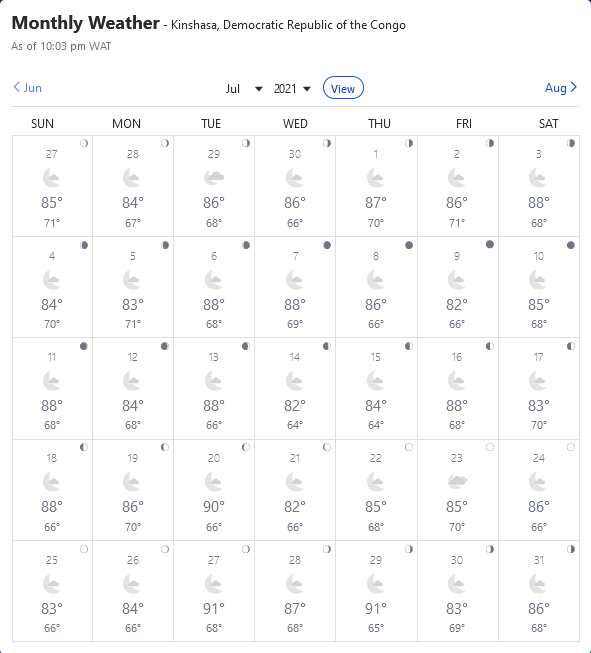


%20Anvers%20Island.jpg)