Within: [1] Atmospheric Science & Weather History. [2] Synthetic Chemicals & the illnesses they cause. [3] Economics, [4] Politics, government, & law, [5] military science & history, [6] Landscape & City Photography, as well as some deep image poetry, for the psychedelic visionary in you.
March 8, 2025
To exaggerate is to lie, Part 1 --- Come and review twenty-five newspaper heatwave reports, published 86 to 147 years ago, when the outdoor CO2 level was quite low.
March 7, 2025
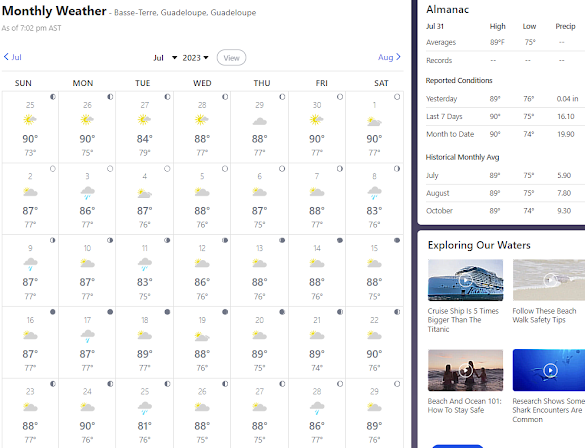
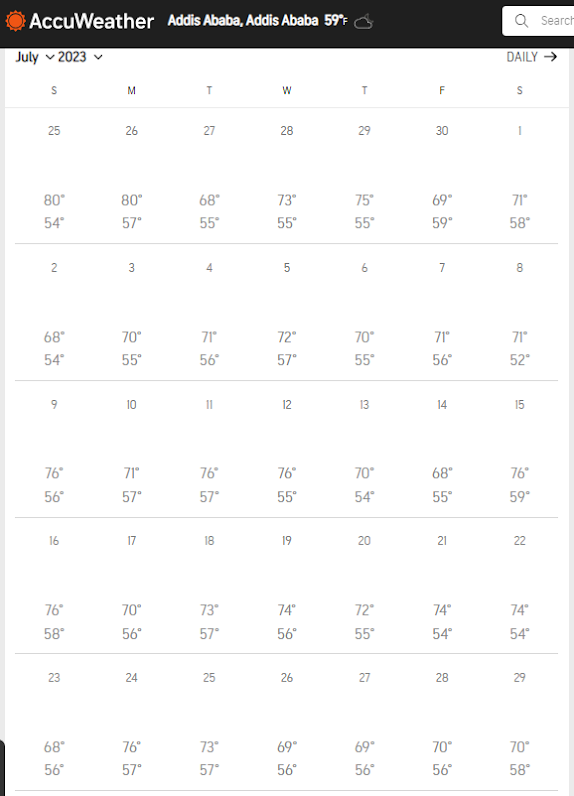
To exaggerate is to lie, Part 2 --- Come and examine the temperature charts of July 2023, for 24 various cities.
Note: Cities which do NOT have well established long-term monthly average temperatures will not be used here. Such cities were not modernized in the 19th and mid 20th Century. They do not have a long-term temperature record, due to the absence of any kind of weather station. Thus, you can't compare today's temps with temps in the mid 20th Century and 19th Century, at those particular cities. The needed data is absent there.
[1] Let's begin with Mexico and its capital city. The common citizen assumes that all of Mexico is blazing with heat every summer. This is especially the case, being that the UN Gen-Sec claims that we are now in the phase of "global boiling." Therefore, if July 2023 is the hottest time in the past 125,000 years, then the summer would be much hotter in Mexico City, and there would be a few 90F temps charted below, along with a couple 100F temps.
The hottest July 2023 day in Mexico City was 82F. Well, take a look below at the Mexico City temperatures for July 2023. Oh, and by the way, the average July high temperature for "hot-hot" Mexico City is . . . 74 Fahrenheit ... which happens to be 23.33 Celsius.
A few July "heat-anomalies of eight degrees higher-than-average in the middle of Summer does NOT constitute Global Boiling. This is especially the case when the temperature is no different than a typical summer's day in Pittsburgh. No end-of-the-world heat is to be found here. No Global Boiling, folks. Time to move-on.
******************************************************
March 6, 2025
To exaggerate is to lie, part 3. Come and view the list of megadroughts that occurred when the Atmospheric CO2 Count was much lower than it is today.
Background: Michael Mann and David Attenborough both asserted in varying venues that, for the one thousand year period preceding the start of the Industrial Age, Planet Earth's Climate was mild. That is a complete lie. There was much climate turbulence & many years of drought, along with heatwaves, throughout that one-thousand year period. Add floods to the turbulent storm inventory, also.
Now, that period of time was when the atmospheric CO2 level was much lower than it is today. In fact, from the Year 1000 to the Year 1825, the atmospheric CO2 level did NOT rise above 284.3 ppm. The fact that there were many natural disasters during that time-span disproves the Al Gore & Michael Mann Theory of Climate which claims that a rise in CO2 causes more natural disasters. So, compare the Year 1000's 280 ppm to Feb 1, 2025's 426.35 ppm. Compare
The truth is that, if you ever open an Atmospheric Science textbook, and turn to the Pressure Gradient Forcing pages, you will see that it's during cold spans of time when atmospheric turbulence increases. This is an element of "baroclinic" instability & stability. "Baro" means pressure. Thus, air pressure is a pivotal co-driver of temperature and/or air turbulence and/or air direction.
And of course, the greater the difference between the pertinent low pressure air mass and the pertinent high pressure one, the stronger the wind will be. In addition, the involved spirals of wind will move clockwise around areas of high pressure in the Northern Hemisphere, and counter-clockwise around areas of low pressure.
I've already addressed this elsewhere, at the Blue Marble Album. The bottom line is that weather will be more turbulent during global cooling phases than during warm ones. After all, the Little Ice Age had disastrous weather events, as did the years following 536 CE. The evidence is that Al Gore failed when he predicted ... from 2006 to onward ... that hurricanes will get stronger and cause all the more damage. There is still no such thing as a Category 6 Hurricane in the Atlantic Ocean.
Moreover, there is only 0.042% of CO2 in the outdoor sky. 99.96% of the Earth's atmosphere is Nitrogen, Oxygen, and Argon. CO2 doesn't have the volume or size to have any effect on an entity as huge as Planet Earth's atmosphere. CO2 affects flower after flower, tree after tree, grape vine after grape vine individually, one at a time, many times simultaneously. CO2 brings forth gardens, orchids, and wheat fields; NOT massive natural disasters. So, we proceed:
When you go back further in history, you will see that there was an intense British Isle drought from 1765 to 1768. In fact, twenty prior, France had a devastating drought in 1788. The nation would never be the same after 1789. None the less, the CO2 level was very low at the time, at 278 ppm. In continental Europe, there was a drought in 1718 & 1719. The same CO2 level was there.
There were famines in the same British Isle region in the 1690s, as well as in 1622. Before this was the 1616 Drought which affected London and southern England. The Tudor Drought of 1540 was the epic one, as well as.
Concerning the CO2 level, in 1545, the level was 283 ppm. Then came a constant and gradual decrease until 1615, when the CO2 level dropped to 275.5 ppm. The CO2 level in the centuries to come would not go lower than the 1615 level, making 1615 the lowest CO2 year in the past 410 years. Yet, in the following year ... in 1616 ... there was a drought which made history. Thus, a low CO2 level does NOT protect you from natural disaster.
The Elbe River Hunger Stones have markings for each of the drought years of the Czech & German terrain dating from 1417 to 1893. The Elbe River hunger stone markings are in Děčín, a Czech town closer to the German town of Dresden than to the Czech town of Prague.
The years of drought are marked as 1417 (faintly), 1616, 1707, 1746, 1790, 1800, 1811, 1830, 1842, 1868, and 1893. None of it is "proxy evidence," as are tree rings and cave walls water marks. It's all witness testimony. However, a person or a crew can investigate the years mention, and search for proof or disproof of the hunger stones' validity. Incidentally, the Year 1616 definitely passes the test. As far as goes 1790, there was a drought in India, called "the Great 1790 to 1794 El Nino." Moreover, in 1791 a number of droughts developed in different parts of the world, including New South Wales, in Australia.
In fact, tree-ring reconstructions show that, in 874 CE, Western & Central Europe endured hideous drought conditions ... all when the CO2 level was really really low. Observe:
Above: Posted pursuant to 17 USC 107, the Fair Use Act.In each instance, the outdoor CO2 level was very low ... too low to have caused the droughts. More precisely, from the Year 1000 to the Year 1814, the outdoor CO2 level did NOT exceed 275 to 284 ppm, with the majority of time pinpointed at 280 ppm.
It wasn't until 1851 when Planet Earth reached a CO2 level of 285 ppm. It was not until 1912 when CO2 reached the 300 ppm. As for the 330 ppm mark, that occurred in 1975. The 350 mark was reached in 1989, and the 400 ppm mark occurred in 2015.
Moreover, when Joe Biden took office in January of 2021, the CO2 level was 415.51 ppm. When he left office, on January 20 of 2025, the CO2 level was 426.74 ppm. The Biden-Harris presidency was supposed to be the presidency that was going to significantly reduce atmospheric CO2. Rather, Biden & Harris did what it took to get the atmospheric CO2 level to skyrocket, proving that particular administration to have been the most incompetent administration in the history of the United States.
Under four years of Biden & Harris, the CO2 level rose 11.23 ppm.
Donald Trump began his 2nd term on January 20, 2025. After Trump was in office for merely 15 days, the atmospheric CO2 level decreased 0.46 ppm ... for whatever reason, even if only luck. See for yourself:
Climate activists claim that 300 to 330 ppm of CO2 is the "safe zone." So, anything from the beginning of civilization to 1912 (300ppm) or 1976 (329ppm) ... and maybe only up to 1949 (310ppm) ... were fine and acceptable times to these activists. Well, here's a newsflash:
A human is fine when CO2 is at 1,300 ppm, 1,600 ppm, and even 1,900 ppm.
Droughts of Centuries Past
March 5, 2025
The cause of Leeward mountain-side deserts, such as are in California
 |
| New Mexico mountain top, 2012. The clouds did stay on one side of the mountain range. |
Before all else, American and Mexican deserts not immediately east of a mountain range became deserts, due to the "North Pacific High." This happens to be a semi-permanent, subtropical, high pressure air mass that rotates clockwise. Its altitude reaches up to the middle of the Troposphere only. It's latitude is equal to that of Northern California and Oregon. Yet, it's a large rotating air mass.
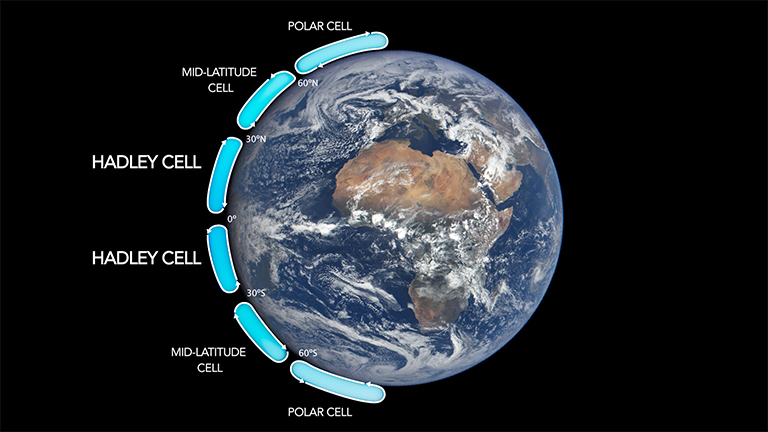
Also needed to be mentioned is that the 30th Parallel, in the northern and southern hemispheres each have a convection cell which features dry, relatively-heavy, & sinking air. This is why major deserts are on or near the latitude. Incidentally, sinking air is called "subsiding' in meteorology.
Then comes deserts featured by "Santa Ana Winds," aka "Chinook Winds," aka "Foehn Winds." All three winds are the exact same thing. Let us proceed.
~ ~ ~ ~ ~
a} That which is called the result of "global warming" is actually the result of Adiabatic Heating which occurs on the the Leeward Side of mountain ranges; mostly the east side.
This is because, as clouds rise, the Western side (aka the Windward Side) of a mountain range, they
release moisture during the ascent. This is known as the process of
Orographic Lifting. This lifting of a cloud mass accompanies the
release of rain as the clouds' ascent continues. By the time the same
air mass reaches the top, all that is left is a cold & dry parcel of
air which descends the mountain range, thereby creating deserts.
There is the matter of heating which occurs during the air parcel's
descent.
b}
The dry air parcels which descend mountain tops are called ::: ~Foehn
Winds, ~Chinook Winds, ~Santa Ana Winds, & ~Down-sloping Winds.
As a dry air parcel descends a mountain top, it encounters higher &
heavier pressured air which easily exists at the surface of the Earth.
As a result, the down-sloping air compresses and shrinks in size. This
causes the molecules within it to collide and vibrate more aggressively,
resulting in a sudden rise in temperature.
c1a} Proof that this dryness is the result of Adiabatic Warming, and NOT co2, exists in the fact that, when you are out West, you notice that the clouds in the sky never cross over the mountain tops. The clouds stay on one side.
c1b} Incidentally, I'm the son of a native Wyoming gal. In fact, I have literally been at the southernmost tip of the Rocky Mountains, in New Mexico. I witnessed it. I was there.
 |
| Yes, this was the city of the Project Y laboratory; part of the Manhattan Project. |
 |
| New Mexico, as scene through my cell phone; from a road to Los Alamos. |
 |
| Also New Mexico from my cell phone. Notice that the clouds remain on one side. |
 |
| This authentic mushroom cloud was photographed on an August 6, near Los Alamos. |
c2} Examples of deserts created by Adiabatic Heating ::: The Red Desert of Wyoming is in the center south of the State. Plus, the center of Oregon has a desert located east of the Cascades and south of the Blue Mountains. The Leeward Side of California is desert land extraordinaire, and it was that condition long before 21st Century co2 levels increased. Etc go the examples.
c3}
Plus, the super large deserts of the Earth are all on the 30th parallel
(north & south) wherever the desert was not the result of Leeward
Adiabatic Warming. 30th Parallel deserts were caused by very large
"convection cells."
Example ===> The Sahara Desert is the size of the USA, and 6,000 years ago the Sahara was a lush forest/jungle, with cave wall drawings that looked like the ones in France. This time span is known as the African Humid Period. There were no gasoline engines to turn the Sahara into a desert. It was a major convection cell at the 30th Parallel that caused it. The super large convection cell still exists. It's presently called the Hadley Cell of the Northern Hemisphere.
When viewing Globes or spherical maps of the Earth, do not forget the 23.5 degree tilt (aka obliquity) of Planet Earth.
 |
| Take note: In older textbooks, "Mid-Latitude Cells" were called "Ferrel Cells." |


