July 5, 2026

The Heat Island Effect & Asphalt: Absorbing solar radiation at the surface

Chicago:  The huge asphalt maze.  Yet, I stood outside here, during -7F and -11F Arctic Nights.

From the telescope data analysts:   The Earth's lower Tropospheric temperature anomaly for July 2022 was +0.36C.  (Anomaly means deviation from the normal.)  The commercial media placed July 2022 in neon-lights, and then proceeded to put it in a false light.

Of course, the multiple temperature measurements of the lower Troposphere aren't the proverbial tale of the tape.  When  it comes to monitoring the atmosphere for the presence or absence of actual Global Warming, the following rule applies:

"If there is no temperature increase in the Middle of the Troposphere, then there is no Global Warming." 

Moreover, there is a difference between surface temperatures and air temperatures.  None the less, we now direct our attention to surface temperatures in the modern world, being that it can be a health issue, as was the repeatedly tragic case in France, during 1976, 2003, & 2019.

The middle of Earth's Troposphere is approximately 30,000 ft in height, except for the Poles where it's half as high.

So, what is providing the added heat to the cities during Summertime?

ANS:  The great solar radiation absorber, asphalt.  More specifically, the Heat Island Effect and/or Heat Sink Effect.  So, add to the effect the heated exhausts of air conditioning units.

~Now, the July 2022 hype about London has been easily proven a farce, in light of the fact that the 610 sq mile area known as Greater London has been having almost half the fires it experienced in the 1980s and 1990s, as well as far less the number of fires that transpired in the mid-1960s.

~The Southwest of the United States is a desert and does have a history of naturally occurring long-term droughts. 

~Lake Superior had near record cold temperatures during July 2022.  See:  Lake Superior near record cold in July 2022

~Throughout South America, there has been record cold in 2022, including the coastal nation of Uruguay.   Throughout South America in 2022, there has been record heat, including the coastal nation of Uruguay. 

~Patagonia (the Southern half of Argentina) was reported as having record heat in 2022. The same Patagonia was reported as having had record cold in 2022.   This is when you toss up your hands and say, "What's the point?"  

Okay.  Time-out, for a Review

The Year 1936 had the hottest Summer in the known history of the United States, and according to NASA, 1934 was the worst drought in 1,000 years.  This was when co2 levels were 310 ppm, meaning that they were 108 ppm LOWER than today.

The highest temperature ever recorded on Planet Earth was recorded in 1913, at Death Valley's Furnace Creek, California.  It was 134F there, and co2 was 301 ppm at the time.   That was 117 ppm less than today.  

The longest heat wave of consecutive 90+F days transpired in New York City in 1953, for 12 consecutive days.   The co2 count at the time was 313 ppm.  This amounts to 105 ppm LOWER than today.  So, where is the causation (or even the correlation) of co2 levels in the surface temperature records?  ANS:  It went out the door.

In fact, the second most severe heat wave & drought was the Great Tudor Drought of 1540-41.  This occurred when co2 was at pre-fossil-fuel levels.  

Meanwhile, the Great Drought of the American West occurred between 1276 and 1299 C.E, when co2 levels were as low as they were during the Roman Empire years of carts, chariots, and cavalry units.  Thus, co2 is not lighter fluid.  Nor is it a Roman Candle, pun intended.

The 16th, 17th, & 18th Centuries, as well as the first half of the 19th Century were centuries of turbulent --- and then scorching --- and then flooding --- climate conditions.  Add crop failures and ice stacking to the list, as well as the Thames River Frost Fairs.  And then came entire military fleets being decimated in massive sea storms, during that time span

All in all, it is a complete lie to claim that the past 1,000 years were years of mild weather.  The entities pushing this lie should be sued for fortunes worth of compensation.   After all, why do you think Northern Europeans and American colonists were putting woman after woman to death, for witchcraft?   Well, it had to do with the outrageously unsettling weather.  But, it had nothing to do with fossil fuels.  People in NORTHERN EUROPE thought that witches were changing the weather for the worse.

Despite the long historical records which do show that there's NOT a historical correlation between co2 levels and surface temperatures, the climate change marketeers will always claim that the hottest and worst weather had transpired last month --- and that we're all gonna die in the next 5 to 10 years, if we don't drastically reduce co2 levels now. 

This is the Five & Dime Store Doomsday Script, and it has been ongoing since June 1988.  It's beyond tiring to hear this, due to the repetitively failed doomsday predictions of the past 34 years which keep being predicted anew, with the designated dates of doom being pushed back to the next 34 years.

It's definitively true that the predictions of climate doom never came true.  After all:  {1} the Maldives are very much above water with financially fit Arabians enjoying the premises.  {2} No coastal city has gone even halfway underwater.  {3} Your shoes are still dry after walking throughout Lower Manhattan, and {4} You still can't go water skiing in the Summertime Arctic Ocean without you crashing into 1.3 million to 1.9 million square miles of ice.

And remember, the Global Warming, End-of-the-World hysteria was ratcheted-upwards only because Joe Biden took up residency at 1600 Pennsylvania Ave.  It's an advertising gimmick.  After all, in 2021, throughout Biden's first year, fanatical doomsayer announcements were repeatedly being published.

Moreover, neither China nor India nor often frigid Russia are going to try to reduce co2 levels.  Even if you wiped North American off the map, the co2 levels would still rise pursuant to Chinese, Indian, and Russia industrial output.  So, nagging and punishing Americans would NOT work, if it mattered that co2 levels were rising.

The Climate Change Pitch is a Sales Pitch

As a note, American sales managers teach their new employees that, when you are trying to make a sale, you are to create a sense of URGENCY in the prospective buyer.  So, climate change activists are simply trying to make a sale.  However, American workers who spent decades working outdoors don't buy the Climate Change hysteria.  They are experienced in experiencing all sorts of climatic conditions.  And they realize that climate per se is ......... cyclical.

It even got to the point where the Climate Change salesmen blamed snow on man-made co2 and Global Warming.  As I previously explained, a water molecule will stay in the atmosphere for approximately NINE days.  Any January snow storm that comes 182 days after a humid July heatwave is NOT caused by that July heatwave.  And concerning the oceans warming, the majority of ocean water is dark & 39F.  That's all.

It's now the Summer of 2022.  A hundred years prior were news reports of a detailed Arctic meltdown.  The heat of the prior year, 1921, was a contributing factor.  

Other dreaded heat years near that time span included 1871, 1878, 1895, 1896, 1901, 1911, 1913, 1922, 1931, 1934, 1935, and 1936, as well as 1947, 1988, 1998, 2012, and 2016.   All in all, climate is cyclical.  To claim today to be far worse than decades prior can be easily disproved.  Let's take China's weather history as an example.

In the "table" of China's worst natural disasters, six are Earthquakse.  They are NOT applicable in this discourse.  There are two epidemics which don't apply, unless a melting Arctic Circle is involved.  This leaves us with 17 natural disasters.  

View the year of each disaster, and take account of the much smaller atmospheric co2 content than exists today.  Then take note of the death tolls, and remember what the U.N. stated in September 2021.  The Chinese death tolls contradict what news writers and certain U.N. people were claiming.  Chinese disaster years included 1906, 1909, 1911, 1922, 1930, 1935, 1939, 1949, 1954, and 1959 being the most recent intense disaster year.  The co2 levels of these years ranged from 298 to 315 ppm.  This is 102 to 120 ppm lower than today.  This would serve as prove that a rise in atmospheric co2 does NOT automatically cause intensification of disastrous weather events.

This brings the reasonable person's thoughts to the Eleven Year Sunspot Cycle --- which is not to be confused with relatively stable solar irradiance.

We begin with 2022.  Eleven years prior was the July 2011 heatwave marked by high humidity.  The following year was the Drought of 2012.  Therefore, if the Eleven year sunspot cycle has any causation or correlation to it, then 2023 should be another year with a notably hot summertime.  A cooling should be evident in 2025 or 2026, IF ...

Eleven years prior to the 2012 Drought was the 2001 Eastern North American Heat Wave which even saw Nova Scotia reach 95F.  Meanwhile, New York's Central Park reached 103F.  Moreover, the co2 count that year was 371 ppm; 47 ppm LOWER than today.

Eleven years prior to 2001 was the final year of the 1988 to 1990 North American Drought.  The co2 level was 351 ppm; 67 ppm lower than today.  

Eleven years prior to the 1990 drought was 1979. Well, one year after 1979 was the 1980 United States Heat Wave which took 1,700 lives.

Next comes eleven years before 1979, namely 1968.  Well, in 1968, there was the dustfall thunderstorms in 'Britain'; the worst in 200 years.  It comprised a layer of mineral dust that came out of the Sahara and found its way to England, much like the temporary heat of mid-July 2022.  

Also in 1968, there was a January hurricane that made landfall in Scotland.  It reached a speed of 134 mph.  The co2 level at the time was 321 ppm; 96 ppm lower than today.  If that hurricane would have happened this past January, we would never have stopped hearing about it from the Climate Change Activists and the commercial media.  Sirens would have gone off, in concert.

The year prior, in 1967, a heatwave took 70 lives in Mexico City, and Seattle had its longest heatwave, equaling the New York City heatwave of 1953.   

Next comes eleven years before 1968,  namely 1957.  Subtract another eleven years and you also have 1946.  Well, from 1947 to 1957 was Texas' worst drought.  In fact, 1956 was Texas' second driest year on record at the time.   The CO2 level was 310 to 316 ppm during this time frame.  More than 100 ppm less than today.

Also in 1957 was NYC reaching its record high temperature, and Kentucky having a devastating flood, much like in the Year 2022.  History repeats itself.

Eleven years before 1957 was 1946, and it was the year of the Heat Wave in Rome, and the Drought & Famine which hit Moldavia and the Ukraine hard.

Eleven years before 1946 was 1935, and it was especially disastrous a year.  There was the Black Sunday Dust Storm, for starters.  All in all, 1934, 1935, and 1936 were absolute weather disaster years.

https://stevengoddard.files.wordpress.com/2014/01/bcb1exvccaa0ttl.jpg?w=640?w=429

 
1935 - 124 Degrees In India, 23 Inches Of Rain | Real Climate Science

The aforementioned things are historic fact.   There is correlation in this Eleven Year Sun Spot Cycle.  But, is there causation to the aforementioned coinciding events?  Or is it just a matter of statistical probability?  Is it simply a matter of there being so many heat waves in history that some of them will land on the 11 year sun spot cycle points.

One lesson to be learned here is that heat waves are a common occurrence of life on Earth.  Heatwaves are everywhere throughout the history of Summertime.  Therefore, the hyper-exaggerating of heat waves today is the act of lying via false light misrepresentation --- the committing of fraud --- bearing of false witness --- being unable to be trusted, ever again.  

 Concerning this, instead of journalists constantly writing, "record breaking heat wave," (in order to intimidate you)  they should be writing how to survive a heat wave.  This shows that they do NOT care about you.  They are trying to push one declarative sentence, concerning co2, disregarding the fact that co2 is the key to Life on Earth ... being that photosynthesis is the key to life and co2 is the key to photosynthesis.

All in all, there are many more factors involved in the making of weather & climate than co2.  CO2 plays a minor role in Earth's heat budget, but it plays the star role in activating PHOTOSYNTHESIS throughout the Earth, even in the Arctic Circle.

And remember, 90% of all Greenhouse Gases, by volume, is WATER VAPOR.  Water Vapor leaves behind ZERO CARBON FOOTPRINT.

Southwest U.S.

There is the present saga of the man-made Lake Mead (near Las Vegas) which is dependent upon the man-made reservoir of Glen Canyon Dam which, in turn, was in a more dire situation than was Lake Mead.  So, it was given priority in water acquisition, by the U.S. Bureau of Reclamation.  It's name is Lake Powell, located in Northern Arizona.

Southern California's Mojave Desert, 2012.   I didn't bring anyone with me into that desert which was 102F at the time.

At this point, let us remember an official statement of the (pre-Biden) United States government: "Drought is a normal climate pattern that has occurred in varying degrees of length, severity, and size throughout history."

The exact same United States government declared that:

"Tree ring archives indicate that agricultural droughts such as those that happened in the United States during the 1930s Dust Bowl era have occurred occasionally over the last 1,000 years, and climate model simulations suggest that droughts that may last several years to even decades OCCUR NATURALLY in the southwestern U.S."   

The other thing that naturally occurs in states such as Nevada and Arizona is MONSOON SEASON.  Okay then.  This brings us to France.

The media is obsessed, due to a severe lack of intelligence, with blaming all unwelcome weather events on CO2, while occasionally mentioning "greenhouse gases" in general.

Meanwhile, the same media never explains what constitutes a greenhouse gas, and the same media surely doesn't have the habit of informing its viewers that the #1 greenhouse gas is Water Vapor which constitutes 90% of all greenhouse gases, by volume ... and which has a zero carbon footprint.  The same media doesn't explain "heat transference," as in the three ways in which it occurs.  The media only conveys hype and bullying.

They don't mention Southwestern Monsoon season on a national scale, so that schoolchildren could be placed at ease. They're emotional terrorists looking for taxpayer dollars, NGO grants, etc.  If there is money in terrorizing schoolchildren, they'll do it.

As I have already illustrated elsewhere in the Blue Marble Album, in the July 2022 London hype, as well as in the July 2021 Biden administration's NOAA hype, a lot of falsehoods are flying through the media and the Internet, about July 2020, 2021, and 2022, as well as Greenland snowfall and the ocean sea level reports.

In fact, NOAA has changed historical graphs, to makes the temperatures of the very hot 1910s, 1920s, and 1930s look much cooler and more mild.  This makes that time span's temperatures look colder and much more mild than today's temperatures, and this is outright criminal fraud.   

This is why I advise everyone who is honest to gather as many newspaper and magazine articles about the blazing heat of the early 20th Century as possible, to show how the present employees of NOAA are literally fraudsters.  Include the newspapers of the 1870s and 1890s.  The newspapers of old are the original Climate Record, and they will serve as evidence to prove the fraud.

Of course, being that opinion polling showed "climate change" to often be the least concern amongst American voters, the climate change salesmen realized that they were engaged in a losing proposition.  So, they had to take the hottest month of the year and hyper-exaggerate it's thermometer readings and yearly wildfires, to make a sale ... all the while altering the past temperature graphs, to make the past look degrees colder than those heat-stricken days actually were.

The man-made-co2 salesmen (aka marketers) repeatedly had to exaggerate July's natural heat to the point of making it sound as if the end of the world were once again five or ten years away --- and that only the climate change marketeers can save you.  

So, what actually is a climate marketeer?  ANS: Someone who puts a price on climate-related activity.  Some of that money gets directed into the activists' pockets.

Well, the media has definitely been serving the climate change salesmen, as if to be their campaign volunteers.  So, go to the old newspaper archives, and make a library of temperature records and weather event reports.  That's how you can save the Truth from being hidden away from mankind for all time.

© Patrick Anthony Pontillo 
Of course, dispel from your mind the belief that an amount of CO2 as small as 420 ppm, could ever drive a climate the size of Earth.  After all, it's Water Vapor that comprises 90% of all greenhouse gases ... by volume.  But, why do not college students ever mention Water Vapor in their videos?  None the less, pre-Biden NASA, itself, publicly stated the "SUNLIGHT DRIVES THE CLIMATE."
 
NASA did not include co2 as a driver.  It limited the driver to Sunlight.  So, when you encounter a hot environment in the city or in suburbia or on a military base or at a mall parking lot or at a college campus, think the following:

The heat island effect --- being heavily assisted by asphalt.  It involves Albedo.  Actually, the heat part involves the lack of Albedo.

Albedo is the scattered (the diffused) reflection of solar radiation (aka sunlight) back into outer-space, after making contact-encounter-incidence with some material object on Earth, and doing so without heating that object beyond the percentage of sunlight absorbed by that object.  
 
That is to say, Albedo involves the encountering of a material without heat conduction occurring in the encountering thereof.  Albedo is like a boomerang effect performed with light --- with solar rays.
 
Albedo is measured on a scale from 0 -1, where 1 is the reflecting of 100% of the solar radiation back into outer-space.  The only material object on Earth which can make this happen in 100% completeness is a mirror positioned at the correct angle toward the sun.  Thus, whatever be the other materials on Earth, sunlight is partially absorbed by them and partially deflected from them.   However, the one earthly material that absorbs solar radiation (aka sunlight)  most efficiently is ASPHALT.  It absorbs approximately 95% of the solar radiation that makes contact with it.  That heats things up.

Runners-up in the solar radiation absorption contest include, soils, wet sand, dark clay, grasslands, the tundra, and coniferous forests, as well as black acrylic paint which is equal to new asphalt.
 
This solar radiation absorption will increase surface temperatures  in the cities, at mall parking lots, etc.  Then, when night comes, the heat gets released from the asphalt, etc.  All in all, CO2 has been blamed for causing what is being caused by asphalt and even coniferous forests.

Now, as far as goes Ocean Albedo, it's true that 94% of the sunlight which reaches ocean waves does not rocket back into outer-space.  But, the 94% of sunlight does not entirely get absorbed into ocean water.  If it did, there would be much more of an evaporation cycle and much more flooding on Earth.
 
Now, sunlight at the higher latitudes of the Earth makes contact with the Earth's surface at different angles than at the lower latitudes.  Higher latitudes have too much solar diffusion and do not capture as much sunlight as do the lower latitudes.   Thus, the lower latitudes are warmer and therefore develop the hurricanes which perform the task of heat transfer.  
 
Again, hurricanes are further evidence that the oceans are NOT hording heat.  The oceans are not depositories or vaults for added heat.  In fact, hurricanes can be regarded as substitutes for Albedo that do NOT develop according to sunlight, as Albedo does, but rather develops according to the lessening of air pressure.
 
BTW, the average Albedo for all of Planet Earth is .3 (30%)
 
Incidentally, there are 332,519,000 cubic miles of ocean water on Planet Earth, and as I long since stated, the majority of ocean water is dark and 39F.  So, don't fall for the phrase, "the oceans are all warming 60% faster than originally thought and we're all gonna die."  That was already disproved.  None the less, the 39F temperature is the case for 9,000 vertical feet of the Indian, Atlantic, and Pacific Oceans ... 7,000 vertical feet for the Southern Ocean ... and 653 feet of the Arctic Ocean.  
 
In as much, another mechanism of heat transfer happens with ocean water, due to the fact that water interfaces with air.  In brevity, it goes as follows:  Firstly, ocean waves create an interface with the air, due to the constant moving of waves and their mixing with air.  This means that the heat budget of any ocean surface interface is dominated by short wave irradiance, as opposed to there being an even exchange of short wave and long wave radiation.  
 
Elsewhere on Earth it's a matter of "shortwave in" (from outer-space) and "long-wave" out (from Planet Earth into outer-space.)   
 
So, an airborne "upwelling" occurs slightly above the oceans, and NOT in the oceans.  This is regarded as Latent Heat.  This process can be regarded as the inversion of heat.  The bottom line is that the oceans are not becoming bathtubs of scalding water, as certain political propagandists are claiming.  The existence of hurricanes prove this to be so.  Hurricanes are heat delivery systems.  Thus, the ocean isn't hording any excess heat, and hurricane make sure that they do not do so.
 
Next comes the ocean winds.  It is always the case, everywhere on Earth, that wind is a matter of high pressure air following (gravitating toward) low pressure air.  Low pressure is equated with warmer and more moist air.   Such air rises until it dries and compresses, it then descends toward Earth.  This is known as convection, and there are massive convection cells on Earth.  
 
This convection caused the existence of the Earth's major deserts being on the 30th parallel of both hemispheres, as well as at the Poles.  Yes, Antarctica is the largest desert on Earth, at 5.5 million square miles.  The Sahara is 3.5 million sq miles.

BTW, it can get really cold in the desert at night, due to "radiational cooling" (which is not to be confused with radiative cooling.)  Radiational cooling occurs when no clouds are present, to keep the heat from rising out of the desert.  In fact, cloudless winter nights are the coldest ones.
 
Concerning this, that which Al Gore and a couple former Russia Today hosts claimed about an Ice Age coming to Western Europe was proven completely false by the Summer heat of 2022.  Yes, the very heat used by TV news reporters as proof of co2-driven Climate Change actually disproved it.  Let us review:
 
The Climate Change marketers' claim was that global warming was causing excessive fresh-water snow & ice to melt off of Greenland, into the Atlantic Ocean.  The Freshwater would then lessen the salinity of the ocean, and would cause the flow of the Atlantic to slow down to point of causing an ice age in England, French, and Spain.  Well, in 2022, France endured the opposite of Ice Age weather.  All in all, the Greenland Freshwater Melt theory is a false one.

And concerning the "rising sea levels," it has been officially reported that the average sea level rise of Planet Earth was 7 to 9 inches since 1880.  That's a 140 year time span.  The yearly sea level rise average that was reported is equal to the thickness of the sides of two American pennies; about 3.5 or 3.6 mm.  Elsewhere come different numbers for yearly sea rise, such as 2.84 mm.  All numbers are quit small, but the essence is in the accumulative effect of ten, twenty, and thirty years.  This is explained elsewhere at the Blue Marble Album.

Back to Heat Island Effect
 
An example of how the heat island effect can become effectively deadly was the 2003 heatwave in France.  France?  How ironic!  Oh yes, I forgot.  Climate is cyclical and history repeats itself.  Incidentally, the other modern-era French climate tragedy was the heatwave of 1976.  You still remember 2019, so that is more current events than history.

Concerning the re-visitation of climate tragedy to France in 2022, remember that Global Warming is a habit.  It's an oft repeating pattern.  Sometimes, there is the emergence of a pattern, but such a thing turns out to be a cyclical one.  None the less, once-in-twenty-year events are not signs of global warming.  The warming in the middle of the Troposphere is.
 

There needs to be a cessation of the demonizing of co2.  Asphalt is a different story, even to the point of adopting the slogan, "Keep the co2, but replace the asphalt" (in reasonable time, after a replacement for asphalt has been prepared --- or by perhaps adding an environmentally friendly material that will lighten the color of asphalt and thereby increase asphalt's degree of Albedo.  After all, aged and grayed asphalt doesn't have the heat absorption power of new asphalt)  
 
However, don't think about adding a dye.  For the record, the early 20th Century research on chemical weapons used the dye industry for their deadly poison inventions.  Miles of molecular agents of that type placed on the major highways of America is social sabotage.  
 
Whatever be the case, literally keep Bill Gates out of the equation.  The guy wants you to eat mold, instead of consuming common dinner ingredients, such as steak, eggs, veggies, grain products, beets, potatoes, dairy products, protein powder, collagen powder, herbal teas, green tea, black tea, grapes, grape leaves, etc.  That one guy is Creep-out City.

None the less, that which the modern cities need the most is anything that will give a large area umbrella effect --- that which  makes large areas of shade.  The thing about the heat island effect in a city is that the heat contacts horizontal material like asphalt lots, and it contacts vertical structures called walls.  That adds to the heat effect.  So, shading, shading, shading does bring down the heat effect upon people enduring the heat.

Would anyone be interested in very large helium cartridge umbrellas that float over city blocks?  Just a thought.
 
Degrees of Albedo
 
~Green grass retains more heat than does desert sand.  Grass will absorb 75% of the solar radiation that lands on it, while desert sand will absorb 60%.  And yes, this fact is counter-intuitive, being that you have no problem walking on grass, compared to the burning sensation you get walking on summertime beach sand.  Therefore, green grass albedo is .25, and desert sand albedo is .40.  
 
So remember ===> Asphalt will retain and detain on the surface of the Earth 20% more heat than will a field of grass ... as in a baseball field.   At night, the heat releases from asphalt.
 
~The albedo of Arctic Ice and glacial ice in the average July is about .70.  Ice will absorb 20% to 30% of sunlight, during the six months when the sun never disappears behind Earth's horizon ... in the Arctic, that is.  In March or April, Arctic ice can have an albedo of .85 or so.  So, do not be deceived into thinking that ice reflects back 100% of the solar radiation into outer-space.

~In addition, the albedo of white clouds is about .80.  Clouds are not a 100% returner of sunlight, either.  Some heat is still retained.

In addition, an average sized cloud weighs over a million lbs. A floating cloud mass is millions of lbs.  This, too, is counter-intuitive, until you realize that millions of pounds of snow fall from those clouds during a substantial snowstorm.  In fact, a lot of atmospheric science is counter-intuitive or outright contradictory.   Atmospheric physics can be intricate, requiring equations in its understanding, just like any other science.  It's not as simplex as Al Gore made it out to be, in one of his absolutely worthless videos.
© Patrick Anthony Pontillo 
You perhaps have the general idea of Albedo, by now.   In as much, a lying propagandist looking for government funding, NGO donations, or the instituting of the carbon tax will say to an audience that CO2 drives the climate.  

As was previously mentioned, NASA had a different answer.  NASA claimed in public print that SUNLIGHT drives the Earth's climate.    My answer was that the Coriolis Effect and the Tilt of the Earth drive atmospheric climate, while Eckman Transport drives oceanic climate.  Just a thought.
 
Let us repeat.  The pre-Biden NASA managers publicly stated that:
 
"SUNLIGHT drives the Earth's climate."   Therefore . . .
 
You don't have to submit to the Climate Change bullies, even those bullies at the UN who don't belong to nations who landed on the Moon, landed on Venus, landed on Mars, landed on an occasional asteroid, sailed to the BOTTOM of the ocean, operate an Antarctic science research station, created long bridges maintain long tunnels, manage shipping lanes, etc.  

The truth is NOT on their side ... not even concerning July 2022.   They are blaming their poverty on the United States and Western Europe and even Japan and South Korea.  They are merely looking for an excuse to obtain sizable amounts of U.S. taxpayer dollars, by creating a sense of guilt in the U.S. taxpayer's mind, claiming that any heat wave is cause by the American automobile driver.  Are you holding back a giggle, yet?
 
Let's review:   You drive a car.  You crash into nobody, yet you killed people by driving your car.  That's the Climate change activists' summary.  Meanwhile, they expect you to take them seriously.

July 4, 2026

The Claim of 101F Florida Ocean Water Is 101% Fraud. It was Everglade "run-off" water from the "Taylor Slough" & Mangrove Swamp.

The real ocean water in the vicinity, at the time, was 86F, instead.

The following has been written by an alumnus of one of Florida's coastal universities.  And of course, every coastal university in Florida had an oceanography department.

On July 25th & 26th, media outlets of all categories were reporting that ocean water off of South Florida reached a record-breaking high temperature of 101F, and that this was proof that the planet is in a climate crisis.  The UN Sec-Gen claimed that Planet Earth was now in the phase of Global "Boiling."

The media then mentioned that this 101F reading was at Manatee Bay, as if Manatee Bay were a large and integral part of the Atlantic Ocean.  Therefore, take note that Manatee Bay is a shallow and insignificant shoreline basin that is NOT even worthy to be named on Florida maps.  It's inside of "Barne's Sound," near a Hwy 1 bridge.

Now, the media stated that the 101F reading came from a buoy.  This deceptively made it sound as if the 101F temperature existed three or four miles away from the Florida shoreline.  The reality is that the 101F temperature came from estuary water which, in turn, was actually Everglade run-off water from Mangrove Swamp ... and even water from something known as the Taylor Slough.  All in all, the measurement was that of swamp water, very near shore and very near Hwy 1 which is also called, the South Dixie Hwy.   

On the day reported, the true nearby ocean water was 86F, and this temperature was about three degrees BELOW average.  That amounts 15 degrees Fahrenheit LESS THAN the crisis-stage temperature falsely reported.   It's time for some journalists to be fired.    . 

Plus, the media also reported that the area underwent coral bleaching.  Stop there.  Another false light deception.  Penalty marker time.  This only happened in Islamadora which is 18 miles southwest of Key Largo.  It is located on the main archipelago, and it's known for its "fly fishing."  

Key Largo is also on the same archipelago.  Across the Florida Bay from Key Largo is Mangrove Swamp, and in between the two places is Cross Keys.  Lots of keys in the Florida Keys, and lots of run-off water too.

Posted directly below here is a second map, in order to clarify how much of a deliberate farce this 101F report was and is.  The bottom line is that the news media was reporting on SWAMP run-off water ... and NOT Atlantic Ocean water which is technically on the southeastern side of the South Florida Archipelago where one finds Key Largo and Key West.  Furthermore, if you travel southwest from Key West, you will find yourself in the Florida Straits which pass northern Cuba.
On the map above, Manatee Bay is located where the red circled #4 is located.  Take note that it's semi-surrounded to its east,  by a small archipelago.  North Key Largo is at the top righthand side of this map, on the main archipelago.  Key Largo is at lower central, on the same archipelago.  

At the lower lefthand corner, it is written "Florida Bay."  Technically, the whole area, including very insignificant Manatee Bay, is Florida Bay, until you reach the long archipelago.   The important feature is that the current of the Southern Florida border travels west to east.  

East of the archipelago is regarded to be the Atlantic Ocean --- the Florida Straits.   The true ocean water there, at the time of the 101F swamp water run-off reading was approximately 84.9F to 86F.   Average for July is 89.1F.

The Hwy 1 which is seen on the two maps above is actually the South Dixie Hwy.  The locals call it "the Stretch."  That highway --- that "stretch" --- travels over Surprise Lake, into Key Largo.  Then it suddenly becomes the Overseas Highway.  If you go south on the Overseas Highway for 98 miles, you will arrive at Key West.  

And of course, the ocean water between Cuba and Florida is the Straits of Florida.  That water is quite different than ye olde estuary shoreline runoff water.

Quick lesson:  Estuary water is actually where river water meets an area subject to the tides; where river water becomes effected by tidal action --- and where river water mixes with salt water.  

The bottom line here is that the true ocean water temperature in the area was 15 or so degrees Fahrenheit LOWER than what was claimed by media anchormen & women who are basically clueless and uneducated in matters of atmospheric science and oceanography.

Note:   The source of this article includes the temperature data from the United States' own NCEI-NOAA.  A reference link to that government entity is posted below, at the very end of this post.

One more preliminary statement, to show the hypocrisy of Climate Hysteria Activists

It's now said that fresh water run-off from the Florida Everglades and elsewhere must stop, or else the Atlantic Ocean's Gulf Stream will have reduced saltiness and will then stop moving --- at least beginning at the 45th Parallel.  This includes the temporary & seasonal ice melt run-off of Greenland.  Okay then, explain to me how the Climate Hysteria activists are in a state of cricketed silence on the following:

During every second of every hour of every day of every week of every month of every year of every decade of every century, for thousands of years:

4 MILLION GALLONS of fresh Mississippi River water has been flowing into the Mississippi Delta and emptying itself into the salty Atlantic Ocean.  How do you explain that the Gulf Stream has been flowing sufficiently and effectively throughout millennia, despite the massive fresh-water contribution made to it every minute for the last 4,000 years?  What is the point in stopping Everglade run-off water, while a much more massive amount of fresh water flows into the Atlantic Ocean hourly?

Concerning the 4 million gallon claim, if you don't believe it, then you need to see:

https://a-z-animals.com/blog/4-million-gallons-per-second-and-7-other-incredible-facts-about-the-mississippi-river/

The Amazon River discharges approximately ten times more fresh water into the Atlantic Ocean.  In fact, the Orinoco River discharges almost twice as much fresh water into the Atlantic Ocean as does the Mississippi.

Moreover, the Uruguay & Parana Rivers eventually flow into the Atlantic via the Rio de la Plata Estuary.   The Congo River (of Zaire) has twice the discharge flow into the Atlantic that the Mississippi does, and the Ganges River is slightly stronger than the Congo River.  

The Yangtze River has 1.5 times the discharge flow of the Mississippi.  The Yenisei River is as powerful as the Mississippi, as it's the 5th longest river and the largest one to drain into the Arctic Ocean.  Moreover, the Lena also drains into the Arctic, and it's the longest river within Russia.  

Then comes the Saint Lawrence River and its discharge of fresh Great Lakes waters into the North Atlantic Ocean.  Yet, scientists complain of season ice melt and discharge of a Greenland which is mostly frozen.  Also comes the phenomenon of Arctic waters being super cooled, meaning that such water doesn't freeze, even at 31F, 30F, and 29.7F.  All of the aforementioned makes the Greenland ice melt contribution to the Atlantic extremely insignificant.  Think:  The Saint Lawrence & the Mississippi, along with the Lena & Yenisei, and even the Ob River (of Siberia.).  

In Review ... restated ... for victims of the American Public School System who were not taught to think, but to rattle of bumper sticker slogans mindlessly.

In July of 2023, it was reported that coastal ocean water near Southern Florida reached "the possible record-breaking temperature" of 101F ... or at least 100F.  Stop.  Big lie.  Penalty Marker Time.   Let's get this correct, for the sake of a constantly deceived public.

To start, the actual time when this 101F thermometer reading was alleged to have occurred was July 24th or so.  Available herein are the official coastal water temperature stats for July 28, compliments of the NCEI-NOAA.   

Now, as a preview: The actual coastal ocean water temp at the time was 86 degrees Fahrenheit.   Next:

[1a] The water that was measured was NOT ocean water.  It was NOT "coastal water."  It was estuary water, located between two pieces of land, and NOT located out in the ocean.  The water which was measured (via buoy) is extremely close to the Florida Everglades, on its northwest ... and Florida Bay on it's west southwest.  This translates into marsh water which can be as hot as a sports team's whirlpool in the training room.  And we are talking about a very shallow water basin.

[1b] In other words, the water measured was Everglade Runoff Water, and a few years ago --- I think it was in 2017, if memory serves me correctly --- that same water measured at 102F.  Yet, nobody was squawking, running out into the streets, screaming that it was the End of the World.  None the less, the water there is very shallow and the area involved is the border between marsh water and salt water.

[2a] Now, the general area involves water that runs through "the Taylor Slough," into the Florida Bay.  The slough, incidentally, was designed to provide water to the Florida Everglades which are located on the Southwestern tip of the state.  

[2b] Also involved is a manmade canal that was built in 1968 and then recently altered.  It's known as the C-111 Canal; the C-111 "Spreader" Canal.  It was originally designed to send water through the Everglades, followed by the water running off at the southern border of Florida.  Next came the decision to prevent fresh water from rolling off into the Atlantic Ocean as much as is possible.  That resulted in the C-111 "Spreader" project which is completely pointless in light of the fact that the Mississippi River, at New Orleans, unleashes 4 million gallons of FRESH (unsalted) water into the salty Gulf of Mexico per second.  

[2c] This is why it is such hypocrisy for Climate Hysteria Salesmen to obsess people with the seasonal "ice melt run-off from Greenland" (into the Atlantic Ocean), all the while claiming that it's going to cause a Siberian England, the halt of the Atlantic Ocean, and the End of the World.  

[2d] Incidentally, in order to get the Atlantic Ocean to stop flowing, you must stop the rotation of the Earth.  Plus, you must then rid Planet Earth of either all low pressure systems or all high pressure systems.  That is to say, in order to get the Atlantic Ocean to stop moving, you must stop the winds from blowing, as well as stopping the Earth from rotating.  Do you yet see how incredibly asinine the Climate Change activists & politicians are?  They are literally a danger to society, whenever they are in power.

[2e] In addition, the same Southern Florida Everglades Region is quite close to the Dixie Highway which suddenly becomes the Overseas Hwy, upon crossing a bridge.  That highway literally takes you to Key West.  Locals call the Dixie Hwy "the Stretch."

[3a] As far as goes real coastal ocean water in the area which is measured regularly for its temperature, the two nearest places would undoubtedly be Vaca Key and Duck Key.  Now, the temperature of water changes much slower than does air above land.  After all, water has much more heat capacity, and this particular topic is for another post.  None the less, as of July 28, 2023 (July 29 in Coordinated Universal Time), the ocean water temperature near Vaca Key was 86.0F.  The July average there is 89.1F.  At Duck Key, the ocean water was 84.9F, and it's July average is 87.4F.  This was three or four days after the super bogus & hysterical climate news report.

[3b]  Concerning the keys, the northern area is mostly coral.  The southern sector is mostly sandbar.  There about 1,500 to 1,700 islands in the Florida keys.

[4] During this time, the ocean water surrounding the United States' southern states predominately ranged in temperature between the low-to-mid 80s Fahrenheit and 90F.  In one rare section near Texas, it rose to 94.1F, and that's it.  Later in the month was a 94.1F off of Louisiana, and that was it.  Nothing else higher.

[5] So, the July 2023 reality is this:  During the general time span when the ocean water temps were said to have reached 101F, they actually were 3.3 degrees Fahrenheit BELOW AVERAGE in one nearby area of coastal water, and 2.5 degrees Fahrenheit BELOW AVERAGE in another nearby section of the Atlantic Ocean.  All in all, that area which was said to have been 101F was actually 14 to 16 degrees Fahrenheit BELOW 101F.  It wasn't even close to what the Climate Hysteria Media claimed.  

This is yet another piece of evidence which shows that the "Global Warming," "Climate Change," "Climate Crisis," "Global Boiling" activists are lying con artists . . . of very low intelligence.  They are of very low intelligence, because it is soooooo easy to catch their lies and con games.  Concerning the fact that all Florida coastal water temperatures were very much BELOW 100F, see for yourself, below:

Below is the July 28th report.  If I had learned of the 101F temperature report sooner, I would have gone to the NCEI tally board sooner.  

To the righthand side of the government chart (above) are the monthly averages.  This photocopy is "truncated."  It was cut at the righthand side, after the July monthly average column.  At the righthand side of each row's blue-tinted temperature number is the average temp for Jan, Feb, Mar, Apr, May, Jun, and July.  Aug to Dec was cut-out, for convenience.  

All in all, the hottest temp in the Southern Florida waters at the time was 89-90F, around Key West, Florida.  Nowhere was it anywhere near 101F.  As far as goes as any ocean temperature being in the critical end-of-the-world-and-we-are-gonna-die-tomorrow stage:  Nada.  Niente. Give-me-a-break. Take-a-hike, you-tax-dollar-thieves.

Now, if you want to see all of the coastal ocean water temperatures around America ... and their monthly average temps for each month ... go to the following site.  There is where you will be able to see if the "Climate Crisis" & "Global Boiling" activists are honest people or a bunch of deliberate liars, in quest of fraudulently gained U.S. taxpayer funding and deceptively gained NGO grants:

National Centers for Environmental Information, Coastal Water Guide, found at:

https://www.ncei.noaa.gov/access/coastal-water-temperature-guide/all_table.html

July 3, 2026

There was NO once-in-a-thousand year storm in April of 2025, and NYC did NOT break any rainfall record in 2023.

As an introductory Reality Check, there were tragic storms in America in early April 2025.  But, there was no "once-in-a-thousand-year storm" during that four-day time span.  America's worst storm & subsequent flooding was Great Mississippi Flood of 1927, where 500 died.  The flooding actually began in 1926.  Yet, the Yangtze Flood of 1931 was far more deadly and disastrous.  In fact, the Yangtze Flood of 1935 resulted in approximately 145,000 dead and millions of people displaced.  

There was even disastrous flooding in 1887, concerning the Huang He (Yellow River), where at least 930,000 people died.  And let us not forgot the most powerful tornado outbreak in American history.  This happened in the first week of April, in 1974.  It resulted in 148 tornadoes in 13 States.  There were a number of similarly disastrous tornadic outbreaks in America.  Thus, the events of April 2025 didn't make the list for once-in-a-thousand-year epic storms.

Add to the list of historic disasters the August 1975 Banqiao Dam Failure, in central eastern China.  That was when 62 dams and 5 million houses collapsed.  As far as goes weather in very recent years, it was in September of 2023 when Libya's Derna Dam collapsed during Mediterranean Storm Daniel. There were 39 MILLION cubic yards of water unleashed upon a nearby civilization.  In the end, 5,923 people were confirmed dead, with an overall casualty estimate of 14,000-24,000 assumed dead.  

NYC in 2023 did NOT have any statistic anywhere close to those of the Yangtze, the Huang He, America in April of 1974, Derna in 2023, or even the Mississippi River in 1927.  It was the typical hyper-exaggerated propaganda of the Demented Joe Biden Years.
  
Above:  September 29, 2023, at 5:00 pm.  Posted pursuant to the U.S. Fair Use Act (17 USC Sec 107)

Now, the April 2-5 weather events of 2025 were not a minor occurrence.  But, it wasn't rare, either.  That type of tornado outbreak has happened recently and repeatedly.  It was nothing new.

In matter of fact, there was a similar tornado outbreak one year prior, in 2024.  There was also one such outbreak in 2023 which involved the formation of blizzard conditions in America's Northern Midwest.  These tornadic outbreaks are not once-in-a-millennium events.  They literally have been once-every-year events.  They have been a part of current events in America, for decades.   All in all, there has been no weather event in America, in 2025 or 2024 or 2023, which did not already happen previously, over and over and over again.

April 2025 in review

As far as goes the recent death toll in April of 2025, it was 23 people.  Now, one death is significant.  But, you cannot rightfully compare 23 deaths throughout a multiplicity of American States to 145,000 Yangtze Flood deaths ... or to 930,000 Huang He River deaths ... or to 24,000 dam disaster deaths ... or even 5,923 confirmed deaths in one Libyan city, in 2023.  Thus, the claim of a recent "once-in-a-thousand-year storm" is lying propaganda from people who still think that billions of American taxpayer dollars will continue to be tossed out to manipulative activists like confetti in a ticker tape parade. 

New York Propaganda, 2023

1 of 3} The media kept calling it the "record rainstorm."  It was now the new normal caused by the burning of fossil fuels.  The reality is that it was caused by El Nino's predictable effect on the Atlantic Ocean.  It was the New York City rain of September 28 & 29 (2023), and it was the result of the remnants of a sub-hurricane phase cyclone, called a tropical storm.  The tropical storm's name was Ophelia.

2a of 3} The New York State rainfall record is 13.57 inches in 24 hours of time.  That event occurred on August 12-13, 2014 (nine years ago), at Islip, New York.  The notable feature of that 2014 rainstorm was that five inches of it came down in one hour's time.  

2b of 3} The highest recorded rainfall amount for the recent September 29th (2023) rain storm was 8.64 inches.  This occurred at JFK International Airport.   Now, 13.57 minus 8.64 =  4.93.  Therefore, the  24-hr rainfall total for Friday, Sept 29, 2023 was 4.93 inches BELOW that of the New York State record.  It was 36% lower than the 2014 rainfall.  Furthermore, the Sept 29th rainfall was also below the 24-hr rainfall record of 44 American states.   Thus, it was no major Doomsday event in any capacity.

Intro 3 of 3} Keep in mind that 2023 was an El Nino year and that El Nino carries with itself the power of wind shear.  In 2023, Hurricane Lee was the prime example of El Nino's wind shearing power.  Tropical Storm Ophelia was not immune to El Nino, as well.  Being that physical matter can neither be created nor destroyed, the water formerly carried by Tropical Storm Ophelia had to go somewhere in the physical universe.

Time for a Reality Check 

The irony at hand is that, on September 29th, Islip NY received only 1.13 inches of rain.  That amounts to 12.44 inches LESS THAN Islip's record-setting rain day of 2014.  In addition, the distance between Islip and the JFK International Airport is 29 miles.  Thus, the "Great New York City Rainfall of September 2023" wasn't that widespread of an event, when you count area ... when you count square miles or even square kilometers.

At this point, compare NYC in late September 2023 to [1] Alvin Texas' (Houston area)  42 inches, in 1979 ... [2] Massies Mill Virginia's 27.35 inches, in 1969 ... [3] Hackberry Louisiana's 22 inches, in 1962 ... [4] Kauai Hawaii's 49.69 inches, in 2018 ... [5] South Port North Carolina's 23.56 inches, in 1999 ... [6] Saco Maine's 19.19 inches, in 1996 ... [7] Hogees Camp California 25.83 inches, February 1943 ... [8] Dauphin Island Alabama's 32.52 inches, in 1997 ... [9] Americus Georgia's 21.1 inches, in 1994 ... [10] Hurricane Jean's effect on Florida, in 1980, to the tune of 23.38 inches.  

Let's do the One-Picture's-Worth-a-Thousand-Words thing, with the following photo

The photo below --- which happens to be posted pursuant to the U.S. Fair Use Act --- is said to be that of New York City, on September 29, 2023.  Yet, it looks similar to a part of Chicago I used to drive-through.  None the less, in the grand scheme of existence, NYC did have above-average rain, for a day or two, this past September.  But, it did NOT have anything epic or legendary.   Yet, the Climate Hysteria People were using this very temporary event as a part of their propaganda.

In light of the present-tense weather propaganda, can you see what's blatantly wrong with the photo below?  Can you see what's wrong, in light of that fact that the photo was posted to show "massive NYC flooding?"  
Well, look at all the cars and trucks in that photo, other than the dark blue one on the righthand side which is submerged in water, almost up to its headlights.  Other vehicles in that same photo are not underwater, except for maybe an inch or less of rain water.  Other vehicles there are not underwater, at all.  Plus, there is the four inches of rain water covering the tire sidewalls of the red pickup truck in the center of the photo, making a splash as it makes a lefthand turn.   Yet, you could still see the license plate on that pickup truck.  This means that the water was not at a high level.

You can also see the license plate on the white VW located directly behind the dark blue car.  You can also see the VW's rear bumper and rear tires.  It's certainly not submerged in rainwater.  

The row of vehicles on the lefthand side of the photo are not underwater, either . . . except for maybe a quarter-inch of rain.  There is even a human being on the street, on the righthand side of the photo --- near a row of parked cars ---  who is NOT submerged in rainwater.   She is standing somewhat near those two white SUV's in the background --- a car width or two away from the two white SUVs which are not at all submerged in rainwater.  In fact, the cars parked behind the white VW --- on the righthand side of the photo --- are also NOT submerged in any rainwater.  So, what's the big deal here?

All in all, the terrain that was photographed was entirely uneven, and publishing such a photo as something indicative of NYC on September 29 was & is entirely DISHONEST.   Not much is underwater in that photo, when you look at the background of it ... and everywhere else on the photo. The general rule is that, if you can still see the license plates on most of the vehicles in a photo, then you're not looking at much of a flood.  New York City is not Venice, Italy.  So, quit acting like it is.  

This is amazingly petty, when comparing September 29th to real floods.  Yet, schoolchildren are told to fear such incredible pettiness.  Real floods are the He Huang Floods of 1887, 1931, and 1938.  Epic floods include the Saint Mary Magdalene Day Flood of 1342 (which see) and the Saint Elizabeth Day Flood of 1421.  They also include the Saint Lucia Day Flood of 1287 which killed 50,000 to 80,000 people in the Netherlands.  Epic floods do NOT include the September 29th, 2023 New York City rain.

BTW, the Catholic Church calendar had a number of saint's memorials each day, for each of the 365 days of the year.  Thus, a weather disaster would be named after the most famous memorialized saint of the day.  So, don't get superstitious over the fact that every weather disaster in the Medieval Period and Renaissance Era was named after a saint.  It was a way to tell time ... to keep time ... to record time ... to archive events.   Let us continue: 

New York City did NOT have anywhere near the rain that fell during the Great Mississippi Flood of 1927 --- or the 71.8 inches of rain that fell on Reunion Island, in 1966.  But, it was above-average rain, for NYC.   For example, in an approximate 36 hour period, Brooklyn got 7.34 inches of rain.  Midtown Manhattan got 6.09 inches.  Central Park received 5.80 inches, and Harlem got 5.21 inches of rainfall.  And, as was previously mentioned, JFK International Airport received 8.64 inches, and 4.82 inches of rain fell on La Guardia Airport.  

The "record breaking rain" of September 29 only broke a few LOCAL RECORDS.  At the least, New York City schools should have been shutdown for that day, for the safety of schoolchildren & teachers.  

The Climate Con Artist Photo Gallery

That photo is reminiscent of a certain CNN reporter who walked into a water-filled ditch, up to his waste, in order to deceive people into believing that the town he was visiting was still flooded.

It's also reminiscent of a certain Weather Channel reporter making it look as if the wind was blowing him over, while two youths suddenly entered the scene (on the street behind the reporter), walking very casually, showing that it was not windy at that moment, at all.  None the less, the Climate Change People ... and the news reporters ... have become a gang of fictional actors.  They have become a cast of liars.

All in all, 8.64 New York City inches of rain is not going to make the cut, in the grand scheme of things.  So, you can quit claiming that the "burning of fossil fuels is drowning New York City." 

BTW, the flood water of the Great Mississippi Flood reached a depth of 30 feet.  New York City in 2023 didn't compare to the American Midwest in 1927.

And then there was the matter of the Great Flood of July 1916 which devastated North Carolina.  Again & again, we see that the NYC September 29th, 2023 rainstorm was inconsequential chump change in comparison to a number of other rainstorms and/or floods which actually did bring devastation to such an extent that the lives of numerous people would never be the same again.  

Adding the September 29, 2023 NYC rain to the list of epic rainstorms is an intense insult to human intelligence.  In as much, as far as would go the quintessential "thousand year flood," the candidates would include [1] the Mary Magdalene Day Flood of 1342 (which see), as well as [2] the 1887 Yellow River Flood (China).   

Add to the equation the flood & famine the Year 1315.  Such events were major league floods which occurred when co2 levels were very very low.  The years of sheer tragic climate disaster included 1274, 1281, the 1300s, the Tudor Drought Days of 1540, 1588, the 1600s, the great hurricanes disaster of 1780, the Potato Famine, numerous Medieval & Renaissance famines, numerous Medieval & Renaissance droughts, as well as the Plague years.  

The one-thousand year period before the Industrial Revolution were NOT centuries of mild weather.  There were numerous epic climate tragedies throughout that time span.  The NYC Rain of September 29, 2023 was NOT an epic event in any category.

The "record NYC rain" of Sept 29 didn't  surpass  very many states.  It did NOT even surpass the numbers of its own State of New York.  The media has to hyper-sensationalize everything and terrify schoolchildren in the process.

July 2, 2026

The highest Accumulated Cyclone Energy seasons were in 1878, 1887, 1893, 1906, 1926, 1933, 1950, 1961, 1995, 1998, 1999, 2004, 2005, 2017, & 2020.

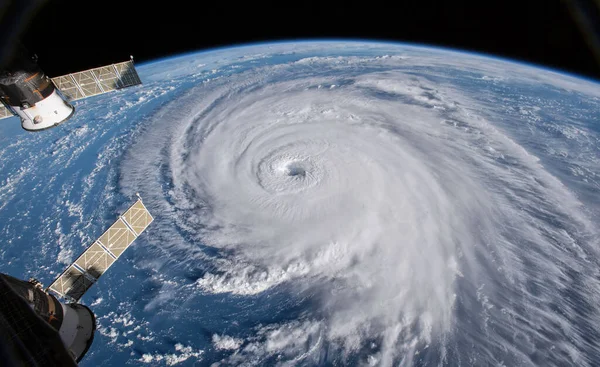
Satellite View Hurricane Florence Atlantics Close Coast Elements Image Furnished — Stock Photo, Image
Hurricane Florence, September 2018

The apparent policy of the Biden Administration was to lie, lie again, and lie some more about everything everywhere.  So, hurricanes became objects of hysterical theatrics, with each one that reached at least Category 3 status.  It then got to the point where a Category 3 hurricane in the Pacific Ocean was now being called "a Super Typhoon."

Well, the Biden Administration made a huge deal out of Ian, a 2022 hurricane.  It's speakers didn't mention that, time after time, while still travelling in the Atlantic, a hurricane has been known to reach a Cat 5 Speed, very briefly and very temporarily.  Well, Ian made landfall as a Cat 3, not as the End of the World. 

As land is approached ... or as a northward direction is traveled ... hurricanes have been known to tone-down.  This is why a total of 4 ... and no more than 4 hurricanes ... made landfall upon the continental United States at the Cat 5 status, since 1851.

And remember, this has been written by someone who lived in one of America's Hurricane Alleys, throughout a ten-year period.  He knows what to except, through first-hand experience.  Let us begin, shall we?

The 2022 Hurricane Season was average in its number of storms --- only slightly below average.   It's Accumulated Cyclone Energy (A.C.E.) scale number was moderately sub-average, at 95.1.  Average is 115.  The year with the highest index number was 1933, at 258.57.  The Year 1926 was close, at 229.55.  Yet, the Year 2005 was even closer, at 250.12.  

None the less, some of the most furious hurricane seasons transpired while atmospheric co2 levels were a lot lower than today.   This topic has been repeatedly addressed in specificity, at the Blue Marble Album.  The top right-hand corner is where this website's search box is located, for those who really do care to learn a few extra things about life --- or a few needed things about life.

For those with short memories, there was only ONE major hurricane in 2022.  In fact, in the entire history of the United States, a grand total of FOUR category 5 hurricanes made landfall upon the continental United States.  

Keep in mind that Al Gore told the world that, from 2006 and onward, the Category 6 hurricane would become the frequent norm.  Gore was completely wrong.  The past 18 years proved this to have been the case.  Gore turned out to be a false prophet, even though he acted as if all that he predicted finally came true in 2022.  

Well firstly, heated summers have occurred throughout recorded history, as has been illustrated at the Blue Marble Album and elsewhere.  And secondly, in 2021, the Antarctic had its coldest Winter in all of recorded history.  There is no way that overwhelming "global warming" is going to prevail throughout the world, when at least one of its polar caps hosts the coldest season in history.

Concerning the A.C.E., it's the sum total of knots squared ... divided by 10,000 ... when measuring a cyclone's rotating wind speed every six hours.  By the way, a knot is 1.15 miles per hour.  Thus, 26 knots = 30 miles, and 80 knots is exactly 92 miles.  

The A.C.E. used to be called the Cyclone Destructive Potential Scale.  In fact, it's technically known as the Integrated Kinetic Energy Index.

Distinguishing Feature of 2022 Season:  It was the first season in 25 years, where there was no named storm throughout the entire month of August.   That doesn't sound much like a climate crisis.  Previously, this happened in 1997 and 1961.

The irony is that, during July and August of the same year, the media was announcing that the world was literally on fire, due to the burning of fossil fuels.  Detailed proof that this was a huge lie --- as it concerned the Greater London geography --- was published exclusively, at the Blue Marble Album, a few days after the very misleading and hysteric newscasts were aired.  Everyone else was way behind in uncovering the truth about today's Climate Liars & their false-light July reports. 

In brevity, there is a sensible reason to explain why there were no storms in August of 2022.  ANS:  Whenever such a thing occurs, it's always due to STRONGER VERTICAL WIND SHEAR (which see.)   Of course, it's also due to the vague-sounding "greater atmospheric stability."

If the Climate scenario of 2022 were as dire as the commercial media mouthpieces made it out to be, there would NOT have been a stormless August in the same 2022.  There would not have been the record cold weather in Australia, and there would not have been the series of record colds elsewhere on Earth in the first half of 2022, including Brazil.  And there certainly would not have been the most coral cover throughout the Great Barrie Reef in 36 years.

The 2022 replenishment of coral occurred in two of the three sectors of the reef.  The other third of the reef became a buffet table for hungry crown-of-thorn starfish.  Starfish did it; NOT co2 or any other greenhouse gas.  Incidentally, 90% of all greenhouse gases (by volume) is Water Vapor.  Water vapor carries zero carbon footprint.

Of course, those who line their pockets & pocketbooks with taxpayer dollars say that every year is the hottest year thus far.  Well, constantly stating this is an indictment upon the NOAA & NASA & government advisor scientists.  They say things are getting hotter, but they do nothing to make things cooler, after 34 years of hype that began with Jim Hansen in a senate subcommittee hearing (in June 1988).  Thus, their value, by their own admission, is nihil ... at least nil.

In as much, if every year is the hottest, year after year, then who needs any government scientist who do nothing to reverse the trend that they claim is occurring?  But of course, their doomsday claims come with altered data ... with their "amended" charts & graphs, all of which, when revised, ever-so-coincidentally show that the Earth is burning-up and melting away.  The same charts show opposite of what newspapers reported in the 1910s, 1920s, and 1930s.  Outdoor workers entirely disagree with cozy nerd-boy scientists whose alteration of raw data is their greatest accomplishment.

Of course, the raw temperature data is altered by the government, via "homogenization."  The government does NOT show the raw data to the public.  It only shows the altered data.  Dishonest people never show honest things to the public.

Anyway, the dishonest media claimed that hurricanes are now rougher and more frequent.  Well, there were below-average years and above-average years of recent ... and throughout the past.  There is no rising pattern and no decreasing pattern more than a few consecutive years at a time.  Climate is cyclical, look a roller coaster, and sometimes mankind gets taken for a ride of historic proportions.  

At other times, there is a lull in weather events.  For example, there was a 12 year period when no major hurricane made landfall in the United States.  That went from the end of Wilma, in 2005, until the arrival of Hurricane Harvey, in August of 2017.   Of course, the commercial media didn't present this fact in bright neon.

Since then, there has been a trend toward more named storms, but not the Category 6 storms Al Gore predicted. Actually, in the past three years, there have been more of those low-intensity storms called Tropical Storms (the chart is posted below).  Such a storm has a max wind speed of 39 to 73 miles per hour .  That's something very survivable. 

 And concerning the commercial media's constant claim that hurricane numbers are increasing, ===>  it only takes one hurricane to kill you.   Even at that, a tornado can kill you a whole lot faster and much more forcefully than a hurricane.  And the great irony here is that, in order for a deadly tornado to be formed, you need a COLD front.  Yes, cold air can be very deadly.  We live on Planet Earth.  None of us is getting out of here alive.  That's the reality check.  The ultimate question is:  What's beyond the horizon?  What's beyond every horizon in the universe?  Where do we go from here? 

The strongest Atlantic Hurricane in terms of wind speed did not form in this decade or in the last one.  It appeared 42 years ago, when co2 was 337 parts per million, and therefore 79 ppm lower than today.

The strongest hurricane in known history was Atlantic Ocean Hurricane Allen, in 1980 (Forty-two years ago --- a half a lifetime ago.)  It's wind speed was 190 miles per hour (mph).  This negates the claim that hurricanes are only now more furious than in decades past, due to the rise in atmospheric co2 levels.  In the Autumn of 1980, co2 was 337 parts per million.  That's 79 ppm LOWER than today.  The Pacific Ocean typhoons were more powerful than the Atlantic cyclones.  This is already covered elsewhere at the Blue Marble Album.

More Examples

The second most powerful hurricane in terms of wind speed is a four-way tie.  Four hurricanes traveled at 185 mph.  This included:  1} The 1935 Labor Day Hurricane, when the atmospheric co2 level was 309 ppm and therefore 107 ppm lower than today.   2} Gilbert in 1988, when co2 levels were 350 ppm and therefore 66 ppm lower than today.   3} Dorian in 2019.   4} Wilma in 2005.  

As further examples, there were 175 mph hurricanes as far back as 1932, 1955, 1969, 1977, & 1979.  Plus, there were hurricanes of the same speed as recent as 2005, 2007, and 2017.  All in all, the media is making it sound as if all of the most powerful hurricanes occurred in the past five to ten years, and that is a huge falsehood.  There is NO CORRELATION between atmospheric co2 levels and hurricane frequency ... and also hurricane intensity.

Here's another example:  Below is a list of the most powerful hurricane seasons.  Keep in mind that the ACE column on the chart stands for Accumulated Cyclone Energy.  

Now, as far as concerns the single most energy-filled hurricane in history (assessed by measuring wind speed every 6 hours) it was the 910 millibar Hurricane Ivan, in 2004.  It killed 64 in the Caribbean and 25 in the United States.  

But, as far as goes the most energy-endowed hurricane seasons, they included the Years 1893, 1926, 1933, 1950, and 1961.  That's 63 to 131 years ago, when co2 levels were significantly lower than today.   They also included recent years, as in 1998, 2004, 2005, and 2017.  (Add the Year 2020, as the tenth most active season on record.)  So, things come close enough to becoming balanced, when comparing the power of hurricanes of old and the power of hurricanes of new.  That illustrates that there is NO immediate ocean-related climate crisis.

Take note that the Year 2020 has replaced 1998, as the 10th most energy-powered hurricane season on record.  It's A.C.E. was 184.  It hosted 16 tropical storms and 14 hurricanes, 6 of which were major ones. It had two more storms than the #2 most powerful A.C.E. season.  It had 10 more storms than the #1 most-energetic season, which was 1933.  And what makes a hurricane season more powerful?  ANS:  Lower low pressure within the storms and less vertical wind shear during the storms.

As far as goes the claim that America has recently been plagued with hurricanes, let's review:

By the way, 2021 had 21 storms in all.  14 of them were the weaker low pressure systems, known as tropical storms. 7of them were hurricanes, 4 of which were Category 3 and higher.  That was the year when Antarctica had its coldest winter known to science, and when numerous record high crop yields appeared throughout the world.

The Years 2011, 2010, & 2009 are missing from the list above.  In as much, in 2011, there were 19 storms w/ 12 of them having been tropical storms, and 7 having been hurricanes, 4 of which were major.  In 2010, there also were 19 storms.  12 were hurricanes, and 5 of those were major.  In 2009, there were only 9 storms w/ 3 hurricanes, 2 of which were major. 

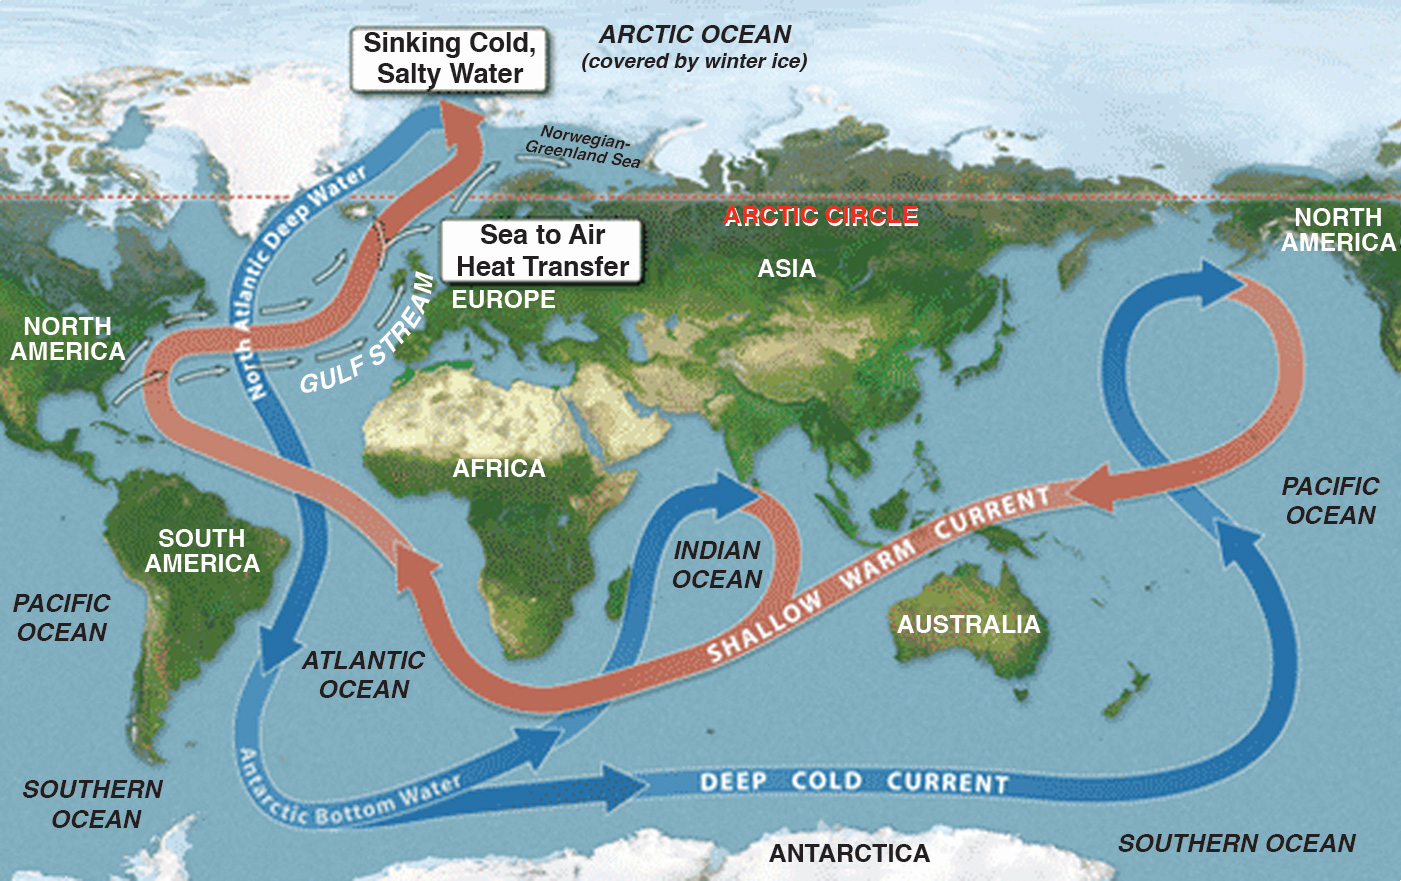
While we're here:  The true ocean surface circulation are eddies --- gyres.

When it comes to explaining to novices ocean circulation, a map like this one is presented, when the Gyre Map needes to be presented.  This is because gyres are at the oceans' surfaces.  BTW, below you see the phrase, "DEEP COLD CURRENT."  All deep currents are cold; 39F, in fact.  None the less, the surface of all non-frozen oceans are gyres ... rotating tops, so the speak.  A little gyre is an eddy.https://www.climate.gov/sites/default/files/GlobalOceanConveyorBelt_large.jpg

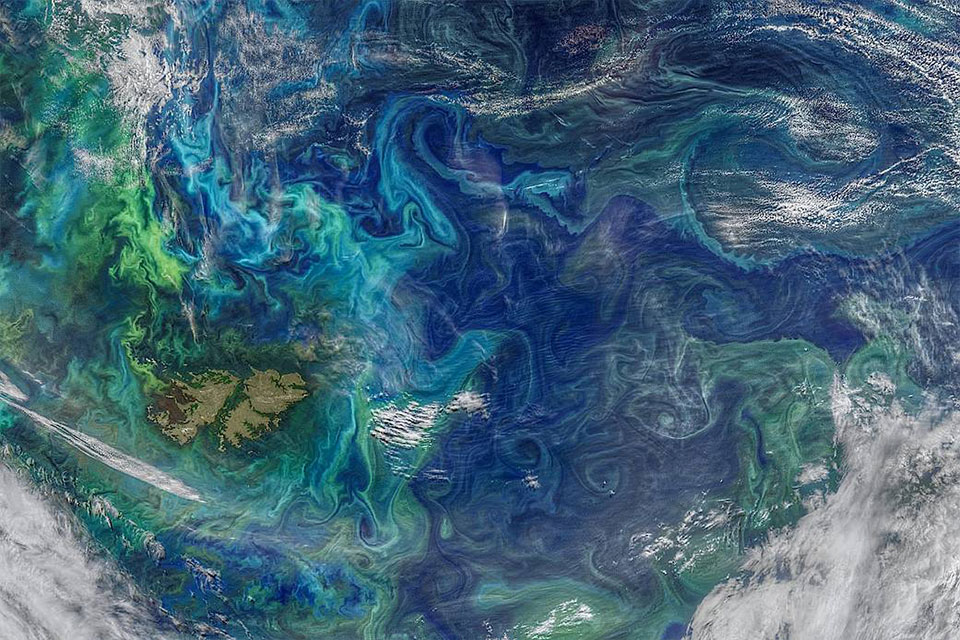
BELOW:  This is the reality, compliments of NASA, in a much more localized photo.  Take note of the very circular, gear-like eddies, especially toward the lower right hand side of this NASA photo.  

In fact, eddies border that specific Equatorial lane of ocean water known as ENSO, aka the Equatorial El Nino /La Nina current.  Yes, the Pacific ENSO is bordered by eddies, aka small gyres --- round, watery gears.

sattelite view of ocean eddies

You have been given 34 years of hyper-exaggeration, aka False-light disinformation.  It hasn't ended.  After all, Monsoon season is now being blamed on "the burning of fossil fuels."  Yet, Monsoons have been a part of Climate all along, due to the fact that pressure systems rotate according to the Coriolis Effect, and also due to the fact that Planet Earth has a 23 1/2 degree tilt to it ... ... and additionally due to the fact that the northern sector of the INTERTROPICAL CONVERGENCE ZONE literally travels as far north as mid-India.  That latitudinal floating action northeastward is India's monsoon season.

Concerning Monsoon Season in the American Southwest desert country, a high pressure air mass that's located partly on land and partly over the Gulf of Mexico serves the role of a gear turning clockwise, sending Gulf of Mexico water Northwest, into Arizona, Nevada, and Utah.  That clockwise high pressure system constitutes their monsoon season.   Of course, this is counter-intuitive & ironic, because "high pressure" usually means "dry air."  Well, when it's partially over water, such a system becomes a clockwise-rotating water pump.

Incidentally, NASA has recently confirmed that there are two simultaneous Intertropical Convergence Zones positioned parallel to each other.  One is in the Northern Hemisphere and the other one is in the Southern Hemisphere, with the Equator being the equilibrium point ... the return point ... of both zones.  NASA calls them TWIN CONVERGENCE ZONES. 

Here.  Lookie see:  https://earthobservatory.nasa.gov/images/2628/twin-convergence-zones

The climate hype has to end.  So, the next time a hurricane comes, be respectful enough for the dead to be first buried and mourned, before giving your asinine conclusions about the cause of something which repeatedly brought intense destruction throughout the centuries, even when the atmospheric co2 level was below 300 ppm.  There is zero correlation between devastating hurricanes and co2 levels.  Hurricanes do NOT discriminate according to co2 levels.  A hurricane is an equal opportunity destroyer, no matter what be the year or what be the co2 level.