July 18, 2026

Antarctica 2023 vs the stories told about it by climate fearmongers

 One picture is worth a thousand words

Below:  North Central Antarctica, on Oct 9, 2023, after it was reported in September of 2023 that Antarctica had a once-in-a-7.5-million-year significant absence of ice during its recent winter.  There were 22 hours of daylight on Oct 9, resulting in the satellite image below.  Now, you show me where this "massive, once-in-a-7.5-million-year" critical ice loss is located.  

Anyway, look and see how much ice was there, while the Climate Scaremongers were claiming that there was catastrophic ice loss at Antarctica, during its wintertime.  They kept calling it a "7 sigma event."   By the way, a 5 sigma event is one that happens every 3.5 million years.  None the less, 2023 was a once-in-a-57-year event.  It wasn't even a "once-in-a-century" event.  

Incidentally, from April 10 to September 2nd, the Sun was "down all day" everyday, at the inner continental recesses of Antarctica.  Thus, there are no daylight photos of inner-Antarctica during winter time.  

In the photo above, at the top, you will see intervals of thick & tapered black lines.  Those are Nadir Gaps, where the satellite was designed to not photograph those thin areas.  They're like grid lines, for measuring purposes ... for surveying purposes.  In fact, any nadir is a line below a certain point that travels straight to the ground and creates a 90 degree angle when touching the ground.

The 2023 Antarctic Deception

When it's a matter of record low wintertime sea ice maximums in either of the two polar caps, it is NOT a matter of ice melting during the season when -20F, -40F, & -60F temperatures dominate.  It's a matter of not as much ice forming after Summer ends at the polar cap in focus, concerning as much ice as was formed in other years.  

Let it be repeated once again, so that the realization will sink inward

If you could prove that there were years before 1979 when polar sea ice was as low or lower than today ... and simultaneously much lower than in 1979 ... then the Al Gore Climate Theory of CO2 as Temperature Driver gets automatically invalidated.   And of course, 1973, 1974, 1975 were significantly lower in sea ice area.  In other years, the sea ice was moderately lower than 1979, concerning the Northern Hemisphere's Arctic Ocean.

The realization of a unconscionable swindle of taxpayer dollars will come when it's made commonly known that 90% of all of Planet Earth's greenhouse gases --- by volume --- is WATER VAPOR.  The realization will come when the media announces the scientific fact that the amount of space that atmospheric CO2 takes-up in the Earth's atmosphere is 0.042%.  This is LESS THAN 1/2 of 1%.  This is almost 1/2 of 1/10 of 1%.  

In other words, for every 2,358 molecules that were in the sky in the Northern Hemisphere's Winter of 2023, only one was CO2.  This is based on a 424 ppm count.  That's 1 in 2,358 molecules.  That's a score of 2,358 to 1.  There is NO WAY in which co2 drives such a climate.

Incidentally, for every 10 molecules in the Earth's sky, 2.1 are the O2 oxygen molecule.  In addition, for every 5.2 molecules out there in the sky, 4 of them are nitrogen molecules (N2.)  As far as goes Argon, for every 21 and a half molecules in the sky, 2 of them are Argon.  So, we visualize the molecular content of the atmosphere:  

  CO2 ... 1 part for every 2,358       Argon ... 1 part every 10.7       Oxygen ... 1 part for every 4.7       Nitrogen ... 1 part for every 1.28

There is Infrared-Inactive CO2 and then there is Infrared-Active CO2:  Not all co2's are alike.

A deeper understanding of the long-term climate con game will seep inward, when it's made commonly known that co2 exists in three modes of vibration known as dipole moments, and in one of those vibrational modes, co2 is incapable of capturing infrared heat.  

This easily explains why an ice age, such as the Ordovician Ice Age, was able to transpire, while the atmospheric co2 level was more than NINE TIMES HIGHER than today.  CO2's three vibrations have already been explained at the Blue Marble Album, at Youtube, and elsewhere on the internet.  However, at this point, take into account CO2's radiative forcing.

Today, IR Active CO2 operates at 3.7 watts per meter squared (w/2).  In 1890 or so, active CO2's radiative forcing was measured at 1.88 watts per meter squared. (That's 1 POINT 88 watts only.)  As a result, it was declared that the radiative forcing of CO2 doubled since 1890.  Time out here.  Here comes the question ... eventually:  

The vibrational mode of CO2 comes in three modes, but only  one mode at a time.  They are 1} Symmetric  Stretching  2} Asymmetric Stretching   3} Bending Motion, like the flapping wings of a bird in flight.  

Well, when a CO2 molecule is in the Symmetric Stretching Mode, it is infrared inactive (IR inactive.)  It does NOT create "a dipole moment."  It does NOT show up on the IR Spectrum.   It is incapable of retaining infrared heat ... It is incapable of causing global warming.  In fact, it can cause Ice Ages.  This is why an Ice Age can occur when the CO2 count is NINE TIMES HIGHER than today. 

So, here is the question:  Where is there a chart, table, or a graph that marks CO2's watt-per-meter-squared radiative forcing, according to its three different vibrational modes, aka dipole moments?   In other words ...

.[1] At what amount of watts per meter squared does CO2 exist, during its asymmetric stretching mode?   [2] At what amount of watts per meter squared does CO2 exist, during its bending mode?  

Needless to say, CO2 radiative forcing is ZERO watts per meter squared, whenever co2 is in its Symmetrical Stretching Mode.  An atmosphere of symmetrically stretching CO2 can cause an Ice Age.

One more thing about CO2.  While it's claimed to be the cause of Global Boiling as a greenhouse gas, when CO2 is in its solid form, it's a refrigerant.  It's a block of ice called Dry Ice.  Ironic ... sort of.  What it actually does is become a medium ... a go-between for ... heat transference (which see.)  We return to the topic at hand, though:

The lesson here is that Atmospheric Science is exceptionally involved and is NOT driven by only one variable -- one input number.  Atmospheric Science is NOT the simpleton version presented by the Al Gore People, in 2006.  Therefore, to use as your spokesperson a Swedish high school drop-out who does NOT know the first thing about 1] Atmospheric Science,  2] Weather History,  3] Meteorology,  4] pre-Holocene Paleontology, and/or 5] Oceanography is to use one of the most Useful Idiots a political faction can ever use to advance its agenda ... and to keep humanity dumbed-down with emotion-inducing diversionary tactics.  

Such a thing is not clever.  It's predictable for any faction that keeps losing the statistics and proxy evidence war, thereby necessitating that faction to hide such scientific & historic facts from humanity.  Thus, you use an emotionally unstable teenager and give her false statistics.  You tell her the opposite of the fact that the natural disaster death rate declined super significantly since the 1920s, the 1930s, and the 1940s.  

You also tell her the opposite of the fact that American yearly forest fires (wildfires) dropped super significantly since the late 1920s and the entire 1930s, when the western population was so low that there wasn't the manpower nor the technology to put out the massive fires, during the worst drought in the previous 1,000 years.       

You then hide from this misinformed teenager knowledge of the existence of the Nimbus Satellite Series of the 1960s & 1970s.  You finally tell her in 2018 that the World is going to end in 2023.  You also make sure that your false information is channeled through the official channels of an organization controlled by 2nd World & 3rd World political operatives.  

Minus 94 Fahrenheit, in May of 2024

The time of this writing is the Memorial Day Weekend, 2024.  The place of this writing is the United States, specifically near the Three River Confluence of Pittsburgh which is located at 40 latitude & 80 longitude.

There have been constant claims that the Earth is in a state of global boiling and that there have been heat waves in Antarctica, in addition to the provenly bogus claim that Antarctica is suffering from a catastrophic amount of ice absence ... or even ice melt.  Okay then, below is the most recent temperature report from the Amundsen-Scott Base, in Antarctica.  This Accuweather report is placed here as a reality check, for those who actually believe the Antarctica is melting:

We keep being told that Antarctic ice is melting.  Of course, those who get Congressional funding, NGO funding, and other types of funding are the ones who keep saying this, over and over again.  Well, for ice to have melted at Amundsen-Scott in May of 2024, the temperature needed to have risen 126 degrees Fahrenheit.  The report above is that of May 27, 2024.
During the same May week of 2024, the famous Vostok Station dipped to MINUS 99 degrees Fahrenheit.  In order for ice to have started melting there, the temperature needed to rise 131 degrees Fahrenheit.  
During the same May week in 2024, it dipped to MINUS 96F, at the famous South Pole Station.
The Concordia Research Station is well known to the knowledgeable.  During the same May week of 2024, the temperature there dipped to MINUS 99 Fahrenheit, as it did at Vostok.  So, what justifies a person heavily compensated by various "climate funding sources" to tell humanity that Anarctica is melting and that the Statue of Liberty is in the process of going underwater? 

ABOVE:  During the same month of May 2024, Springtime America received record snowfall, at Lake Tahoe.  But, we keep being told that the sea level will rise 200 feet.  Yet, from 1880 to 2020, the sea level only rose 8 to 9 inches.  

Then,  it was recently claimed by well-funded scientists that the sea level rose 4 inches in the past 30 years.  That would amount to 0.1333 inches per year ... or 13 & 1/3 inches per century ... or 16 inches per every 120 years.  This amounts to a sea level rise equal to the width of two pennies per year.  

At today's "reported" rate of sea level rise, it will take 17,158 to 18,000 years to elevate the sea level 200 feet.  Do you have just cause to believe the heavily funded "scientist" who claimed on stage, in front of a video camera lens, that the sea level will rise 200 feet?  He's on video, sounding all so confident ... and in-your-face pushy, like a salesman.

Welcome to the CO2 Gazette:

In 1966, the atmospheric co2 level was 322 ppm.  The Climate Hysteria propaganda teams of today assert that atmospheric co2 levels below 330 ppm are quite safe and do not trigger severe ice melt or weather disasters of note.  This would mean that, in no way would there have been any time in which Polar sea ice would have reached a record low, while co2 stayed below 330 ppm.  And in no way, according to the same assertion, would hurricanes be a menace to any part of Planet Earth.  

Well, those two assertions were proven wrong, simply through reading centuries of weather history.  The 1960s saw a few years of significantly less than usual polar sea ice, and in the early 1960s, there were a couple of world-ending Pacific Cyclones.  Their pressure systems within were the lowest of the low.  They proved the 330 ppm ceiling limit theory to have been worthlessly false, as did any catastrophic cyclone that emerged before the Year 1974.   This included those that date as far back as the day after Christmas, in 838 CE.  

There is a long list of cyclones and major storm tides which transpired when the co2 count was below 300 ppm and which killed thousands upon thousands of people, as well as having rearranged the coastline of the Netherlands ... and even put cities into the history books, such as was the case with the Danish city of Rungholt, in 1362.  

The many natural disasters which occurred from 838 CE to the start of the Industrial Revolution proved Al Gore, David Attenborough, and Michael Mann to have been extremely non-factual.  It is a complete lie to claim that the weather was mild for a thousand years, until the start of the Industrial Revolution in 1760.  There have been horrendous weather events all throughout the Medieval Era, the Renaissance Era, and the Baroque Era.  This included the Age of Exploration ... and Colonization.  This included the reign of Kubla Khan.

The co2/temperature Causation Assertion was long since proven wrong, via the searing heat of 1936, 1934, 1922, 1921, 1913, 1911, 1905, 1901, 1895, 1878, and 1871.  These heated years all transpired when when the co2 count ranged from a very low 295 ppm to a low-enough 310 ppm.   

This same climate assertion was proven wrong in 1966, when the Antarctic wintertime sea ice plummeted.  In 1966, the co2 count was 318 ppm.  That's 12 points below 330 ppm threshold theory.  Yet, co2 didn't follow the rule that the Global Warming People set for it.  Meanwhile, the 500,000 year long Ordovician Ice Age proceeded while the co2 level was at 4,000 ppm.  

The details of that particular ice age is beyond the scope of this discourse.  However, shortly after the Climategate emails were revealed, someone presented a theory for that ice age, by citing the low Carbon-13 count at the beginning of that half million year ice age which came in two major pulses.  Well, it was recently found that a rise in co2 is accompanied by a decrease in carbon-13. This is called "an inverse relationship."  This was concluded through a study that involved the 1990s to the Year 2021.  

During ice ages, there is a much less supply of water vapor in the air, being that extremely cold air also equals dry air.  Being that water vapor is 90% of all greenhouse gases -- by volume -- any discussion of greenhouse gases -- in any era of climate history -- is automatically invalid, if water vapor is not included in the discussion.  

In as much, the mystery as to how a glaciation period can persist is easily solved.  Water Vapor becomes a rare commodity during ice ages.  However, there still remains the mystery as to what actually causes ice ages to commence, in the first place.  There is more to include, but not here, due to the budgeting of printing space.

Recent CO2 Scorecard

As far as goes 330 ppm, that level of atmospheric co2 arrived in 1974.  Then, in 1980, the co2 count rose to 339 ppm.  The 1990 co2 count was 355 ppm, and at the Turn of the Millennium, the co2 count was 370.  The 400 ppm marked occurred in the Year 2015.  And when the co2 count reached 418 ppm in 2021, Antarctica ended up having its coldest winter in known history.  Al Gore & Michael Mann are summarily proven wrong, yet again.  The 418 ppm level should have heated-up Antarctica, when the opposite occurred in the Southern Hemisphere.

As far as goes hurricanes, in the history of Planet Earth, voyagers and coastline inhabitants have witnessed coastline-destroying hurricanes throughout the centuries when the co2 count was below 300.  This included massive sea storms of the 1700s, 1500s, and very late 1200s.  Include the Pacific during the early 1960s, when charting the most extreme cyclones in history on a graph.  In 1962, when the Pacific Ocean delivered a handful of historically punishing typhoons/cyclones, the co2 count was 318 ppm. 

The aforementioned topics have already been detailed at the Blue Marble Album and elsewhere.  There's a search box at the top right-hand side of each of this site's pages.  Make good use of it.

Official Academic Atmospheric Science Teaching

When it comes to natural disasters and temperature, one must learn the science of Pressure Gradient Forcing, as well as Baroclinic stability vs instability.   It goes as follows:

Very simply, when the temperature difference between the Equator and the Poles gets closer to each other ... aka "diminishes" ... as when a phase of global warming occurs, then the atmosphere becomes less turbulent and there are less hurricanes and other types of turbulence-induced natural disasters on Planet Earth.  

On the contrary, when the temperature difference between the Equator and the Poles widens ... increases ... as during the Little Ice Age ... the atmospheric turbulence of Planet Earth increases, and this results in more hurricanes and other turbulence-induced natural disasters.  Once again, for clarity sake, it's the global cooling phases which result in more turbulence-related natural disasters.

As a result, there were tremendous sea storms, aka cyclones, during the Little Ice Age which occurred from 1284 C.E. and 1840 C.E.  This included the disaster of 1780, as well as Kubla Khan's naval invasion fleets being decimated on two different storm-ridden occasions.  There is a notable list of cyclones, coastline floods, and other natural disasters throughout the centuries --- long before the invention of the gasoline-powered engine.  

It was a complete lie to have claimed that the weather was mild for a 1,000 years, until the Industrial Revolution.  There were massive disasters supported by evidence and surviving witnesses which occurred when the atmospheric co2 count was very low.  In fact, numerous grave markers, the Elbe River Hunger Stone, chronicles, captain logs, and monuments of Europe prove Michael Mann and David Attenborough to have been the most egregious of liars, in their claiming that Planet Earth was a hedonist's pleasure palace that hosted no hurricanes, droughts, floods, epidemics, or famines, for a thousand years.

This pressure gradient force reflex is why jet streams only meander during wintertime.  It has nothing to do with CO2.  Plus, realizing that co2 is too small in quantity ... in the atmosphere ... to ever drive the climate, is not an element of cognitive dissonance.  It's an element of common sense.

World peace will be accompanied by the discarding and the disqualifying of many lies that line society today.  Incidentally, the TIROS-1 weather satellite dates back to 1960.  It's first photo was made on April 1 on that year.  Thus, the satellite era did NOT begin in 1979.  It began in 1960.  The full article related to the photo below ... and related to satellite technology of the 1960s ... is found at:

https://www.climate.gov/news-features/featured-images/earliest-satellite-images-antarctica-reveal-highs-and-lows-sea-ice

Below:  Now remember, the article below involves the year with the HIGHEST (the most) wintertime Antarctic Sea Ice Extent.  It's also known as "Antarctica's Sea Ice Extent MAXIMUM."  And of course, it appears to be a relative tie between 1964 and 2014.  

Below is the same article text, provided at a larger size, for readability purposes.  All in all, when the Climate Hysteria People at the UN and in the present US White House administration claim that the Satellite Record did not begin until 1979, you can now tell them that it started in 1964.  You can also tell them that you know that they are a bunch of liars, making outrageously large sums of money, by means of lying to humanity and creating fear.  Knowledge ends fears. 
                                           ★☆     ★☆     ★☆     ★☆     ★☆     ★☆

July 17, 2026

1970s atmospheric facts were hidden from you by Guess Whom

In Year 1979 is the year in which the Arctic sea ice covered the most area in known history.  And of course, the Climate Scaremonger Faction wants all graph-making & statistical charting of the Arctic's ice cover to begin at its highest numerical year, namely 1979.

In this way, every year to follow 1979 will have a lower square mileage area number attached to it, and this will make it appear that atmospheric CO2 has been melting the North Pole region for the past 45 years.  Such a thing is a very predictable trick; sophomoric at best.

The Climate Scaremonger Crowd wants humanity to believe that every year previous to 1979 was a year of equally plentiful sea ice --- that 1979 was just an average & ordinary year when it came to polar sea ice volume, in comparison to 1973, 1974, 1975, and 1976 which had much less Arctic sea ice than did the Year 1979.  

In fact, 1976 was a tragically hot Summer in France.  It was outright hot in Southern England, but not as tragic as in Paris.  In the Arctic, there was not as much sea ice as during 1979. 

According to the Al Gore & Jim Hansen Theory, no extremely cold and ice-ridden year should ever follow three warm years of less sea ice.  But, such a thing happened in the 1970s.  In fact, after the ice-ridden year of 1979, 1980 hosted a Summer of true record heat.

Climate Doomsayers want mankind to believe that the atmospheric CO2 level of Planet Earth reached a tipping point in 1979, causing the Arctic sea ice sheet to begin its  GRADUAL decline in ice-cover in 1980.  In this way, the Climate Corps could easily deceive the People of the Earth into believing in the Al Gore & Michael Mann Theory of Climate.  

Of course, that theory asserts that CO2 principally drives Planet Earth's climate and determines the surface temperatures of every square kilometer of a very divergent Planet Earth ... and that it happens gradually, in proportion to the amount of CO2 in the sky. 

 As a result, the Climate Alarm Propagandists falsely told mankind that the Satellite Era did not begin until 1979, and therefore, when it comes to viewing the condition of the Arctic regions during the previous nine years of the 1970s ... and during all of the 1960s ... "there's nothing to see here, folks.  Just move on."  Propagandists do not tell the whole story.  They present their cases in a false light.  It's the Way of the Grifter.

The problem is that there were a number of years preceding 1979, when the sea ice content of the Arctic and the Antarctic was notably lower than usual.  This invalidated Al Gore's Climate Theory of CO2 as Driver of the Earth's Climate.  This is because there should NOT have been a sudden rise in sea ice in 1979 and during other years of the 20th Century.  

This finding is in keeping with true atmospheric science, because 90% of all greenhouse gases, by volume, is WATER VAPOR, making co2 extremely subservient to water vapor.  If anything, water drives the climate.  But, NASA long since proclaimed that the driver of the Earth's climate is the Sun and that the Sun drive air pressure systems which drive the climate.

Now, I'm well aware of the percentage of "greenhouse effect" Water Vapor is ALLEGED to have upon Planet Earth ... according to a certain university: 41% to 57% of "the warming effect in the atmosphere":

1} as opposed to material volume of water vapor in the atmosphere (which is 90%) ...2} as well as material mass of water vapor in the atmosphere (which is 80%).  Responding to this with qualifying statements will require more length, and therefore, it will require a new post, if time ever permits.  

At this point, it suffices to note that there is a "positive feedback" to Water Vapor, by which 1} the warmer it gets, the more water vapor is able to inhabit an expanding atmosphere, and 2} the more water vapor which goes into the atmosphere, the more the infrared heat that gets retained, enabling things to get warmer on Planet Earth.  So, a certain university has "some 'splaining to do, Lucy."

In addition, CO2 is something constantly being consumed by trees, plants, bushes, seagrasses, kelp, coccolithophores, grain, and even cyanobacteria.  It doesn't merely float around the sky aimlessly.  It's literally plant food, along with chlorophyll.  

Let us review, for the benefit of those who have trouble reading and need to review the basics

The atmospheric CO2 level was on a constant rise in the 1960s & 1970s.  But, polar sea ice was NOT on a constant decrease.  Therefore, if the Al Gore Climate Theory is true, then there should have been a constant decrease in Polar sea ice throughout the '60s & '70s.  

The Polar sea ice decline needed to have been equal to the rise in atmospheric CO2.  Well,  this did NOT happen.  The atmospheric COCO2 count steadily rose, like a department store's escalator, en route to the store's 2nd floor.  But, polar ice extent did NOT decline in proportion to the rise in CO2.

Meanwhile, the Polar sea ice area of the 1960s, when graphed by honest scientists, looked like a roller coaster's track, going up and then going down, etc, etc.  Thus, the atmospheric co2 graph and the polar sea ice graphs were NOT parallel.  They should have been a mirror image of each other.  They were not.  

Shortly After the True Satellite Era Arrived ...

Take note of the following abstract.  It was written shortly BEFORE the time when the record-breaking Antarctic sea ice high of 2014 was measured.  None the less, the finding of & the rescuing of 250,000 pieces of satellite evidence in 2014 helped to prove the present Climate Crisis narrative to be a con game.  It helps to show how non-factual the Al Gore & Michael Mann School of Climate is, in its claim that the Earth's surface temperature proceeds parallel to the atmosphere's CO2 count, in present time.  

There was a lot less CO2 in 1966 than in 2021, as in 320 ppm for 1966 and 411 ppm for 2021.  So, 2021 should have had the record low sea ice and 1966 should have had the coldest Antarctic winter in recorded history.  Well, the opposite occurred.  This is evidence that the Al Gore CO2 Climate Driver Theory is not true.

In as much, if you hear anyone preach about climate, without acknowledging the existence of the Nimbus I, Nimbus II, and Nimbus III satellites of the 1960s & 1970s, then you are hearing a lying con artist who doesn't want anyone to analyze the 250,000 Nimbus satellite images ... ... or else you are hearing one of the many useful idiots of Al Gore who don't even know about the existence of the Nimbus satellite series.


                 📡     📡     📡     📡     📡     📡     📡     📡     📡     📡     📡     📡     📡

                                                      ★☆★☆★☆★☆★☆★☆★☆★☆★

See:  https://www.earthdata.nasa.gov/learn/articles/new-data-from-old-satellites-a-nimbus-success-story

★☆★☆★☆★☆★☆★☆★☆★☆★☆★

In the shaded pink is what the more recent Climate Profiteers try to hide from you and me.  Yes, they are still trying to ... "hide the decline."  This is in reference to the 2009 Climategate emails.

🌐🌐🌐🌐🌐🌐🌐🌐🌐🌐🌐🌐🌐🌐🌐🌐

July 16, 2026

The Great "London-is-burning" Lie of July 19, 2022 ... conjured by the media

The following was written in 2022.  But, it is far more pertinent today, in light of the continuing hoax of the UN & Gavin Newsom ... as well as during the Biden-Harris Years ... which claim the world to be in a Climate Crisis.  There are over 60 climate-related discourses here, to prove the sky-is-falling claim to be an insult to a reasonable person's intelligence.  And they are supported with numerous pieces of evidence which, predictably enough, is known as "Evidentiary Support."  

In as much, if you don't at least look through the numerous pieces of evidence here, then you have zero right to speak on the subject.  Basing one's belief on anything ... by means of only one biomarker ... especially by one statistic that is taken out of context ... is the sign of someone easily persuaded and therefore easily duped.  

Of course, the rise in CO2 is the sole marker cited in doomsday diatribes.  Yet, the amount still is a mere trace amount in the atmosphere which is 78% Nitrogen, 21% Oxygen, 9% Argon, and a mere 0.044% CO2.  Moreover, CO2 has three alternating vibrational modes attached to it, one of which renders CO2 incapable of capturing Infrared Light.  This is why it was possible for there to have been a major ice age, while the CO2 count was 9 times higher than today.

And ironically enough, since March of 2025, the atmospheric CO2 count of Planet Earth declined by 3 parts per million.  Once again, from March 2025 to the end of November 2025, the CO2 count dropped by 3 ppm.  That was unexpected.  Very unexpected.  The assumption was that it was going to increase by 2 or 2 ppm.

Ironically enough, like a typical dictator, Al Gore refused to have videoed debates about his doomsday climate claims.  This is because he knows that he will lose the debate ... in the cross-examination.  

And of course, Attenborough was proven 100,000% wrong in him having stated that the weather of Planet Earth was stable for 1,000 years, until the invention of the combustible engine.  It was anything but that ... and lots of historic and statistical and archeological evidence exists to prove Attenborough to be nothing but a liar.  

In the last 1,000 years, there were droughts and historic storms, including one that rearranged a coastline in 1287.  There were also the resultant floods, along with glacier growth, heat waves, and more, all occurring when the CO2 level was as low as during the Roman Era.  So, in the words of Jackie Gleason (super famous TV host of the 1960s), "And away we go."

🌐🌐🌐🌐🌐🌐🌐🌐🌐🌐🌐🌐

Let us begin with the various fire & incident frequency charts provided to the public by the London Fire Brigade.  Concerning Greater London's size, it encompasses an area of 610 square miles.  

Keep in mind that, during July of 2022, the media kept stating that the rise in atmospheric co2 was finally causing an out-of-control rise in Greater London fires.  Well, the opposite is true.

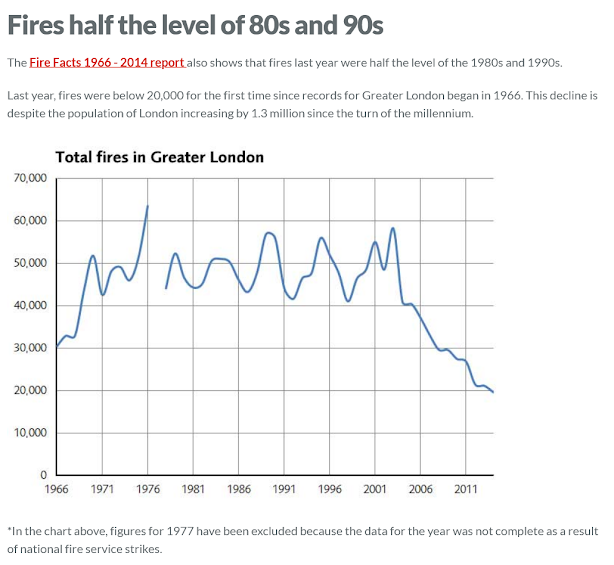
From the Year 2004 to the Year 2022, the annual number of London Area fires were cut in half, in comparison to the fire numbers ranging from 1969 to 2004. In fact, each individual year ... from 2004 to 2022 ... was 1/3 of what it was in 1976.  

Moreover, the year prior (2021) was the year of the least number of fires in the record-keeping history of Greater London.  Meanwhile, the Year 2022 had the fourth least number of fires in the Greater London area ... since the beginning of record-keeping there.  In fact, while the atmospheric co2 level was rising throughout the years 2004 to 2022, the number of Greater London fires continuously decreased.  Therefore, an elevation of co2 will NOT cause your city or town to dry-out & burn-up.  See for yourself.

In July of 2022, the media claimed that atmospheric co2 finally reached a tipping point.  In July of 2022, the same media began the countdown to the End of the World ... proverbially speaking.   On the 19th of that month, the London Area thermometers went above 100F.  In London, the official reading was 102F.  In a town located 11 miles west of London, the reading was 104F, for two hours only.

The claim was that co2 was saturating the atmosphere so badly that it was now causing London to dry-out and burn out-of-control.   The newscasters claimed that, on July 19th, the London Fire Brigade had its "most incidents" since the bombing of London, in WWII.  

The same media said that the London Area had the most fires in any one day, on July 19, 2022.  The truth is that July 19, 2022 wasn't anywhere close to that.  In comparison to any WWII air raid, the July 19th incidents was less than chump change.  Compared to the daily average of fires in 1976, the number of fires on July 19th was 52 fires LESS.  

Compared to the daily average of Greater London fires in 1970, 1975, 1979, 1983, 1984, 1989, 1990, 1994, 1995, 2000, 2001, 2003 and a few other years, the number of July 19th fires were 24 to 38 LESS.  At the very least, there were approximately 2,500 Greater London days that had more fires than did July 19th day.  Reporting July 19th as the worst day since a world war was like lighting a candle with one matchstick and claiming it to be a 5-alarm fire.

In the entire Year of 2022, there were 19,297 fires in the 607 sq mile area known as Greater London.  In 1976, there were over 60,000 fires in the exact same area. In 1989, 1990, 1995, and 2003 there were over 55,000 fires EACH YEAR, in the exact same Greater London region.   More important is the fact that, in every year from 1969 to 2005, there were at least 40,000 fires.  That amounts to 37 consecutive years when the yearly fire count was at least TWO TIMES MORE than it was in 2022.   This also amounts to an average of 164 fires per day during 1976 versus an average of 53 fires per day in 2022.

Now, July 19 was an average day in terms of "incidents."  The daily average for 2022 was 343 incidents per day.  In 2022, 47% of all Greater London incidents were false alarms; 59,415 of them.

On July 19, 2022, there were 362 incidents.   On that same day, there were 142 false alarms.  There were 112 fires on that day, and that number has an ironic twist to it.  This is because the daily average of fires from 1970 to 2004 were at least 109.  Thus, July 19, 2022 was an average day, when looking at the big picture. 

A complete London Fire Brigade Incident Record for July 19 can be found directly below, via 7 photo-copies.  You can do the statistics yourself.

https://www.bluemarblealbum.com/2024/05/July2022-official-greater-london-fire-stats.html

Let's review this correctly, without any sleight of hand con artistry:

Between 1970 and 2004, the 610 square mile region known as Greater London had between 109 to 164 fires PER DAY.  This translates into 60,000+ fires per year and 40,000 fires per year.  Then, in the Year 2009, yearly London fires decreased below 30,000.  

Next, in 2014, yearly fires decreased to 20,000 per year.  So, between 2015 and 2022, Greater London had an average of between 41 to 55 DAILY fires.  Thus, it was an unconscionable lie to have stated that Greater London's climate had gotten out of control.  The opposite was true.

The number of London fires were literally cut in half, while co2 increased significantly in the atmosphere.   Thus, a courtroom lawyer could actually tell a jury that the rise in co2 caused a decrease in London fires.  Yet, the truth is that co2 remains at such a small atmospheric level that it can't affect the air, either for good or for bad.  The only greenhouse gas which holds influence is water vapor.  In fact, Cirrus clouds retain infrared light more effectively than does co2.  

The atmosphere is humongous.  Acres of plants, trees, weeds, and blades of grass are all tiny, in comparison.  CO2 drives the biosphere; not the atmosphere.  The other greenhouse gases ... other than water vapor ... are too small in quantity to drive any air mass greater than a laboratory experiment chamber.

Ther article below is "truncated."  It's only part of the whole.  The entire article can be found by clicking here:


Back to 2022

The pronounced decrease in Greater London fires occurred while the population of the area increased by 1,300,000 people.  Now, an increase in population brings with it an increased probability of fires.  

However, despite the simultaneous increase in the London Area population and in the atmospheric CO2 level, Greater London achieved an eighteen-year-long streak of consistently decreased fire event numbers.  Thus, CO2 is not as powerful as the media claims it to be, in killing-off society.   The asininity of demonizing CO2 is that, without CO2, life on Earth ceases.  After all, CO2 is the activator of photosynthesis. 

At this point, keep in mind that the media in July of 2022 showed houses or small buildings on fire, as if CO2 caused spontaneous combustion throughout London.  "Chart #17" below is from the London Fire Brigade, and it mentions that "House fires in Greater London have reduced drastically since 1981."  This decrease occurred while co2 levels were rising and while the population of Greater London was rising by an additional 1.3 million people.

This proves that in no way did the constant rise of atmospheric co2 cause an increase in Greater London fires.  Thus, the 2022 London news reports were all scams.  It was one big false alarm.   In as much, let's view additional evidentiary support provided by the London Fire Brigade:

Above:  The stats of 2021.  That's last year.  Last year was the year of the LEAST NUMBER OF FIRES in the London Area, in all of London's recorded history.  In as much, 14,929 is much less than 40,000.

Most important is that the co2 level of 2021 was the exact same co2 level of 2022, minus an insignificant one and a half parts per million.  The exact same co2 level gave the 610 square mile London Vicinity its LOWEST AMOUNT of fires-per-year, ever since record keeping began.  Thus, we have 100,000% proof that the co2 level of 2022 did NOT cause London to catch on fire, as the media very falsely claimed, to its future legal detriment. 

Above are the stats for the Year 2020.  This is the year with the second LOWEST number of fires, up to 2023.  17,409 is also much less than 40,000.

Directly below are the stats for the Year 2022, as of October of that year.  The Year 2022 will be one of the lowest incident & fire years on record.  In fact, it thus far is the year with the least number of incidents, depending on the November & December stats.  But as far as goes its final tally for fires, that is projected to be about 18,000 to 19,000, if this chart (posted in November) includes the October fire statistics.  If the chart below only includes the stats up to September, then the projected sum total is 20,000 to 21,000 for the year.  This also is much less than the typical 40,000+ yearly fires that occurred between 1968 and 2004.

This was "as of September 2022."
 
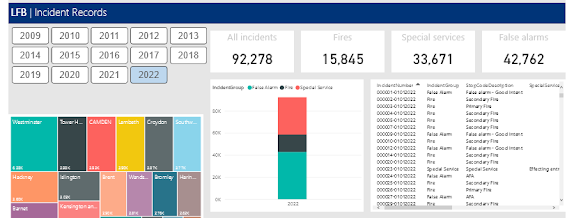
This was 2022 in its entirely; the fourth lowest number of fires in its record-keeping history.  Take note that there were 59,415 false alarms in the same year.

Below is the Year 2009.  It's posted here to show you that other years had many more fires than did the Year 2022, in addition to what the 2014 London Fire Brigade graph showed.  The 29,591 fires of 2009 are much more than the 14,929 fires of 2021 and the 19,297 fires of 2022.
 
 
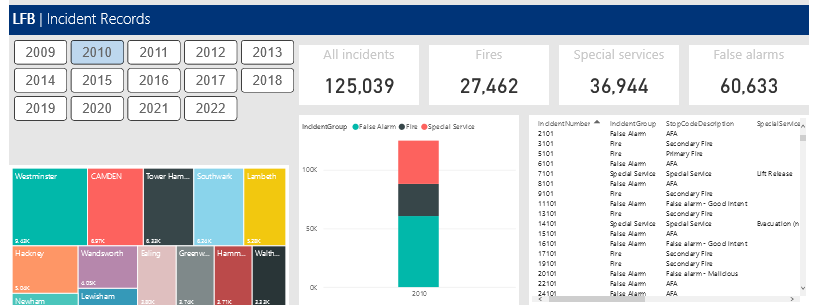
Below is the Year 2010, posted to show the same.   The 27,462 fires of 2010 are a whole lot more than the 14,929 fires of 2021 ... and the 19,297 fires of 2022.  Thus, there was no co2 saturation burning-up Greater London.  It was all a lie.

 
And of course, in order to show that there is no cherry picking going-on here, the Year 2011 is included.  Its fire numbers are also much higher than those of 2022, as well as 2021.  Thus, 2022 was NOT the tipping point in any capacity.  It was merely another year where the media once again lied to the public.
 
 
Many other years had averaged many more calls (incidents) per day than 2022 ... and 2011.  In fact, the Year 2009 had an average of 370 "incidents" (fire calls) per day.  After all, it had 134,379 incidents.  There has always been a high number of fire-calls ("incidents") in Greater London, in any one day.   There were 350 "incidents" throughout Greater London, in 2022.  The average daily incidents for the entire year of 2022 was 348.  That was typically average ... not a record-breaking day.
 
UK's 2022 crop yields also prove the London-is-burning-due-to-co2 alarm to be a false one.

Now, when you see a fire occurring near green grass and green leafage, the fire is not fueled by dried-out grass and leafage.  Moreover, being that the media claimed England to have been the victim of drought and heatwaves in the Summer of 2022, one would logically conclude that the 2022 harvests of the UK would be dismal crop failures.  Well, they turned out to be very healthy crop yields, thereby showing the July 2022 media members to be a cabal of sophomoric liars.  Observe:

No downhill sliding board here.  Steady crop yield pattern, with increases, since the Year 2000.

In 2022, the UK enjoyed an 8 1/2% increase in cereal grains.  It was simply that there was an approximate 1% less and a 1 1/2 % less moisture content in the harvested grains than average.  So, where is the great co2 disaster in Britain, during 2022.  The agricultural industry didn't see one, at all. 

None the less, wheat was up 11% and barley was up 6%.  The UK's main oilseed harvest was up by 39%, but the crop yield increase was only 17%, being that the UK used more farmland for planting its main oilseed crop.  In fact, the UK used 13% less farmland for oats, and the oats yield for 2022 was surmised (estimated) to be 10% less than last year.  Technically, this translates into a humble 3% increase for UK oat farmers, per acre. 

Conclusion:  There is no man-made-co2 driven climate catastrophe occurring in Greater London.  

Concerning the commercial media networks' claim that mankind has to aggressively rid the atmosphere of the industrial "carbon footprint," you need to understand the following facts:  The atmosphere is made of [1] 78% carbon-free Nitrogen, [2] 21% carbon-free Oxygen, [3] 0.93% carbon-free Argon.  Thus, the Earth's atmosphere is already at least 99.93% carbon-free.  
 
Know that the concentration of co2 in the atmosphere is so low that, for every 2,398 molecules in the sky, only one of them is co2.  One more time:  Outside in the sky, there is 1 and only 1 co2 molecule for every 2,398 molecules out there.  Round it off to 1 co2 molecule for every 2,400 molecules in the atmosphere. 
 
China, India, & Indonesia are the present concerns:  Not London.
 
The only valid present concern is whether the construction of multiple Chinese, Indian, & Indonesia coal power plants will result in the aggressive rise in atmospheric co2, or will there be carbon capture technology provided with each new coal plant.  An aggressive rate of rise changes the picture, moderately for the present --- but significantly for the distance future, as in the next century.
 
At present, there's not an immediate hysteric concern.  No scientist publicly claimed that the world is coming to an end, due to "greenhouse gases" in twelves or in 112 years.  However, the recent history of Beijing does not give humanity much trust in the ruling political political of today's China, not to mention the ruling parties of India & Indonesia.  So, we cringe, wondering what will become of the atmosphere in the decades to come.  
 
This is why hoaxes like the London one have to be ejected from society's concerns.  China, India, & Indonesia are what count.  Not London and not healthy Australia ... and not the American Southwest which got its share of monsoon rains in recent years.  Moreover, there is the issue with Mercury and Sulfur Dioxide when it comes to coal use.  That must be addressed more so.  BTW, refusing to go to high school in Sweden isn't going to help, at all. 
 
 
Qualifying Note:  The Sulfur Hexaflouride issue is the other important concern at present.  That one can still be proverbially nipped at the bud, though.  However, you don't jag around with something like Sulfur Hexaflouride.  You cut to the chase and get the task done.  The task is finding its substitute.   It's all too tempting for industry not to do so.

We proceed to 1901, 121 years before the July 2022 day placed under amplified attention by the media.  July 19, 2022 was presented as the unprecedented beginning of the End of the World.  The media claimed that it was a day unprecedented in the history of England.  They lied.  The truth is the climate is CYCLICAL --- unless something.   In as much, the Year 2022 was little more than the Year of the Great Deja Vu ... of 1922.  Enough newspaper photocopies on that year are already posted at thr Blue Mrble Album.  We'll go back further, to 1901, so that you can see that "this" has all been seen and experienced before, time after time.


Let's sail over to Italy, to see how it was doing in August of 1901.

It is often stated that "history repeats itself."  Well, that is the historically proven case, concerning Climate History.  And remember, in 1901 the co2 level was a mere 296 parts per million.  The co2 count was 121 ppm LESS than today.  It was 29% LOWER than today.  Yet, sweltering heat & much more dry drought-inducing heat occurred and reoccurred throughout the first four decades of the 20th Century than today.  This was when the co2 level was much lower than today.  

 In 2014, NASA declared that the worst drought year in the past 1,000 years was 1934.  The co2 level at he time was 309 ppm.  That's 108 ppm LOWER than today.  Yet, according to the Al Gore theory, 2020, 2021, and 2022 should have been the worst drought years.  Well, contrary to what the media claimed, Arizona & Nevada have been getting yearly monsoon rains.  This neglect of reporting the truth is the result of media's managers wanting to deceive you into thinking that we are trapped in a deadly circle of Dante's Inferno.  The truth is that we are doing nothing more than repeating history in a cyclical fashion.

In caveman days, the co2 level was 260 ppm.   And during recent heated eras, such as the Roman Warm Period & the Medieval Warm Period, co2 was only 280 ppm.  Today, atmospheric co2 is 421 ppm, and today's heat is quit  only a repeat performance of the past.  The two 1901 articles above are a small sample of the hundreds of pieces of documentary evidence which show that a rise in temperature is not dependent upon a rise in co2.  Rather, according to ice core analysis, a rise in temperature historically came first, resulting in added evaporation of ocean water and the simultaneous emission of additional co2 into the atmosphere.

Climate is a pattern --- not a week-long event or even a month-long event.  July 18th & 19th were the the result of a dry air mass from Northern Africa.   And yes, there were a couple weeks of no rain --- in July, when such a thing is likely to happen.  However, after July 19th, everything instantly went back to normal.  The "back-to-normal" part is the climate.  

To call July 2022 "unprecedented" makes knowledgeable people roll their eyes and say, "Give me a break, and cut it out with the theatrics."  After all, there was such a thing as the Great Fire of London in 1666, along with ~the Great Fire of Tooley Street, 1861, ~the Burning of the Parliament, aka the Palace of Westminster (which was a complex of buildings), 1834, ~the Whitehall Palace Fire, 1698, ~the London Bridge Area Fire, 1633, the first London Bridge Fire, 1135, ~the Southwark Fire of 1212, ~the Great Fire of 1087, ~the Great Fire of Aldgate which burned all the way to Ludgate and which included St. Paul's Cathedral, 961, ~the Fire of 120 AD, when the Romans ruled.  

And of course, there were the fires caused by Boudicca's rage.  Those were not atmospheric science issues.  In fact, the Great Fire of 120 AD could have been an act of war, as well.  None the less, calling the July 2022 London fires unprecedented invalidates a journalist, as much as does calling July 2022 a co2 cataclysm.  After all, the rise in co2 for the last 19 years was accompanied by a major decrease in London fires.

Now, Planet Earth has had atmospheric co2 at  levels 9 times and even 16 times HIGHER than today.  In fact, during the height of atmospheric co2, the Cambrian Explosion occurred, resulting in the emergence of multi-celled sea life.  And later in history, when atmospheric co2 was 9 times higher than today, the Ordovician Ice Age was in progress.  This assertion, of course, is all a matter of "ice-core proxy evidence," inter alia. --- (Inter alia means, "and other things.")  Incidentally, the "inter alia" included the stoma-count of fossilized leaves.  Stoma are openings in the leaves, where co2 is absorbed.
 
 Anyway, London had two back-to-back heat days, one week apart.  The first week comprised two 87 degree Fahrenheit days.  One week later, there was a 99 degree Fahrenheit day, followed by a 103 degree Fahrenheit day.  After the 103 Fahrenheit day of July 19, the temps immediately went back to normal.  But, the propaganda machines had a field day with Britain's sole 100+  Fahrenheit day.  Oh, it was Armageddon 3.0, the Apocalypse 4.0, and the End of the World, squared & cubed.

Needless to say,  it was everybody's fault, for riding in motor vehicles and keeping warm in the Wintertime, as well as using evil evil air conditioners in the Summertime. 

Below is the London Temperature Calendar, for July 2022.  Here's the London that was presented by the media as an overly heated inferno.  Show me where this super oppressive, long-term, human-body-killing heat is, in the London Summer of 2022.  Yes, there are a couple of weeks of temperature anomalies, in London.  But, there was nothing that resulted in the death phrases "may have caused" and "likely to have caused."  This was followed by a ridiculous number Paris experienced in 1976 & 2003.

And of course, there was so much misinformative hype about Paris in July of 2022 that it insults the intelligence.  Those news articles use the phrases, "likely to have caused" and "may have caused" a certain number of deaths that equaled the deaths suffered by Britain, during the first day of the Battle of the Somme.  None the less, deadly heatwaves, deadly droughts, deadly storms, deadly floods, deadly pestilence, deadly algae blooms, hurricanes, blizzards, cold snaps, Yellow Sky days, ice stacking, glacier growths, glacier meltdowns, etc, etc, etc.  It all happened throughout the past 700 years.  

The sophomorically trained and sophomorically educated journalists look for that one tipping point moment.   Climate is an habitual trend ... NOT a one-day, two-day or even two-week event.  Here, see the temperatures of July 2022 yourself.

In Celsius:

In Fahrenheit:


July 15, 2026

The actual Great London Fire Brigade Incidents Report of July 19, 2022, showing that the media lied to humanity, as usual.


Prelim Note: Photocopies of the official July 19, 2022 London Fire Brigade's Incident Report are posted below, at the end of this post.  Also posted within this post are other official London Fire Brigade statistical products that were published for public view.   Such a conveyance of information is known as "public relations."

Let's review another insult to the intelligence, compliments of the modern commercial media.  July 19, 2022 was the day.  A dry wind had been in England from Africa.  Such a thing will reduce humidity considerably ... but only temporarily.   Also, the high temp of the day was over 100F.  Eleven miles from London, for two hours, the temperature was 104F.   Elsewhere nearby, it was 102F.

The day prior, it was an equally rare 98F.  Even the week prior had a few days in the mid-80s Fahrenheit, for the high of each day.  Other than that, England had no dreadful climate condition.  It was far from Paris during its 1911 heatwave, its 1976 heatwave, and its 2003 heatwave, as well as Paris' 2022 heatwave.  None the less, the media had to hyper-exaggerate the weather in London, telling the world that life-given co2 was now burning down London.  The actual claim was that the rise in co2 caused London area wooden structures and wooded areas to be easily vulnerable to igniting and burning.

So, the media showed the video of a regular, ordinary, everyday, run-of-the-mill fires.  The narrator was mentioning that that fire was ignited because the atmospheric co2 level had risen to an intolerable level.  It was said that the London Fire Brigade (the LFB) had its most "incidents" since World War II. It was said that the fire brigade was sooooo overwhelmed that it couldn't keep-up with all the calls made to its dispatcher offices.

The bottom line ... the conclusion ... was that the world had now reached a tipping point, and that the number of fires throughout the 607 square mile terrain called Greater London would keep increasing, month by month ... and year by year ... until complete catastrophe would prevail.

Now for the truth:  You need to begin with the statistical graph below, produced and published by the London Fire Brigade, itself.  It shows that, as of the Year 2014, the yearly number of fires which occurred in Greater London decreased by more than 50%.  Greater London fires were cut in half.  This, alone, invalidates the July 2022 doomsday claim of media reporters who are apparently far too lazy to do a little homework, before opening their mouths and causing emotional trauma amongst schoolchildren, their moms, and people who never do any true fact-checking.
Now, record-keeping of the fire calls to the Greater London Fire Brigade ... and the results of those phone calls ... began in 1966.  As you can see in the graph below, from 1970 to 2005, there were at least 40,000 fires per year in the 607 square miles area called Greater London.  In 1976, there were over 60,000 fires.  And in the Years 1970, 1979, 1983, 1984, 1989, 1990, 1995, 2001, and 2003, there were more than 50,000 fires per year in Greater London.

In contrast, in the Year 2022, when the media claimed that London was now being overwhelming with increasing fires, there were only 19,298 fires in Greater London.  More impactfully is the fact that, in the Year 2021, there were the LEAST NUMBER OF FIRES in any one year since Greater London record-keeping began.  In 2021, there were 14,929 fires.  

So, let us compare:  60,000+ fires in 1976 vs 14,929 fires in 2021.  Moreover, 50,000+ fires per year in 1970, 1984, 1990, 1995, 2001, and 2003 VERSUS 19,298 fires in 2022.

Now, compare the fire states in the incident record below to the graph above.  A lot less fires during the year when the mainstream media very falsely claimed that Great London fires were now on the rise, due to co2.  Fires in each year of the 2010s & 2020s had become half of what they were in the 20th Century.  Also take note that, in 2022, there were 59,415 false alarms.
For the record, below is the year with the least number of Greater London fires, namely 2021.  In addition, there were 53,486 false alarms in 2021.  Thus, the July 2022 news reports about London catching on fire in great numbers was a complete falsehood.
Below:  And of course, we need to contrast 2021 & 2021 with an yearly year.  Well, the earliest available is 2009.  There were more incidents and fires in 2009.  There were also 62,991 false alarms in 2009.

Below:  The LFB officially reported that house fires have reduced "drastically" since 1981.  Thus, the 2022 claim that co2 levels reached a tipping point that caused London fires to increase is a complete lie.

Below is yet another publication of the London Fire Brigade which reported that yearly fires between 2010 to 2016 were much lower than those which transpired from 1970 to 2005.  The yearly fires from 2017 to 2023 have even been lower in number.   This also shows that July 2022 media to have been a gang of liars, in asserting doomsday claims that were the opposite of the doomsday reports.

Now for the temperature record of July 2023, one year later.  If co2 caused Greater London to reach a tipping point, then the temperatures of this past July have been alarmingly high.  Below is the July report from the world-renown Weather Channel.  Look and see for yourself if the July 2023 were a month of blazing heat or a month of moderate and quite tolerable temps.

Directly Below: 
The Month of July 2023 temperature report, by the equally renown Accuweather Corporation.

Added note: As far as goes the Summer of 2024, there was one day where the temperature reached 90F.  One 90 degree day is NOT the end of the world ... nor a climate crisis ... nor global boiling.

Below:  The actual July 19, 2022 London Fire Brigade Incident Report in detail.  Compare the statistical numbers of this day to those within the Years 1970 to 2005.  You will realize that in no way was July 19, 2022 the day of the most incidents or fires since WWII.  

In fact, count all of the FALSE ALARMS for that one day.  You will end up counting 142 ... for only one day.  Even at that, the number 142 is not far away from the usual daily number of false alarms ... the average ... the median ... the expected.