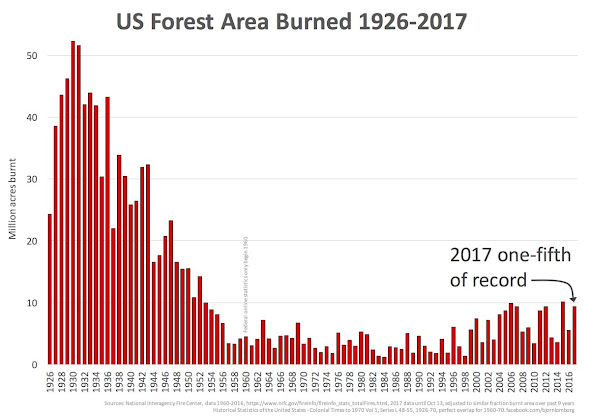
If you look at the official US Forest Service stats, you will see that, from the late 1920s to the mid-1930s, 30 to 50 million acres of forest land burned each year. This long-term phase of heat, drought, and fire necessitated the Smokey the Bear campaign.
None the less, look below at what caused convulsive responses by the CO2-obsessed climate activist faction, prompting its people to think of any excuse to make humanity believe that the statistical record below is false. Thus, we have cultic behavior at the behest of Al Gore and Michael Mann, along with several others who put a sizable amount of "congressional climate appropriations" into their various coffers, and doing so at the expense of the heavily indebted American taxpayer. Such a thing is usually regarded as Theft by Deception.
Now, the stereotypical pampered "indoor-environment" computer geek who was proverbially raised by cell phones claims that the 30 to 50 million acre per year era was achieved by "controlled burns." And of course, the first response to this arrogantly assured allegation is, "It that the best con job they could come-up with?" Let's dive into reality, for a change:
[1] In the 1920s and 1930s, there wasn't the manpower to cut perimeter paths for controlled-burns in what was basically the American Frontier.
[2a] In the 1930s, there was the GREAT DEPRESSION. How much government assistance was available? For example, the airplanes used for forest fires date back to 1915. But, they were only used for patrolling. Mankind did not yet have space age technology.
[2b] Incidentally, in response to those who say that airplanes were not yet manufactured for commercial or governmental use, remember that WWI was fought with airplanes, and that war endured from 1914 to 1918. Plus, the first US military plane was issued in 1909. Even Italy sent military aircraft into the air as early as 1911. So, airplanes were in existence during the era of the great American forest fires.
[3a] The era when America lost 30 to 50 millions of acres of forest per year was the era of the DUST BOWL, marked by brutal wind storms and extreme aridity. Dryness triggers forest fires. Wind spreads them. The 1930s were known for epic winds. Winds of epic magnitude make for epic fires. It's that simple.
[3b] In fact, the news reports of 1931 mentioned "extreme dryness." Textbooks described the weather as Sahara aridity. And concerning 1934, a few years ago NASA officially identified 1934 as the year with the worst drought in a thousand years. Thus, 1934 was the year of the thousand year ... dust ... storm.
[4a] All in all, 30 to 50 million acres of forest land was burned yearly in the United States, because there was no one in those deep rural areas to extinguish the flames, except for an overwhelmed few, unless a recruitment campaign ensued. The response of more than a thousand fire fighters was something that took time, and during the time taken, acreage of American forestland burned.
[4b] The yearly 30 to 50 million acre forest loss was also because the few people in those regions had no space age technology. For example, there was a devastating fire in Idaho and Montana in 1910. Well, in 1910, the population of Idaho was 325,000, and the population of Montana was only 380,000. There simply wasn't the manpower needed out West to stop the spread of forest fires. Do the math and you will discover how much and how badly the climate hysteria people are lying to you every time they publish something.
In re: The Author
The writer of this discourse personally knows what it is to be in the literal great outdoors, working under the Army Corps of Engineers, under the URA, and under other federally funded entities. The temperature range at these worksites went as low as minus 30F wind chill weather. But, none went above 97F.
None the less, the writer of this discourse knows what it is to be alone in the Mojave Desert at 102F, as well as being in Oklahoma in 106F weather ... and in Arkansas @ 104F. He also knows what it is to be in temps as low as minus 11F and minus 7F. He also knows what it is to have to drive through two history-making snow storms.
Even at that, throughout his entire life, he has been in 100+ degree weather for no more than FOUR TIMES ONLY. That's not much global warming witnessed by a guy who started his outdoor work in the early 1990s.
Oh, and for ten years, he lived so close to the Atlantic ocean that he literally heard the ocean waves at night, while in bed. And of course, he saw none of this "sea level rise." When you live on a coastline, you notice nothing more than high tide and low tide. Any sea level rise during that time was extreme petty.
In addition, the following discourse has been written by a descendant of Wyoming residents who were living there during the Dust Bowl days. That was when massive amounts of Western acreage went up in flames on a yearly basis. These fires occurred amidst a population too low in number to combat and quelch such massive forest fires. These fires occurred in the midst of aridity, and these fires spread in the midst of brutal wind storms of the 1930s. That is why the acreage burned was in the 30, 40, and 50 millions; not due to that which was claimed by computer geeks who were proverbially raised by a pack of cell phones.
Now, the Climate Hysteria activists have already been caught lying about:
[1] the July 19, 2022 London-is-burning-out-of-control con game.
https://www.london-fire.gov.uk/news/2020-news/february/fires-in-london-at-the-lowest-level-since-records-began/
[2] the Antarctica-is-losing-ice con game, being that the activists only spoke of a long thin strip of Western Antarctica outside of the Polar Circle, all the while keeping silent on the fact the Eastern Antarctica gained a tremendous amount of ice between 2009 and 2019.
https://www.bluemarblealbum.com/2023/08/661-gigaton-ice-gain.html
[3] the April 12, 2023 "Thousand Year" Fort Lauderdale rain exaggeration, by which Tampa had stronger rains in September of 1950 ... and elsewhere throughout America in recent decades. This includes land as far north of Pennsylvania, in the 20th Century.
https://www.bluemarblealbum.com/2023/04/april%202023%20southeastern%20florida%20rain.html
[4] the 101F ocean water farce of July 2023, when the water measured was run-off from the Florida Everglades near a Hwy 1 bridge that takes motorists into Key Largo. The true nearby ocean temperature of the day was 86F.
https://www.bluemarblealbum.com/2023/07/true-american-coastal-water-temps.html
[5] the very false UN claim that weather disaster casualties are on the rise, when the opposite is extremely true, especially in light of the fact that you live in ultra-modern society, and ultra-modern societies have the technology to save lives like never before. This includes the UN claim that deaths due to weather disasters are on the rise, when the statistical truth is the exact opposite, proving once again that the UN lies and lies and lies some more.
https://www.bluemarblealbum.com/search?q=11%2C000
[6] The Rio Grande in New Mexico having suddenly gone dry, for a five mile stretch of river, when the truth was that irrigation diversion routing ... for agriculture & crop yield success ... occurred.
https://www.bluemarblealbum.com/2023/06/the-great-rio-grande-%20river-lie.html
[7] that the Great Barrier Reef was dying, when it was recently reported that two of the three sections of the reef had the most coral cover in decades.
https://www.bluemarblealbum.com/2022/09/great-barrier-reef.html
[8] that the world was undergoing crop yield depletion, when the truth is that record high crop yields have been occurring throughout certain regions of Planet Earth.
https://www.bluemarblealbum.com/2023/08/2022-uk-crop%20yields-report.html
https://www.bluemarblealbum.com/search?q=crop+yield&updated-max=2023-08-30T09:30:00-04:00&max-results=20&start=5&by-date=false
https://www.bluemarblealbum.com/search?q=crop+yield&updated-max=2023-08-30T09:30:00-04:00&max-results=20&start=5&by-date=false
https://www.bluemarblealbum.com/search?q=crop+yield&updated-max=2023-08-30T09:30:00-04:00&max-results=20&start=5&by-date=false
[9+] ===> including Glaciergate, Africagate, the botched Resplendy "ocean-warming paper," and additional lies which have already been addressed at this Blue Marble Album ... and at Anthony Watts' tremendously successful site ... and in Tony Heller's weather history videos ... and at the CO2 Coalition site ... and during Dr. Tim Ball talks ... and at the No Tricks Zone ... and during Dr. Will Happer lectures ... and during "the Right Stuff" conference established by former Apollo NASA moon landing personnel whose intelligences are insulted by the Climate Doomsday Hype ... as well as the speeches of a number of Nobel laureates in physics ... and in library newspaper archives throughout the modernized world.
We now proceed to yet another Climate Hysteria claim made by those who will profit heavily, if their "assertions" go unchallenged & unchecked:
In September of 2021, the UN stated that natural disasters increased by 500% in the past 50 years, to the tune of 11,000 natural disasters. In the same report, the UN also asserted that deaths resulting from natural disasters DECREASED by 300%.
Now, forest fires are natural disasters, and America has been having at least 63,000 wildfires a year. In the Year 2000, alone, the U.S. had 92,000+ wildfires. Something is amiss in the UN statistics report, being that America has had millions of wildfires in its record-keeping history. The number 11,000 in 50 years is an extremely small number in the grand scale of things. Someone is manipulating the human psyche in New York City ... where the UN is headquartered.
Before anything else, take more than a moment to look at the chart below. It's the statistical average (per decade) of deaths due to natural disasters. Also keep in mind that "natural disasters" used to be called Acts of God, even in insurance law.
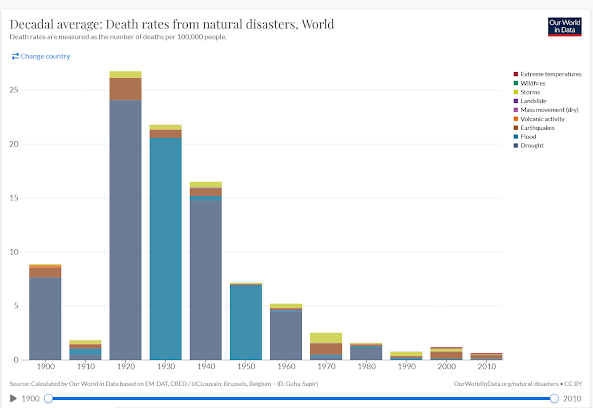 Deaths due to natural disasters mercifully plummeted greatly in the 1970s. The trend continued, even into the 2010s. The 2020s, of course, have only just begun.
The chart above proves that those stereotypical geeko nerdo dweebo scientists and their obsessive activists have been lying to you unconscionably. Disaster deaths are NOT on the rise, and even the UN admitted this in other venues. The UN simply states what it thinks will get it American taxpayer dollars or certain political power benefits. BTW, the American taxpayer is $32 trillion in debt, due to the irresponsibility of certain "career senators & congressional representatives" who would spend like 535 Marie Antoinettes.
Now take a look at the United States Forest Service stats, posted below. And yes, there was 5 times more fire acreage consumed in the 1920s, '30s, & '40s than in the equal amount of years leading up to 2021.
Now, you can fake a graph. But, you can't fake hundreds of years of newspaper archives throughout Planet Earth. If a chart, table, or graph is contrary to the news archives, then you have fraud.
BTW, there's an additional & partial reason why 1930 & 1931 had over 50 million acres burned. I'm not going to mention it, because I want to see if anyone out there is smart enough to figure it out. If someone does figure out why, I'll be super impressed. Thus far, I've not seen, heard, or read that additional reason. It's in front of everyone's face, and no one is noticing that one "additional" reason.
Also make note that the least amount of burnt American acreage in recorded history was in 1983. In keeping with their absence of honesty, the Biden administration started their revised graph at 1983, giving a tremendously dishonest effect to their predictably Orwellian revision of things.
In keeping with the US Congress's & UN's absence of honesty on climate, below is a photo of the Great 1910 Fire's aftermath. It's posted here, because nobody in his right mind would believe that "controlled burns" were done in sparsely populated states in the 1910s or 1920s or 1930s, next to any building ... especially a brewery .. during long-term drought weather.
For those in the American public school system, know that the effect is that the revised "burnt acreage" graph makes 1983 look like an average year, with the following years looking like the fire acreage numbers started an out-of-control & uphill climb into the total annihilation Planet Earth forever. Well, the fact is that climate is cyclical and there were many far worse fire years in America than today. They occurred from 1928 to 1943. The forest fires haven't gone beyond the 10 million yearly acre range since 1952, showing a measure of climate stability hovering around an equilibrium number.
In sequence, if the graph in focus concurs with the newspaper articles of the time represented on the graph, then you have an honest graph made by honest people.
Therefore, search through American newspaper archives, from 1928 to 1943. See what appears in those archives, when it comes to forest fires and even heat waves. I started your ball rolling, by providing a number of news articles of 1929 and the 1930s. They ARE in synch with the above-posted graph-chart. Therefore, the chart above --- that graph above --- is the Real McCoy, proving the most vocal climate activists to be complete liars.
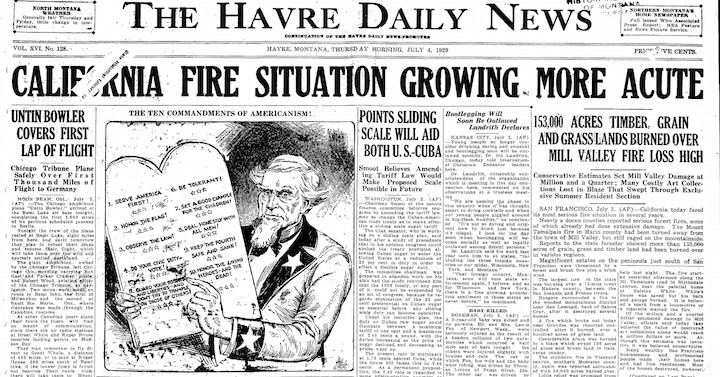
We can start with the October 3, 1933 Griffith Park Fire, in Los Angeles, California, when the co2 level was 309 ppm --- 108 ppm LESS than today, thereby showing you and everyone else that co2 is not the igniter of forest fires, especially those fires as massive as the numerous ones of the 1930s.
.png) |
Now remember, this is 1933. When the California wildfires cease, then you have climate change.
|
|
 c c |
Once again, this involves 1933 California, when the co2 level was 108 ppm LOWER than today. If you believe that controlled burns were done near major cities and municipal playgrounds ... endangering human life ... then you are completely mindless and have become Al Gore's and Michael Mann's most useful idiot. You will be counted amongst the ultimate jerks in history. This is because, if you can get people to believe outrageously absurd claims, then you can get them to perform outrageous absurd acts.
|
Below: It's a link to a short and concise article in Colus Herald. It's a report on the wildfire conditions of the entire state of California, as of July 28, 1931. There is no photocopy of the news article posted here (at the Blue Marble Album), to prevent a potential copyright hassle.
https://cdnc.ucr.edu/?a=d&d=CSH19310728.2.24&dliv=none&e=-------en--20--1--txt-txIN--------
Below: Links to Healdsburg Tribune, September 1936. Photocopies of the two cited articles are not shown here, to avoid potential copyright issues.
These are two articles about two California counties. One article addresses seven
simultaneous fires occurring in the same one California county, in 1936. Thus, the recent California fires are nothing
new. It's the same old same old, for a California which has been 40% desert
for a time span longer than the existence planes, trains, & automobiles.
When the
California wildfires cease, then you can call it Climate Change. At present, it has been Climate-Business-As-Usual in the State of California which happens to be 40 % desert. The newspaper archives are the pieces of evidence to show whether this is a true statement or not. Starting with the Year 1929 is advisable.
https://cdnc.ucr.edu/?a=d&d=HT19360922.2.19&dliv=none&e=-------en--20--1--txt-txIN--------
https://cdnc.ucr.edu/?a=d&d=HT19360921.2.12&dliv=none&e=-------en--20--1--txt-txIN--------
In addition, there is the general report of California wildfires for 1929: Organized Labor, Volume 31, Number 9, 1 March 1930 — 1929 FIRE RECORD FOR CALIFORNIA. No photocopy of that article is posted here, out of respect for copyright law, concerning the holder of that article. None the less, it begins as follows:
"More forest, brush and grass fires occurred in California during the notably long, dry season of 1929 than in any previous year since organized fire protection has been in force in the state, according to the combined report of the United States Forest Service and the Division of Forestry, State Department of Natural Resources. A total of 4,803 fires which burned over, 1,153,462 acres and caused damage amounting to $2,773,245 was the past year's fire record."
https://cdnc.ucr.edu/?a=d&d=OLSF19300301.2.42&srpos=2&dliv=none&e=-------en--20--1--txt-txIN-1929+forest+fires-------
Let's continue with the West Coast in 1929, from the publication, Disastrous fire weather of September, 1929. Charles I. Dague 1930. Monthly Weather Review. 58(9):368-370. During the first eight months of 1929, Washington State was doing quit well.
"The outstanding features of the fire-weather season for 1929 were its
extreme dryness, its length, and the heavy fire losses in September, and
subsequently thereto, west of the Cascades in Oregon and Washington. It
was by far the most severe and most strenuous season within the history
of organized forest-fire protection in these two States, and probably
for as far back as we have any record or knowledge of forest fires for
these sections."
Below: Spokane area, August 1929
Also in 1929 was the Half Moon Fire, in Glacier National Park, Montana. Glacier National has had up to 64 fires in a year's time (1936). It had as low as zero fires in a year, also (1964).
 |
July 4, 1929
|
Now add the 1930s to the equation, as well as the first part of the 1940s. In fact, below are two more pieces of evidence which show that the Biden People are very dishonest in claiming that there were no great wildfires or heat events in America, until the late 2000s. Joe Biden has been known to be a public liar as far back as his failed candidacy, in the 1988 presidential election. Liars only appoint liars to their staffs.
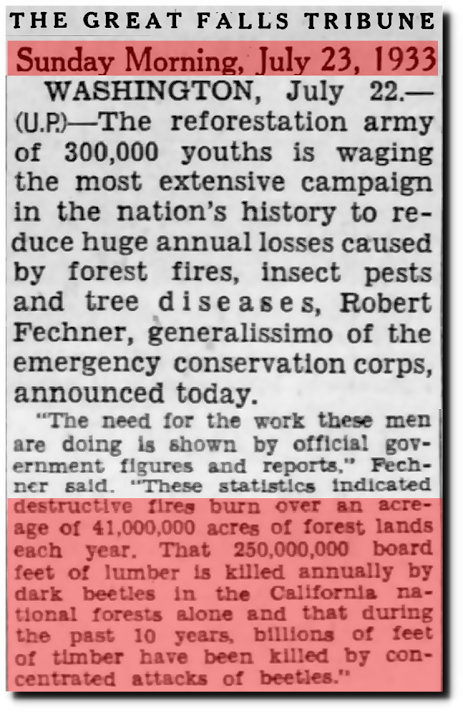
Article below: It specifically states that America had been losing 41,000,000 acres a year, due to forest fires --- in the years preceding 1933.
Also take note that California was losing an additional 250,000,000 board feet of lumber, per year, due to the dark beetles. That was real, also. Quick Note: California has 124 species of beetles. There is the Darkling Beetle, the Bark Beetle, and the Black Beetle. This was the case in the 1930s, also. We continue ...
The Earth's climate has not been a Candyland bordered with ribbons & bows in the past 200 or 2,000 or even 4,000 years. Certain worthless individuals claimed the climate to have been perpetually mild for a thousand years. Well, not is the last thousand ... and definitely not in the past 2,000. There has been suffering and the need of heroism --- and foresight --- and diligence --- throughout that time span.
Wake up. The woke movement put you to sleep, in a hypnotic trance. You want to be in control of your life, instead of being a repressed mynah bird for money-grabbing politicians and activist bullies. Wake up and walk away from it all. Your environmental needs involve the glut of synthetic chemicals in modern life and the pathetically insufficient response in the Lautenberg Chemical Safety Act. That law is equivalent to removing 20 cars from a high-speed highway, and then telling children and the elderly to cross the highway, all the while assuring them that there won't get hit.
A
certain present-day climate activist expressly stated that the US
Forest Service fire graph of the 1930s was untrue. He stated that fires
so vast in acreage did not ever exist at any time in United States
history. Show him these articles, and tell him to watch what he writes.
It can get very expensive for him, in legal fees, because such geektoid,
nerd-boy activists commit defamation in their very anti-factual
writings.
In
review, if ten million acres or less burn in the course of any one
year in the United States, then it was a low year for fires. Five million acres is chump
change. It's equal to coins lost between seat cushions. It's no end of
the world, and don't let today's untrained politicians convince you
otherwise.
Concerning the 11,000 number used by the UN
Of course, the quick counterpoint is to cite the United States forest fires for any one year alone. Let's take five sample years, five years apart:
In the sample Year of 2000, the United States had 92,250 wildfires which consumed 7,393,493 acres of land. In 2005, there were a total of 66,753 wildfires which burnt 8,689,389 acres. In 2010, there were 71,971 U.S. forest fires, and in the Year 2015, there were 68,151 of them. And then, in the fifth sample year of 2020, the United States had 58,950 wildfires which turned 10,122,336 acres of American land into ash.
The
recent average of American wildfires has been 63,000 to 71,000 per
year. Each individual year in recorded American history is much larger than the 11,000 UN
disaster number used in its 2021 report. And remember, the 2021 report was a fundraising ploy.
Now, wildfires ARE natural disasters. So, why were
the American forest fires of the past 50 years omitted from the UN
statistics? Would it have anything to do with the high frequency of
disasters making disasters look so commonplace that
no politician would want to shell out billions more to the UN? That September 2021 report was a sales pitch for taxpayer dollars and corporate donations, not to mention the tax dollars from other nations.
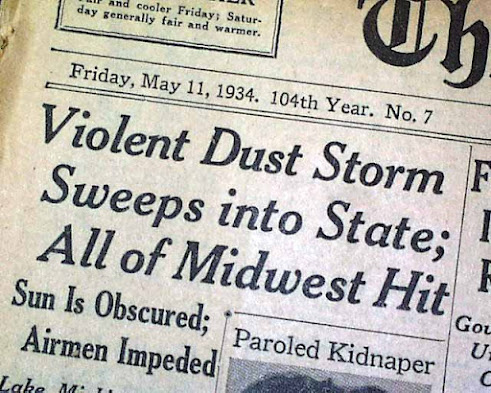 |
It wasn't only Kansas, Toto, that got hit.
|
Even at that, the great asininity of having our lives run by natives of the Third World is this: If you can't run your own country, as it stays in poverty, ruins, and mismanagement, then you sure as Hell cannot run the entire world. You will simply turn the whole world into a Third World country.
Moreover, the UN's 2021 natural disaster assertion was presented with sleight-of-handed deceptiveness, in that 91% of all disaster deaths that occurred in the past 49 years were citizens of Third World Countries. Well, third world countries have something called monsoons which bring lots of water.
Plus, there are Third World Countries aligned along the southern Pacific Rim of Fire, where volcanic activity persists. Oh, and then there is the matter of historic tsunamis. Guess where they usually happen. Let's not forget about nations filled with desertland. Include war refugees falsely being call "climate refugees." All in all, people bull-crap it up, where the bullets don't fly. The Third World has child soldiers, and activists are obsessing themselves with CO2 instead. The whole world is being run by the most asinine buffoons in history.
As a general rule, Third World countries do not exist wherever it snows, being that work is require to survive Winter weather. This includes engineering and inventor work. None the less, the implied claim is that the Americans put the Third World in climate peril in the first place, with its use of combustible engines and the use of a massive electrical grid. Thus, the message is that natural disasters are all America's fault, and America has to pay for them. India's and China's massive use of coal seems not to be causing any problem, though. Only Americans. Everything is always America's fault.
Countermeasures of Data ... Stats ... Recorded History
Throughout the Blue Marble Album,
there are posted a number of exhibits of evidence which show the
opposite of what was predicted in the 1980s and 1990s, concerning Planet
Earth's climate. It began with NASA's Jim Hansen in June 1988. After
all of his doomsday predictions ...
[1] record high crop yields have occurred from time to time throughout the world; even in Australia and India. [2] The
Great Barrier Reef has undergone significant replenishment in two of
its three sectors. [3] The Maldives & Lower Manhattan are still
above water. [4] Jackie Robinson Ballpark and the
nearby Daytona International Speedway are both well above Atlantic
ocean water. [5]
And Barrack Obama's oceanside mansion in Massachusetts is well
above Massachusetts seawater.
[6]
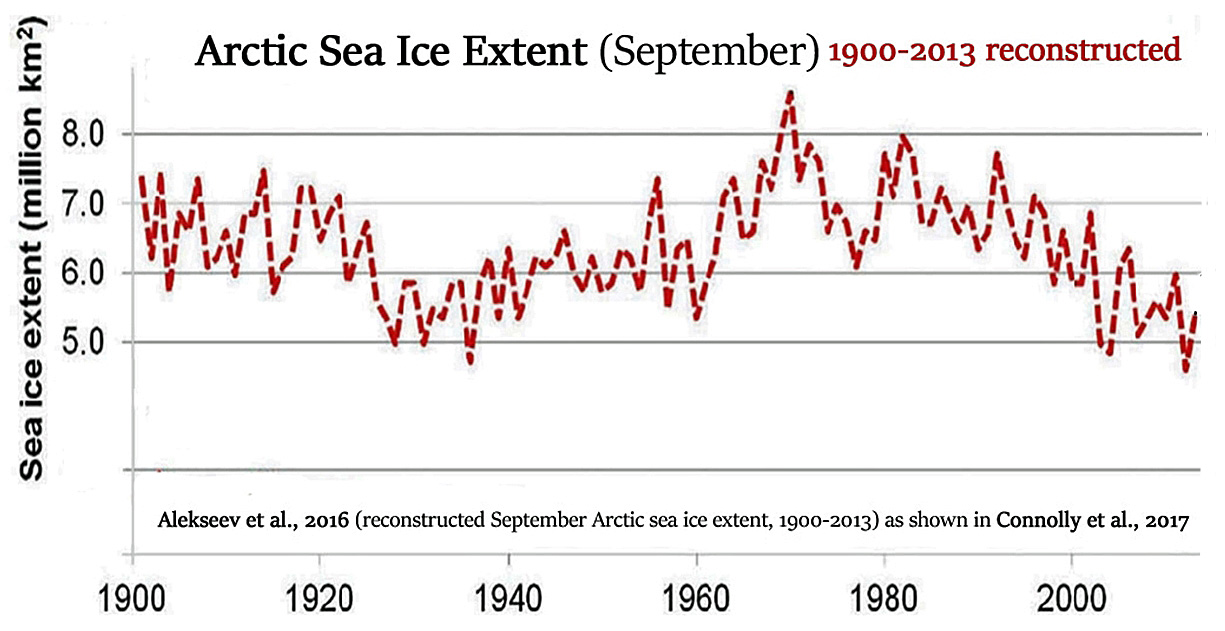
Glaciers are still arrayed throughout Montana. [7] At least 1.32
million square miles of ice have remained in the Arctic Ocean at the end
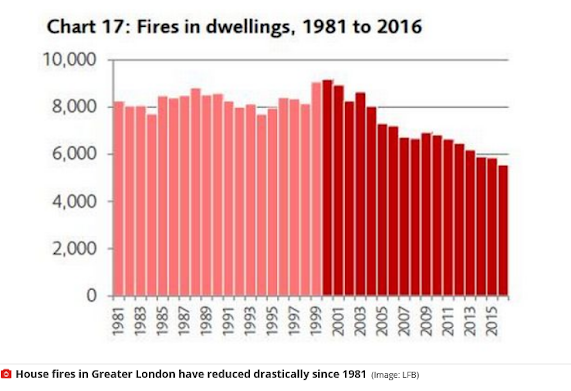
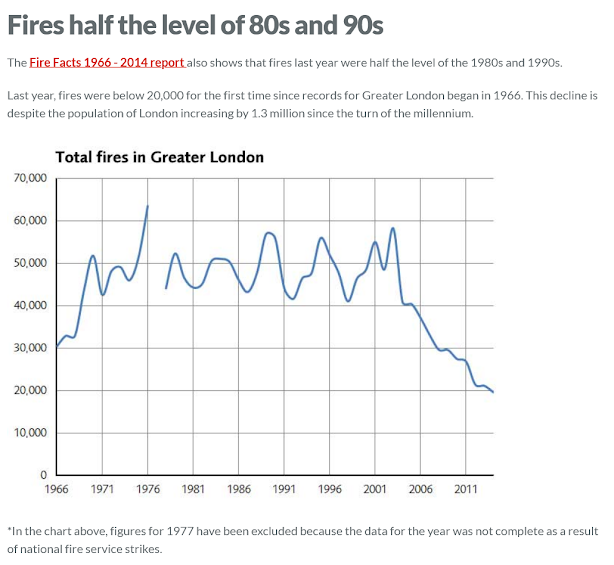
of each summer. [8] Greater London has been getting half the fires it
used to get in the 1970s, 1980s, & 1990s. [9] Antarctica had its
coldest winter in known history, in 2021. [10] And in 2015, New Zealand
scientists found the bottom of the Ross Shelf to be crystalizing with
ice, instead of melting-away.
See: Short Natl Geographic video on ice crystalizing at bottom of Ross Ice Shelf
Likewise, evidentiary support was abundantly posted throughout Blue Marble
which showed that horrendous climate disasters occurred throughout the
centuries, when the atmospheric co2 level was almost as low as it was
during caveman days.
And as an example of today's climate fraudsters ...
... the Blue Marble Album
posted pertinent LFB (London Fire Brigade) statistical charts &
graphs, showing that there have been far less Greater London fires TODAY
than there were when record keeping began in 1966, as well as in 1986 and even in 1996.
Shown
was the fact that there has been a steady, downward trend in Greater
London fires, beginning in 2004 and continuing into 2022. It thereby
showed that the July 2022 news reports about co2 causing London to burn was a blatant fraud. All persons involved in those news reports must be fired ... and sued.
Greater
London used to have an average of 40,000+ fires a year. A steady
decline began in 2004, while the atmospheric co2 level kept rising. The
downward trend resulted in there being only 20,000 London-area fires
one year, followed 18,000+ and 17,000+ in subsequent years.
The
bottom line is that the 610 sq mile London Vicinity decreased
significantly in its fire events, while co2 levels kept rising. This is
proof that co2 did NOT catch London on fire in July of 2022, as was
ridiculously claimed.
Worse
than reporting such a hoax was that of instantly believing it to be
true, in the spirit of a happy-go-lucky simpleton. Such politicians as those who believed this blatant farce need to be removed from their governmental positions. They were a deja vu of SNL's Irwin Mainway's Sucker Showcase, starring the literally high IQ Steve Martin, screen star Dan Akroyd, screen star Laraine Newman, and Tony Award winner Gregory Hines.
Outrageous claims
need to be tested for cracks and holes. It took me minutes to find the
cracks in the London fire hoax. That is how sophomoric today's news writers are. It's not a
matter of them being unprofessional as much as it's a matter of them
being anti-professional.
Here. Look for yourself. Al Gore managed to become as successful with his youths as Hitler was with his. Both types of youths became obsessive & violent fanatics. After all, did or did not someone fire rifle shells into the office of satellite experts Roy Spencer and Jeff Christy? Did or did not the Hitler Youth take part in Kristallnacht? Always remember:
1} They first burned the books. 2} Then they burned the Jews.
The Internet censorship done by Twitter, etc is the modern version of book burning. Guess what's next. It already started by Biden's AG targeting parents who go to school board meetings. If you're going to do that, then why have school board meetings? Look below and see how much of a bunch of liars the modern media has been in hiding from you the official London Fire Brigade graph posted below.
We adjourn from fire to water
The secretary general of the World Meteorological Organization stated in 2021 that "climate and water extremes will become more frequent and severe in many parts of the world." This statement was followed by a Summer of drought, thereby showing that the secretary general is NOT a prophet with his watery predictions.
Furthermore, this water disaster prediction goes back to Jim Hansen and June 23, 1988, during a senate committee hearing. Climate activists sound like vinyl records that skip and skip and skip again.
Concerning this, one climate activist representative mentioned why the storm surges will get worse in Manhattan. He stated that storm surge into Lower Manhattan will be worse, because the sea level has risen. Well, the official stat is that sea level rose 2.8 inches in the past 40 years ... and 7 to 9 inches in the past 140 years. It's hard to take someone seriously, when the State of Liberty's base remains well above water ... along with all the walkways along the Hudson Bay.
The truth is that storms ... and their follow-up tidal waves (aka "storm surges") ... will only get worse if the barometric pressure of a cyclone decreases, while shearing simultaneously decreases. That is to say, the Manhattan storm surges will only get worse, if you get a Typhoon Nancy (1961) to pay a visit to the Statue of Liberty.
More important is the fact that history has already had tremendously deadly "water extremes" which occurred when the atmospheric co2 level was not much higher than during caveman days. This mostly included the 16th, 18th, and 19th Centuries, along with 1927 America.
BTW, the famous Johnstown Flood was a 19th Century disaster which happened in May of 1889. It was the movie which came out in 1926. BTW, the real flood had a real sequel in 1977. It killed 84 and cost $340 million.
Natural disasters and the history of Planet Earth go hand in hand. Blaming Americans for everything unpleasant is not a smart thing to do, being that devastating disasters occurred before America became a sovereign nation. Natural disasters are not things that newly arose after the invention of the combustible engine and the electrical grid.
And predictably enough, the final comment of the U.N. report concluded with the head of the United Nations Office for Disaster Risk Reduction reminding folks such as the U.S. taxpayer that there is a need for great INVESTMENT in comprehensive risk management. This means money, money, and more money out of the U.S. taxpayers' heavily indebted pockets.
In as much, if you insist on leeching off of the U.S. taxpayer, then let the American taxpayer take-over your country and operate it, thereby making sure that the money won't end up in the hands of thieves that pose as politicians & activists.
 |
America knows a little bit about how to not turn a nation into a Third World Country.
|
On the positive number side, record high crop harvests, crop production, and crop exporting has been occurring in cyclical intervals, especially in 2021. Links to those official announcements, with occasional official charts, have been posted at the Blue Marble Album, too.
Now, the prediction by the AL Gore & Jim Hansen People was that rising co2 levels would lead to crop failure. Well, co2 levels are deliberately increased in the greenhouses of professional growers, for the sake of having abundant crop production. In fact, if you want to go green, increase the co2 in the atmosphere.
Co2 paranoia is the most asinine hoax in human history. Belief in it is especially asinine in light of the obvious observation that 71% of Planet Earth is covered by water. Therefore, it is only logical to find that 90% of all greenhouse gases (by volume) is WATER VAPOR!!!!!
Newsflash: Water Vapor has ZERO carbon-footprint. The 78% nitrogen in the sky has zeero carbon footprint. The 21% of oxygen in the air has zero carbon footprint. The 0.93% Argon in the air has zero carbon footprint. The neon, the helium, the hydrogen, and the krypton in the air have zero carbon footprint. In fact, the Earth's atmosphere is 99.934% carbon-free.
Americans, please wake-up. Al Gore was never a scientist. He comes from the South which was known for its chattel slavery, lynch mobs, anti-Catholicism, pellagra, low literacy, lead-poisoning from moonshine, and tobacco plantations. You are allowed to step back and think. Start now.
 |
This will make for some good snaking for those climate refugees pouring out of Australia. Oh wait! Australia had its record high healthy crop yields recently, just like India's rice production and multiple American crop yields. Silly me.
|
 |
Okay now. Show me where the Greenhouse Gas End of the World is here. Me no can see.
|
|
 |
Look at all that Climate Change doom. Wait. What change? It's the same old American Productivity that's been going-on since the US won WWII in 3 theaters of operation. Nothing new here, folks.
|
Caveat: In 2022, US wheat production was down 8%, and other crops made slight dips in otherwise healthy crop yields. It's not the end of the world, but the climate clown show will make it appear that way. This is ironic for those people who, in their being without talents (without skills), are totally inexperienced in life - - - arrogant activists who never lifted a finger in any grain field, and who have never produced for you as much one grain of wheat. But they know everything ... except for not knowing how to do anything.
By the way, grapes can do well in heat waves and droughts. French grapes did well in 2022 --- in certain parts. All parts claim that the quality is good, but in two sectors particularly, the quantity is low. None the less, all grape harvesting in Europe was done 7 to 14 days earlier than usual. And the biggest news is that, in the Year 2022, champagne producers "seemed to have" experienced record sales. The Year 2021 was a year of record high sales in champagne, also.
https://www.thedrinksbusiness.com/2022/12/champagne-producers-expect-to-celebrate-record-sales-in-2022/
One more reminder:
It was in 2021 when Antarctica had its coldest winter on record. Even CNN reported this. That was a rare occurrence, being that, on commercial TV, all that a person hears is --- "the burning of fossil fuels," followed by "racist this and racist that," additionally followed by "Orange Man Bad." It's tiring. Grow up, media moguls.
The U.N. Writers Need to Study Math & Algebra
The first algebra-mathematics lesson is this: The American taxpayer of off whom numerous nations have leeched has no more money to spare. The United States is over $32 TRILLION in debt. There is no money left to give to the typical political activist con artist. You've drained America dry, and Chinese money has predatory loan strings attached to it. That would leave you with Russia and its petrol sales profits, if Russia weren't getting shredded like wheat in the Ukraine.
They keep telling us that the World is coming to an end tomorrow and the tomorrow after the next one and the tomorrow after that one.
Let's address the very lame claim that there are more severe and more numerous natural disasters today. It's not even close.
Example 1 is the list of the deadliest Atlantic Ocean hurricanes. The vast majority of those deadly storms occurred long before the turn of the Millennium. Only Hurricane Maria was a 21st Century storm. Other years of the most deadly storms included 1775, 1776, 1780, 1900, 1909, 1928, 1963, 1974, 1998, & 2017. Modern technology made the climate less deadly. Plus, most of these deadliest of storms occurred when co2 levels were much lower than today.
 |
Ben Franklin was literally alive during THREE of the most deadly Atlantic hurricanes.
|
Now, look at the list of hurricanes that had the least air pressure. Keep in mind that average air pressure at sea level is 1013.2 hPa. Incidentally, hPa stands for HectoPascal air unit. It's also known as a millibar.
Anyway, take note that THREE of the lowest air pressure hurricanes came in the same year --- 2005. Now you see what motivated Al Gore into releasing his climate hysteria movie in 2006; those three hurricanes.
The problem is that no hurricane after 2005 had a hPa as low or lower than the hurricanes of 2005 --- and there would NOT be another major hurricane to make landfall upon the Continental United States for eleven consecutive years after that movie's release --- and that there would not be a Category 5 Hurricane making landfall in the Continental 48 States until 2018. Gore's timing was a tad bit off kilter.
As far as goes deadly droughts that transpired during low co2 periods, there was the Great North American Drought which transpired from 1279 CE to 1299 CE. There was then the Tudor Drought of 1540-41 and the 1616 Drought which preceded the 30 Years War. Then comes that which was set in stone ... namely the
The Drought of 1790 was deadly to India. The Drought of 1791 hit the newly formed United States. In fact, the American Civil War was fought during a prolonged drought that began in 1856, six years before the attack on Fort Sumter. Then came the Great Famine of 1876-1878, as well as the Bihar (Bengal) Famine of 1873 & 1874. These were years when co2 levels were very low; 288-290 ppm. That's 130 to 132 ppm LOWER than today. Those droughts were severe. There were several more.
Being that atmospheric co2 was too low in content to have caused those droughts, co2 did not cause them. If co2 didn't cause those droughts, then co2 didn't cause the recent ones, either. Droughts span throughout centuries of time. They didn't start in 2022. But, some of them stopped in 2022, ironically enough.
Example 2: You perhaps looked at the USFS graph which displayed the official wildfire acreage from 1926 to 2017. And of course, it shows that there were 5 times more forest fires in the 1920s, '30s, & '40s than in the equal amount of time leading up to today. So, for the record, 650 MILLION acres burned during the 17 year span of 1926 to 1943. Meanwhile, only 133 million acres were burned during the 17 year span of 2004 to 2021.
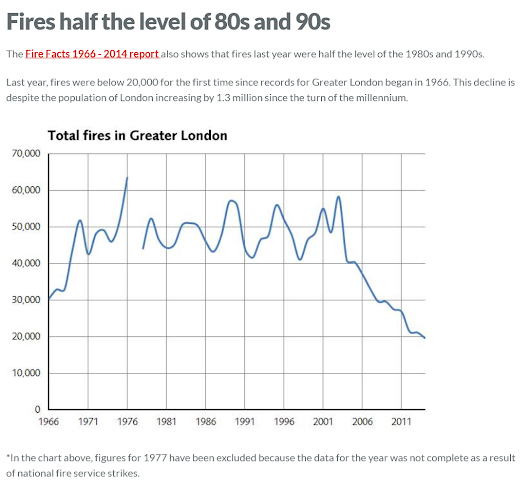
FURTHERMORE, the statistics & press-releases of the London Fire Brigade attest to the reality that Greater London Fires, by the Year 2014, were already occurring at half the frequency as in the '70s, '80s & 90s. The chart looks like a sliding board, in displaying the decrease of Greater London Area fires.
Between 1966 and 2021, Greater London averaged between 157 and 56 fires PER DAY. London has always been on fire. From 1966 to 2021, Greater London had at least a total 935,000 fires. Which one of those fires were counted by the U.N. as weather disasters? Any fire that occurred on July 19 in England was declared as such by the media. And it was all another media lie.
The first question: What constitutes a U.N. weather disaster?
If
the U.N. claim of 11,000 disasters is true, it means that there was an average of
one disaster every 40 hours, for 50 consecutive years. This translates
into 4 weather disasters every week for 2,600 consecutive weeks
(50x52=2600).
This
also translates into 18 weather disasters every month, for the past 600
months. Now, where is all the archived newspaper, magazine, and TV
coverage on these events? The phrase, Weather Disaster, is understood to
mean "Front Page News" --- "Once in a lifetime" event ---
"your-life-will-never-be-the-same-again" event, much like war.
A
weather disaster is assumed to be a special occurrence which deserves to
be reported & published . . . in the newspaper. So, where is all
the newspaper coverage for 11,000 incidents?
Methane & N2O: Insignificantly low atmospheric quantities
The U.N. harped on the greenhouses Methane (CH4) & Nitrous Oxide (N2O),
as if they were the other foreboding presences in the atmosphere to monitor with diligence.
Well, Methane has 28 times more power in capturing infrared heat than
does co2, and Nitrous Oxide is reported to have 265 - 298 times more
atmospheric heating capacity than co2. The cancel-out factor is this: There's not enough N2O or methane in the atmosphere for them to make any difference in anything.
Here's
the reality check ====> Methane exists in the Troposphere at 1.909
ppm. That's One Point NINE O NINE parts per million. Nitrous
Oxide exists at 1/3 part per million (aka one part per three million,
aka 330 parts per billion.) Climate Doomsayers always withhold & even hide decisive facts. That's the sign of deliberate liars acting in tandem.
Africa
Now,
it was the Climategate Emails of 2009 which showed us that temperatures
in certain African regions were made-up. In fact, there were record
high temperatures being recorded about Africa where there were NO
WEATHER MONITORING STATIONS. Are those fake African temperatures
counted among the 11,000 alleged weather disasters of the past 50
years???
It's Brain Cell Usage Time
Do
you remember in 2003, when almost every American believed with assured
certainty that there were Weapons of Mass Destruction in Iraq? In the end, no one found any such weaponry. It was one big lie.
Do you
remember reading how solidly the 1930s Germans believed every damning
accusation leveled against the Jews per se? An entire nation of Hitler believers did
all they could do to do away with every Jew on Earth --- except for the
occasionally defined "noble Jew."
Even
in matters of science, do
you remember reading how "the science" affirmatively assured humanity
that every ulcer was the result of emotional stress, when the truth was
that the Helicobacter Pylori Bacteria causes ulcers?
Do
you remember "the science" proclaiming that brain damage is permanent?
Then came the hippocampus being restored in patients. Also came the
discovery that the brain can be replenished with Brain-Derived
Neurotropic Factor.
Then there is the matter of the
original assessment of cigarette smoking ladies --- that they only
smoked out of a desire to be a man, instead smoking on account of the
addicting power of nicotine.
Include "the science" claiming that it's impossible to naturally unclog arteries. Then came the discovery of the Vitamin k-2, aka M-7, in literally dissolving arterial plaque. There is also the matter of autophagy individually, and even the serrapeptase enzyme, if done with prudence.
All
in all, when foreboding declarations are made, test them for cracks.
In fact, discern the motive of the people making the melodramatic
allegations. A lot of
times, the motive is money, as well as TV networks trying to improve
their ratings. Of course, networks seek to improve their rating for
money.
In
light of the aforementioned thoughts, a reasonable person would
conclude that any or all of the disastrous weather events counted by the
U.N. as being caused by greenhouse gases should not include any event that happened in the midst of MONSOON
SEASON, being that monsoons are naturally occurring events which help rice crop harvests, and other grains planted after Monsoon season. This is because, no matter what be the co2 level, the monsoons are coming. Even England has monsoons which are referred to as "the Return of the Westerlies." This explains the iconic British gentleman clad with an umbrella.
Also not to be counted as natural disasters caused by greenhouse gases would be landslides that result from decades of erosion, while a monsoon was in progress. In fact, any flooding that results from land
grading
projects and the such must also be excluded in the UN greenhouse tally sheet.
In some parts of Planet Earth, without a monsoon, people starve. Monsoons save lives. Simply be as careful when around a monsoon as you would be when around a swimming pool or a lake or a creek or a river or a cistern or a bath tub or a concrete dam or a beaver dam or a rain barrel.
You know, the U.N. has its
ulterior motives, too. The motive is to reach deeper into the United
Stated taxpayers' pockets and pull out as much money as possible, even for
Third World Nations. All that the U.N. needs to do is be honest and ask
for charity dollars. It didn't have to create nightmarish hype equal to
the Orson Welle's War of the Worlds presentation.
Even at this, Orson Welles' Halloween Eve show of 1938 didn't have the audience size that TV script writers in future decades would make it out to be. There was no crowd hysteria in NYC. In fact, the C.E. Hooper poll takers reported that only 2% of the radio audience was listening to it, being that the majority was listening to the Chase & Sanborn Hour, instead. The media always has to sensationalize things . . . for ratings. Anyway . . .
Monsoons
are naturally occurring and regularly occurring. CO2 is NOT a factor
in them. Each monsoon is the result of one of two factors. One is the tilt of the Earth and high pressure air entrapping
moisture for an extended period. Another is the fact that there is a yearly latitudinal shift of the Twin Intertropical Convergence Zones, from the Equator to the middle of India and other places throughout Earth. And concerning the tilt of the Earth, this is the
sole reason for the four seasons.
Tsunamis
must not be counted as disasters caused by greenhouse gases either, being that earthquakes are not triggered by
any atmospheric gas. They are triggered by tectonic plate motion.
Wintertime
events must be excluded from any greenhouse tally sheet, too, even though the
Global Warming political wing started to blame record winter weather on Global
Warming. This is only possible when a snowstorm comes nine days or less
after a heat wave. Northern heat waves are usually in June, July, and
August. Northern snow storms are usually in December, January and February. That's
much longer than nine days. None the less, co2 levels have been claimed
as the instigator of every misfortune by climate racketeers, including record cold.
More People = More Infrastructure = More Financial Loss when the Big Bad Wolf Strikes
Any
disaster is more costly today, because far more people live on Earth
and inhabit areas visited by turbulent weather events, such as the
coastline, regions near ample waterways, & monsoon regions. More houses and building are at those places.
BTW,
proof that there is a Climate Change Con Game in progress is in the
observation that the prices for coastline property are still in the
upper echelon level. If people believed the Al Gore horror story of
rising shorelines, there would have been a mass exodus from all
coastlines.
In addition, there still has not been the adding of the "Category Six" hurricane on the Saffir-Simpson Wind Scale. There was one typhoon in the Pacific in 1961, and one in 1957, which can be described as Category 6 Typhoons. But, nothing of such a ferocity occurred after the 2006 Al Gore movie which claimed that ferocious cyclones would be the norm. Hurricane intensities did NOT increase, at all.
In fact, in the 12 year period between Hurricane Wilma (2005) and Hurricane Harvey (2017), ZERO major hurricanes made landfall on United States shorelines. Moreover, ever since Gore's 2006 movie, only one Category 5 Hurricane made landfall upon the continental United States --- Michael, in October of 2018. The Cat 5 Hurricane to hit the US mainland before Michael was Andrew, in 1992. Before that one was Hurricane Camille, in 1969. And before Camille was the Labor Day Hurricane of 1935. And before that one was a Cat 4 Hurricane which hit Galveston, in September of 1900. It killed 6,000 to 12, 000 people.
 |
"Fear sells," said a one-time CNN employee.
|
Concerning
the 2021 reports coming from the UN, it will suffice to state that 2021
wasn't the third hottest year in the history of anything. After all,
Antarctica had its coldest Winter in recorded history, in 2021. Plus,
Greenland had a very cold June. In fact, Greenland also was the place where 12 GIGATONS of snow fell one day; that day being May 26, 2021.
For the true heat years, look at 1901, 1906, 1910, 1911, 1913, 1921, 1922,
1931, 1934, 1936, 1954, 1976, 1988, 2003, and definitely 2012, as well as 1871, 1878, and 1895-96. Test the bold assertions of strangers for cracks and falsehoods. Don't continue to be a dupe for money-grabbers and power-grabbers who make money off of telling the world that the sky is falling. You don't have to give away your rights to them.
Go do some research on your own, while we are still free of total censorship --- free from the Biden Book Burning Business. And
remember, they burned the books first. Then, they burned the Jews.


 c
c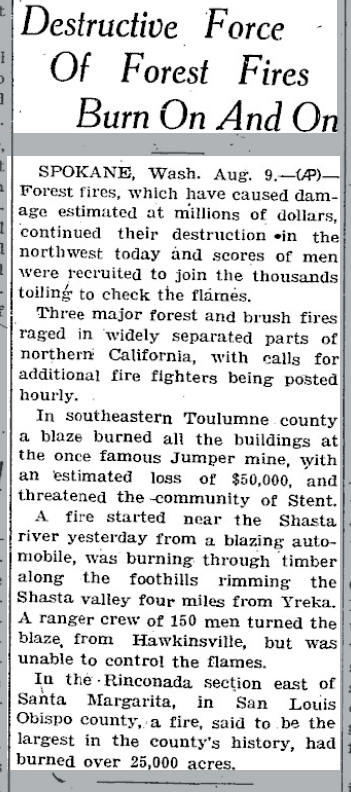
.png)