April 2, 2025

The Fort Lauderdale storm of April 2023 was NOT a 1,000 year storm. There were far more severe ones on record, in the 16th, 18th, 20th, & 21st Centuries.

Newsflash:  Florida's record rainfall within a 24-hour period did NOT occur on April 12-13, 2023, as the media and Michael Mann very falsely claimed.  That event occurred on September 5, 1950, when the atmospheric co2 level was much lower than it is today ... and when the atmospheric methane level was less than 2 parts per million, just like it is today.  On that day, it rained 38.70 inches near the Tampa area, within 24 hours of time.  

In April 2023, the Fort Lauderdale rain reached 25.6 inches.  A number of American rainstorms in the past century measure higher.  Now, you may call the Fort Lauderdal a "big storm" --- or "a really big storm."  But, it wasn't the only one in the past 1,000 years.  It's on a list of many, one of which was so severe that it literally realigned the coastline of the Netherlands.  The Ft Lauderdale rain of April 2023 was tame in comparison to many other storms of the past 1,000 years.  The Climate Doomsayer always hyper-exaggerate things to the pointing of lying about them.

Thirty years later, on November 11-12, 1980, a total of 23.38 inches of rainfall came upon the Key West international airport ... also in Florida.  In fact, up north in Pennsylvania, the rain of July 17, 1942 was regarded as the greatest amount of rainfall outside of the Tropics, to the tune of 34.5 inches rainfall.  Thus, the April 2023 rain event was not anywhere near a unique or unheard-of "thousand year storm."  

Next comes Texas.  On July 24-25, 1979, a grand total of 42 inches of rain fell upon the Houston area within a 24 hour period.  Plus, in September of 1921, 36.40 inches of rain fell on Thrall, Texas, in an 18 hour period.  An even more rapid water accumulation occurred in 1942, near the Pennsylvania-New York border.  That is when 30.70 inches of rain fell in four and a half hours. 

In addition, on July 19-20, 1997, it was at Dauphin Island, Alabama, where 32+ inches of rain fell within 24 hours of time.  Alabama also got 22-24 inches of rain on another 1997 day, also within a 24 hour period.  Prior to that time, in 1943, California received 25.83 inches of rain within a day's time.  Other states had notable amounts of rainfall within a 24 hour period, also.  Historic fact shows that the Fort Lauderdale Rain Storm of 2023 was and is NOT anywhere near a "thousand year storm." 

Yes, there were photographs of downed light-material structures that were alleged (by the media) to have been caused by the April 12-13 storm.  HOWEVER, none of the damage was able to have been caused by any strong winds.  This is because there were no strong winds there at that time.  The Broward County wind speed was very much below cyclone speed, on April 12 and 13.  

The wind speed of April 12 did not exceed 20 mph.  After 12 noon, the wind speed did NOT exceed 15 mph.  And after 6:00 pm, the wind speed did NOT go over 10 mph.  In fact, at the start of the rainfall, the wind speed was already reduced to 15 mph (miles per hour.)  By nightfall, the wind speed was reduced to a mere 9 miles per hour.   Thus, there were no winds in Fort Lauderdale to tip any highway vehicle.  Bad driving on wet roads can cause such a thing, though.

Then came the 13th of April.  The Broward County wind speed on that day did NOT exceed 10 mph.  In contrast, the historic Hurricane Camille of 1969 had winds of 175 miles per hour.  175 mph vs 10 mph.   Huge difference, indeed.  Look for yourself, to see how exaggerated the media reports on the Broward County rain have thus far been.

Now, it takes 74 mph to declare a storm a Category 1 hurricane, and it takes 96 mph to declare one a Cat 2.  Thus, the April 12th wind was 27% the speed of a Cat 1 hurricane, and only 21% of a Cat 2 hurricane.   The April 13th wind speed was only 14% the speed of a Cat 1 hurricane, and only 10% the speed of a Cat 2 hurricane.  

Even for a mild cyclone, 39 miles an hour is the wind speed needed, in order for the weather authorities to declare the existence of a Tropical Storm.  And of course, the April 12th wind speed of Ft Lauderdal was less than half the speed of a tropical storm at the start of the rain.  The speed then was only 1/4 the speed of a tropical storm, when nighttime came.  All in all, there was no wind on those two days which would cause massive destruction.  So, the burden of proof is on the media, in its claim that $100 million in damages occurred during the April 12-13 rain.  All damage would be limited to water damage ... not wind damage.

It was later claimed that damage was done to 1,100 houses.  However, included as damage costs were the days of work lost by employees of businesses affected by the rainfall.  So, remember that damage costs are NOT limited to physical damage.  Financial damage in the form of "opportunity cost" is included.  "Opportunity Cost" is better understood as "opportunity LOST."  This includes work hours lost; aka "lost wages."

Even moderate hail storms throughout history have been costly to insurance companies.  Yet, none of those storms were called "Thousand Year Storms."  I personally know what it is to return before sunset to my former seaside dwelling, after a Category 1 hurricane paid a visit to it.  In as much, the April 12-13 storm wasn't even worse than a Category 1 storm's aftermath, when viewing the media's April 2023 photography slideshow.  The lack of wind guaranteed that a massive tragedy was not going to happen there at that time.  Thus, it's fraud to call the Broward County rain of April 2023 a "thousand year storm."

As a case study for media deception, if you look through a photograph slideshow of post-rainfall Broward County, you will see one long "tractor trailer" on its side, as if a mighty windstorm blew it over.  You will also see a van on its side, as if it too were blown over by a mighty wind gust.  Well, you can see in the chart above that the April 12th & 13th wind speeds were too slow to blow over any motor vehicle.  Slick roads and bad driving, as well as slick roads and the effort to avoid bad drivers, can cause a motor vehicle or two to be turned on their sides. 

In 20-35 mph winds, the only way in which a tractor trailer is going down on its side is IF the box trailer is empty, while the truck is going around a curve, and the wind hits the truck broadside.  Remember, disastrous storms are perfect storms that have the ingredients mix all at once.  The ingredient of wind was absent on April 12 & 13 in Broward County.  It was no thousand year storm.

Moreover, there is more of a population on American coastlines today than there were in the 1920s.  There is much more coastline infrastructure in America, too.  Thus, there are all the more buildings and homes to get caught in storms.  And due to the failure of the Biden administration, prices have been jacked-upward.  This means that it costs more today to do post-storm repair work than it did 5, 10, and 15 years ago.  Such an economic fact might deceive people into thinking that the storms are worse today.  There has not yet come into existence even the rare occurrence of the Cat 6 hurricane, as was erroneously prophesied by the False Prophet, Al Gore, in his 2006 movie.  Today, it's simply a matter of things having become more expensive to fix.  That's all.

Concerning the April 2023 Fort Lauderdale Rain

The type of cloud mass which brought the rain used to be called, "an Anvil Cloud" which is ironically very dry at the top.   Today, it's called a "supercell," and such a name is an attempt to hyper-sensationalize something that has been happening throughout the centuries, only to make it sound so scary that people will demand the US Congress to shell-out billions of more taxpayer dollars to the weather & climate people who always predict doomsday, but whose doomsday predictions NEVER materialize.

Technically, such a cloud is a cumulonimbus cloud that was formed in the middle altitude of the Troposphere, but which began to grow upwards into the high altitude zone, almost to the ceiling of the Troposphere.    The ceiling is called the Tropopause, and it's actually the boundary between the Stratosphere and the Troposphere.

Even more technically speaking, a supercell is regarded as a thunderstorm which has a "mesocyclone" within it.  This means that the center of it is an updraft that travels like a cork screw.  It actually starts from horizontal wind shear which causes the corkscrew motion.  The draft then turns upside, being that low pressure rises.  The anvil shape at the top is a weather gauge, revealing the direction of the wind at high altitude.

Tornadoes can form in an anvil cloud (supercell.)  None the less, the "forward flank downdraft" is where the rain travels.  Meanwhile, the "rear flank downdraft" is where the wind unleashes.  All in all, being that supercells are "hybrid storms," they are NOT limited to one predictable type.  These are custom-built storms.

The April 12th storm wasn't deadly.  In contrast, the 1887 Yellow River Flood (Huang-Ho River Flood), in Qing China, killed 930,000+ human lives.  Plus, there were multiple catastrophic Yellow River floods throughout history, all transpiring when the atmospheric co2 level was very low.  The April 12, 2023 Fort Lauderdale rain compares to none of those floods.  The temporary flooding did NOT even rise above the height of a compact car, in April of 2023.  And then, the water dissipated very swiftly.  

There was no receding of water, being that this was wide open, unimpeded flat land.  There was run-off into guess-where.   Oceans are gigantic, and there is such a thing as low-tide.  Low Tide on April 12 was at 7:38am and 8:06pm.  On April 13, it was at 8:48am and the at 9:19pm.  Thus, April 12 saw no "1,000 year storm," or even a "50 year storm." 

 Johnstown 1889.  A true catastrophe, caused by the neglect of a dam located 15 miles northeast.   The 2023 Fort Lauderdale Rain, in comparison, was little league and harmless, being that there were no components for a disaster there. Deadly storms are perfect storms that have the needed variables for destruction.  Fort Lauderdale didn't come close to doom.  The Missoula and Palouse River Flood of 15,000 years prior was the epic flood; not Fort Lauderdale 2023.

Pennsylvania ... a place much closer to Florida than is China ... had some of the most powerful flood waters in history.  In fact, the April rain of Fort Lauderdale doesn't begin to compare with those waters.  On May 31, 1889, 1,600 Johnston buildings were simultaneously demolished and swept away, by the power of 16 million tons of water which created a 40 foot high channel of raging water, a half mile wide.  The water was traveling at 40 mph.  And it was the result of negligence; not the burning of fossil fuels.

Perhaps you have heard the claim, year after year, that "last year's level of co2 has been the highest in the past 6 million, 12 million, or whatever million years will cause shock & submission in the "little people" who never studied atmospheric science.  Well, this was true for every year since 1815.  It was true for 1915, as well as 2015.  Despite the hundreds of record-breaking co2 years, the world has not yet come to an end, and no mass extinction event occurred --- since 1815.  

Incidentally, an 1815 volcano caused the 1816 "summer that never was."  And of course, it was caused by the so2 released by the volcano ... the 13,000 foot high Mount Tambora, in Indonesia.

 Incidentally, the number 1 instantaneous killer of mankind, in terms of natural disasters, has nothing to do with the atmosphere or the oceans.  The Number 1 killer has been . . . earthquakes.  Next comes famine, and then comes floods.

The April 12th storm's biggest impact was very limited in area.

The 25.6 inches of rain (later amended to 5.91 inches) on April 12 (2023) only fell upon an exceptionally small piece of Southeastern Florida real estate, according to NWS prelim records.  The real estate that surrounded the 25.6 inch (25.91 inch) rainfall zone was visited with much less rain at the exact same time.  Observe one of the NOAA & NWS (National Weather Service) prelim reports:    

~ Slightly South of  the 25.91 inch rainfall zone, only 7.22 inches of rain fell.  That equals  28% of 25.91 inches.  Slightly Northwest of it, a mere 4.20 inches of rain fell, and that constitutes only 16% of 25.91 inches.  

~ Slightly north of that zone, at Fort Lauderdale proper, no more than 6.11 inches of rain fell.  One step further south, in Hollywood Florida, it rained 9.82 inches, and this number only equals 38% of the heavily advertised 25.91 inches that fell upon a very small patch of Broward County land.

~  Directly West, it rained 6.59 & 8.14 inches. ---  One step further southwest, at Pembroke Pines, it rained a mere 5.16 inches.  One step further northwest, it rained 9.60 inches . . . all occurring in 24 hours of time.   

In fact, at Pompano Beach, it only rained 3.39 inches.  At Boca Raton Florida, it only rained 2.24 inches.  And at Miami proper, there was a range of 3.51 inches to 4.92 inches of rain.  Meanwhile, down on Miami Beach, it rained no more than 2.02 inches, on the exact same day.

Such numbers are not Thousand Year Events --- or even 150 Year Events --- or even 75 year events.  Now, this hyper-exaggerated doomsday report, in my opinion, was Michael Mann's attempt to rationalize and justify that outrageously exorbitant 370 BILLION taxpayer dollar allotment recently made to less-than-honest activists & scientists (as well as activist scientists.)  That Congressional allocation was done in the name of an apocalyptic climate crisis that certainly does not exist any more than a climate crisis existed throughout in the 1500s or  1700s, or even the 1900s.  

The 25+ inch rain of Apr 12, 2023 only fell on a small patch of Florida land, with the neighboring areas getting much less in the same time span  This shows that the media and Michael Mann lie and lie and lie, again and again and yet again.  Furthermore,  25+ inches in 2023 is NOT Florida's record.  38.70 inches in 1950 is.

Florida has 67 counties, while the United States has 3,243 counties (including Louisiana parishes).  A fraction of one county getting a lot of rain for only one day, while the surrounding patches of land only get 2/3 to 1/2 to 1/3 to 1/5 of that amount, is no climate crisis.  You gotta do better than that, if you want people to believe that the world is soon coming to a watery end.  

A second NWS prelim report for Broward County, April 12-13, 2023

Now, this one makes a list of 11 places that have much higher rainfall numbers.  They are simply places much nearer to the Fort Lauderdale 25 inch zone.  In fact, 5 of the 11 places contain the name Lauderdale or Lauderhill.  That's compact geography.

Now, when viewing the NWS prelim report below, keep in mind that the NWS Miami twitter account admits that a portion of the rainfall numbers on its Apr 13, 9:30am tweet are NOT regarded as official numbers --- that some are numbers gathered by volunteers, and that the numbers came from several sources.  No matter what stats or illustrations you view, only a small patch of land ... relatively speaking ... was involved in the April 12, 2023 rain.  There were far worse flooding events and longer consecutive rain days in the 19th & 20th Centuries.  This was already addressed ... with examples ... at the Blue Marble Album.

The most important thing is that climate is "the prevailing weather TREND," ... usually throughout the most recent thirty-year period.  A mere 24, 48, or 72 hours doesn't indicate any kind of trend.  Something so short in time is an event for the insurance adjuster and NOT a trend for the real estate investment firm.  

As far as goes climate indicators from real estate investors and developers, the coastlines still have the investment green-light.  There is no coastline exodus known to be occurring.  In fact, I spent ten years at the Atlantic coastline, and I repeatedly saw firsthand how the climate doomsday predictions showed no sign of materializing in any degree of reality.  The coastline real estate investors didn't see it, either.  All that I saw was . . . consumer demand for the coastline ... for the beach ... for the daytime sea breeze.  People kept coming and coming and coming some more.  There were no climate refugees needing to take flight from there.

Any one-day event has zero bearing on climate.  There is less than 1/2 of 1% of co2 in that sky out there, and in the same sky methane exists at LESS THAN two parts per million.  During the Cambrian Explosion, when sea life inclusively & vastly came into existence, there literally was 16 and two-thirds times MORE co2 in the sky.  You need to quit doing your Al Gore impersonation of his climate-doom-coming-tomorrow routine.  It is assured that the end of your world (on this Earth) will come a whole lot sooner than will the end of "THE WORLD."

10.22 inches of rain is still only half of the 25.91 inches placed in neon lights by the Bill-Gates-friendly press.  The April 12th event was NOT a long-term, repetitive event.  Going tunnel-vision on one day's rain is defined as "the media doing some cherry picking," with the intent of terrifying school children so much so that their parents will be effected and then demand hundreds of billions of more taxpayer dollars to be tossed into the hands of the climate doom scientists who have thus far been completely wrong in all their predictions, dating back to 1970.   

The specific predictions of climate doom, massive crop failure, and drowning coastlines have been addressed in other texts.  All in all, the Maldives are still there.  The Great Barrier Reef is still there.  Summertime Arctic Ice is still there.  The glaciers of Glacier National Park are still there.  The Daytona Beach and Miami Beach coastlines are still there.  Etc, etc, etc.

As far as goes the world record for the most rainfall to have transpired in a 24 hour period:

It occurred on January 7-8, 1966.  It rained 71.8 inches on Reunion Island, in the Indian Ocean, east of the island known as Madagascar --- which is east of the African continent.   And of course, the Year 2023 minus the Year 1966 = 57 years ago;  NOT 1,001.

As far as goes the longest dry period:  Between October 1903 and January 1918, it did not rain in Arica, Chile --- which is located 11 miles south of the Peru border.  That dry spell occurred 105 to 120 years ago.  That rainless dry spell lasted for 15 years.

In fact, during 1913, in Death Valley USA, the hottest temperature ever recorded was recorded there.  And the years 1920 to 1922 were years of drastic heat and glacier melt, including the melting of Arctic sea ice up to the 82nd parallel.  As a comparison, know that the North Pole is at 90 degrees.  Thus ice melt occurred 8 latitudinal degrees from the North Pole, in 1922; 101 years ago --- NOT 1,001 years ago.

Moreover, the Years 1927 to 1943 were years of massive forest fires in the western United States.  In addition, 1934 was the year of the worst drought in a thousand years, according to NASA.  Meanwhile, 1936 had the hottest summer on record.  So, you lie when you say that the worse weather conditions are occurring today.

Compliments of the U.S. National Oceanic & Atmospheric Administration.  One correction needs to be made:  Florida's record is 38.70 inches, accomplished on September 5, 1950, during Hurricane Easy. 

Of all the years which can be categorized as the year of the Thousand Year Storm, it is without a doubt . . . 1931, when the atmospheric co2 level was 307 parts per million, and therefore, 73% of today's atmospheric co2 level of 424 ppm.   Rainfall from June to August, along with a build-up of silt & sediment, caused the Yangtze River Flood of 1931. Deaths directly resulting from the flood numbered 400,000+.  Deaths resulting in a dominoes-effect was an additional 2 to 3 million.

Yet, 47 years prior to the 1889 Johnstown Flood was the Indus River Valley Flood (in Pakistan).  It hosted the most disastrous flood in modern history.  It included 100 foot high flood waters.  In fact, also in 1841 was a flood on the Salisbury Plain of England, called the Great Till Flood of 1841, referring to the Till River.

Then comes the Great California Flood of 1862, when it rained from December 9, 1861 to January 20, 1862.  Flooding extended into Idaho, Washington, Nevada & Utah.  4,000 died from the flood, during a time when the atmospheric co2 level was very low and when the human population there was also low.

If you want to know of additional epic storms and/or floods in the past 1,000 years ... in comparison to the non-deadly, chump change Fort Lauderdale Rain of April 2023 ... then familiarize yourself with any or all of the following storms, and know this:  Both Michael "hockey-sticks" Mann, & David Attenborough lied every time they asserted that the weather in the past 1,000 years was mild & stable.  

BTW, if you ever see David Attenborough or Michael Mann in a restaurant or any public setting, IGNORE THEM AND LET THEM BE.  Do NOT even hurt their eardrums by yelling at them.  Write or speak in detail about their falsehoods, for the sake of those who have been deceived by these non-truth-tellers.  The following list shows that Attenborough and Mann are blatant liars, in their claim that the weather was calm for 1,000 years, before the start of the Industrial Revolution.  They should know better:

~ The Divine Winds of 1274 and then 1281 which utterly destroyed two different armadas (military fleets) of Kublai Khan;   ~the South England Flood of Feb 1287, annihilating Romney Marsh & Winchelsea;   ~the December 13,1287 St. Lucia Day Flood effecting the Netherlands;   ~the Grote Mandrenke, aka the St. Marcellus Day Flood of Jan 16, 1362, hitting England, the Netherlands, Germany, and Denmark;   ~the St. Felix Day Flood of Nov 5, 1530, killing 100,000+ in the Netherlands;   ~the Bristol Channel Flood of 1607 - 200 sq miles flooded and 2,000 people washed away;   ~the 1780 Philippines Typhoon, killing approx 100,000;   ~the 1824 St. Petersburg Flood (of Russia);     ~the Coringa India Cyclone of 1839, destroying 20,000 sea vessels at port and killing 300,000;   Plus . . .

~ The Heppner Flood of 1903 (Oregon);    ~ The Great Mississippi Flood of 1927;   ~ The Ohio River Flood of 1937;   ~The 1911 & the 1935 Yangtze River Floods;   ~The Yellow River Flood of 1938;   ~The Rejputana Flood of 1943;   ~the Great Appalachian Storm of 1950, impacting 22 American states;   ~Hurricane Camille, 1969;    ~the Boha Cyclone of 1970, (Bay of Bengal), killing 500,000;   ~the Bangladesh Cyclone of 1991, killing 138,000+, while effecting 10 million with homelessness.   

There are a lot more, but the above-cited are enough to get your heads out of the brainwashing machine into where Michael Mann dunked it.   These all show how the April 12 rain of Fort Lauderdale is completely chump change.  It doesn't even rank ... rate ... count.  

It's just that the Michael Mann People were looking for a "scare," in light of their recent prophesies of doom failing; namely those of an apparently healthy & exotic Australia and a replenished American West.  This is why ... in my opinion ... you now hear the petty report of added occasions of air turbulenceee in modern aviation, allegedly being caused by the 1 part per 8,000 parts increase in atmospheric co2 over the past 125 years.  Do you mean to tell me that that's the best Michael Mann and Al Gore can do, in scaring mankind into submission?  

Below here is a world record rainfall video that mentions many heavy storms and NASA data tampering, as well as droughts and heat waves that made many a newspaper:

https://www.youtube.com/watch?v=PEGyCutXYcE&list=PLH8YDbh9qmDHfTpV5A1_6nRRbD64yn0qs&index=51

The New Fear-Mongering Tactic of the Media

The media continues to deceive the civilian body politic, presenting a new climate deception as soon as the current one gets exposed or fades away with no lasting impact.  For example, as of May 2023, the media started reporting that the extremely small amount of co2 in the sky is causing more air turbulence with airline flights.  The simple answer to this assertion is that there are far far far more airliners in the sky today, everyday, than there were 30, 60, and 90 years ago . . . except during WWII bombing.  Therefore, there is going to be more encounters with air turbulence.

Now, being that I am the son of an airman who paid Adolph Hitler 35 unfriendly visits in a B-24, I can testify that he told me ... in the 1970s ... that air turbulence during a bombing mission was a common thing.  This was told by him during a civilian airliner flight in the 1970s, when the airliner encountered a few seconds of turbulence, thereby frightening everyone on board except him.  His fear was NOT air turbulence.  His fear was that of the guns firing from the Focke-Wulf 152s and the ME 262s in the German sky, as well as flack fired out of 88mm and 128mm German cannon barrels.

The climate crisis media has been doing nothing more than lying to the public.  Its technique of lying has been the use of:  [1] false light disinformation & [2] sleight-of-hand deception.  This was 100% the case with the July 19, 2022 Great London Fire Stats, as well as the climate refugee predictions about an Australia that has recently been replenishing quite well, thank you.  

This incessant deceit of the media ... which is simultaneously in line with Jim Hansen's incessant failure at weather predictions ... included the 35 year old watery doom prediction of the Maldives which has recently built 5 NEW autonomous airport landing fields, to accommodate the tourist popularity of those very healthy, above-water islands.   

This failed prediction is always accompanied by the prediction that the Arctic Ocean will "very soon" be free of sea ice during some upcoming month of August.  Yet, the closest that the Arctic Ocean came to an ice-free Summer was in 2012, when 1.32 MILLION  square miles of ice covered the Arctic Ocean.  

Now, the square root of 1.32 MILLION square miles is 1,148 linear miles.  Thus, the least amount of ice that the Arctic had was equivalent to the straight-line distance from New York City to Omaha, Nebraska ... and then from Omaha to South Padre Island, Texas ... and then from South Padre Island to Miami ... and then from Miami to New York. 

The size of the Arctic is 5.5 million sq miles.  That is equal to flying from Boise Idaho to Boston ... and then from Boston to Panama City, Panama ... and then westward, from Panama City, for 2,340 miles ... and then north, for 2,340 miles, to Boise Idaho.

Let it also be reminded that the glaciers of Glacier National Park were NOT "gone by 2020."

Then comes the matter of the Biden administration deleting from government charts & graphs the massive forest fire frequency of the late 1920s and entire 1930s.  This was done ... in my opinion ... to make the much lesser number of fires since 1983 look like the end of the world.  Today, students fail to realize that the creation of Smoky the Bear campaign in the early 1940s was a sign that forest fires of the 1930s had the attention of an entire nation, due to the traumatic size and even more traumatic effect that those fires had on the American psyche.   Even the extended tragedies of WWII did NOT make Americans ignore the massive American acreage charred by forest fires.  Thus, while Hitler was ripping through Europe, forest fires were ripping through the American West.

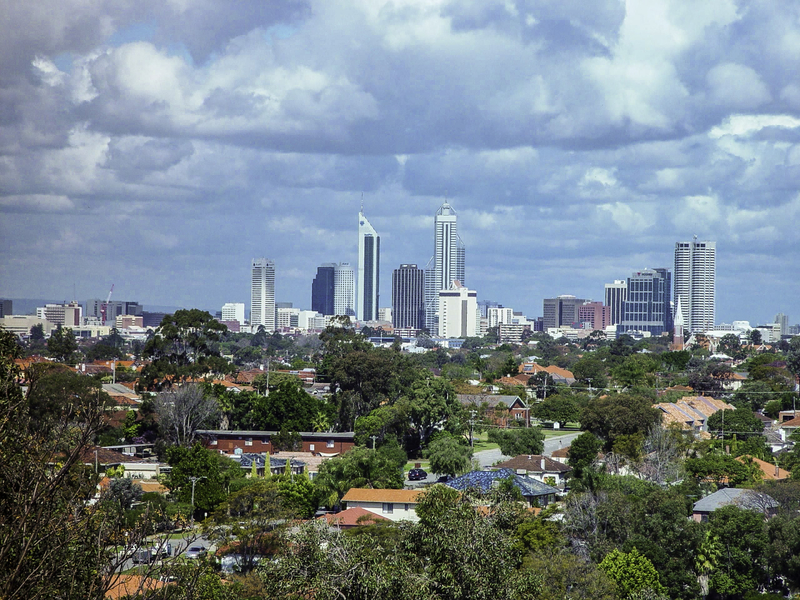
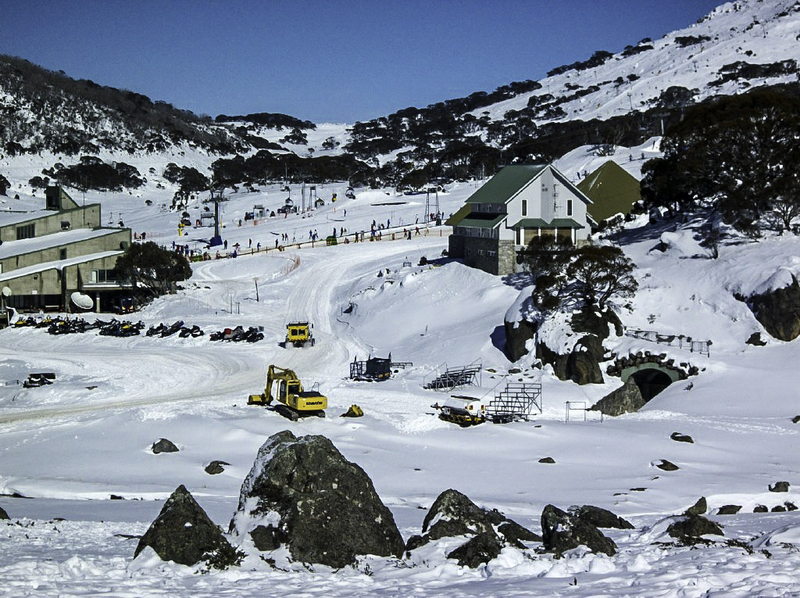
You need to understand that Michael Mann utterly failed in his apocalyptic prediction about Australia.  It did NOT become a land vacated by climate refugees, as he confidently predicted  This is because the rains healthfully returned to Australia, along with coral cover that regenerated 2 of the 3 sectors of the Great Barrier Reef, as well as weather conditions bringing back the return of profitable Australian ski resorts. 

Then came the failure of the 2022 predictions of "a prolonged American drought," "added forest fire devastation," and "record heat."  The 2022 doomsday predictions literally got washed away and "whited out" by means of early 2023's rainfall, snowfall, and snowpacks in the American West.  This all happened as soon as La Nina ended.  (See: ENSO.)  

Moreover, the record snowfall in England ... and in Japan, along with record cold in one part of China .. showed the relief that was granted by nature to have had a global effect.  Meanwhile, the accompanying replenishment of American dams also made Michael Mann look like a bumbling buffoon who was clueless to the true climate conditions of Planet Earth.  

If you want to see how far off were the climate doomsayers in their 2022 drought & excessive heat predictions for 2023 and beyond, take a look at:

https://www.youtube.com/watch?v=W2i_jaY3JdQ&list=PLH8YDbh9qmDG6_EnHnoCHVzJ89x_Oav0Q 

April 1, 2025

Michael Mann a Nobel Laureate??? APRIL FOOLS: He was never even nominated for a Nobel Prize.

Here's the bottom line ... the conclusion ... at the outset.  Michael Mann and Democracy Now presented Michael Mann as a Nobel Prize winner, for his work in climatology.  This deceives people into thinking that Michael Mann received the Nobel Prize in Physics.

Firstly, he won no type of Nobel Prize.  None the less, Mann connects himself with the Intergovernmental Panel on Climate Change, otherwise known as the IPCC.  HOWEVER, the IPCC won the Nobel PEACE Prize only ... NOT the physics prize.  Al Gore co-won this same Peace Prize.  Al Gore NEVER won the Nobel Prize in Physics.  

There is the recording of a phone call made to the Nobel Prize office, in Scandinavia, to confirm if whether of not Mann is a Nobel Prize winner.  The Nobel Prize rep said that Michael Mann definitely is NOT a Nobel Prize winner.   Michael Mann is nothing more than a con artists, especially when it comes to his hockey stick graph which I already explained.

In brief review of Mann's hockey stick graph, it claims that 1921 & 1922 were among the coldest years in the past 430 or so years.  Newspaper articles of the time, published throughout the modern world, reported 1921 & 1922 as years of extreme heat and extreme Arctic Ice Melt.  That fact, alone, invalidates the graph Al Gore used in his extremely fraudulent 2006 movie, on CO2.

 * * * * * * * * * * * * * * ** *

Audio Proof that Michael Mann's Nobel Prize Claim is a fraudulent misrepresentation (aka lie) 

 * * * * * * * * * * * * * * * * 

That particular recording assures us that Michael Mann is NOT on the list of Nobel Prize sole-winners or co-winners, in any category.  So, you do NOT have to submit to him, no matter what he says or writes.  And you surely don't have to submit to the present-day media who happens to be filled with personnel not known for common sense, honesty, reason, diligence, ... or humility.  BTW, stubbornness is not diligence.

NEITHER has any group affiliated with Michael Mann won or co-won the Nobel prize in Physics ... or in Chemistry ... or in Physiology, aka medicine ... or in Literature ... or in the Economic Sciences.  

There is one and only one group which co-won the Nobel Peace Prize with Al Gore, in 2007.  That was the IPCC, the Intergovernmental Panel on Climate Change.  

Take note that they did NOT win the Nobel Prize in Physics.  The Nobel Peace Prize is only one of the several yearly prizes awarded by the Nobel Foundation, and Michael Mann's name is NOT on any of those peace prize awards ... or any other Nobel award.

All in all, Mann is fraudulently passing himself off as the ultimate end-all scientist of his particular field of study which happens to be "surface temperatures."  

In addition, he's a notably dull and boring speaker.  If you have insomnia, simply go to a Michael Mann talk, and voila!  No more insomnia.  He makes the End of the World sound all so boring.  Therefore, the best thing to wear to a Michael Mann talk is pajamas.  Bring a pillow. 

The great self-negating feature to Michael Mann ... of the temperature-decline-hider extraordinaire, is something known as evidence.  Take notice:

https://i0.wp.com/electroverse.net/wp-content/uploads/2021/05/NYT-1961.gif?ssl=1
Above:  Introducing ... in printed legacy ... the Temperature Decline that Michael Mann was hiding, yet which was declared to fully exist, by an unanimous field of specialists ... as far back as 1961.

At this point, it's also important for you to realize that Al Gore, at best, is a remedial science student who went on Conan O'Brien's talk show and confidently stated that the center of Planet Earth is millions of degrees.  Try 9,800F to 10,800F, instead.  If the core of Planet Earth were millions of degrees, vaporization & annihilation would have occurred long ago. 

BTW, do you remember reading-of or hearing Michael Mann's doomsday predictions about Australia soon becoming a "climate refugee" nation?  Well, 2022 was a year of record high crops in East Australia.  Also in 2022 was the announcement that  two of the three major sectors of the Great Barrier Reef was replenished to the point of having the most coral cover in 36 years.   

Michael Mann lied about Australia, probably assuming that Americans are too stupid to find out what's going-on on the other side of the planet.  Michael Mann is a protected jerk.  One day the protection will suddenly vanish.  The puppeteers will cut the strings.  For now, stay away from the guy.

https://www.graincentral.com/news/agribusiness/graincorp-posts-record-result-harvest-report/

 https://www.bluemarblealbum.com/2022/10/green-and-white-australia.html

https://www.bluemarblealbum.com/2022/09/great-barrier-reef.html 

https://www.bluemarblealbum.com/2022/09/rugged-australian-2022-winter.html

All in all, Michael Mann is the ultimate Climate Denier in having denied the existence of the Medieval Warm Period & the Mini-Ice-Age, not to mention part of the 1940 to 1979 temperature decline, with all of his "math trick" talent.   See: climategate emails.  

See:  =====>   The Climategate Emails w/ introductory narrations.   <=====

Now, concerning the 1950s (in part), the '60s (in whole), & the '70s (predominately so), the cooling trend had gotten to the point where England's growing season was shortened by two weeks.  No matter what today's lying propagandists publish, it was very cold back then.  In fact, as American schoolchildren walked toward their homes, they had to turn around and walk backwards, so that the bitter cold wind would not directly stream down their shirt/blouse collars.  

It was assumed at the time that Winters were to be bitterly cold, as a rule.  This is why the warming trend of 1983 & 1984 surprised people.  In fact, February 1998 was so nice that it scared people, including radio icon Paul Harvey.  Then, when the coldest winter in 40 years arrived (in 2014), humanity realized that the climate is cyclical.

See:   New York Times, May 21, 1975

Enter Keith Raphael Briffa (1952 - 2017).  He was the quintessential tree ring proxy advocate.  This means that he was an aficionado in Dendroclimatology.  His climate "reconstruction" of the past 1,000 years -- abridged into 600 years -- goes as follows:
https://climateaudit.files.wordpress.com/2009/11/briffa_recon.gif
The red section above is what Mann was praised for hiding, in the Climategate emails.

Below: Look at the YELLOW LINE, toward the right side of the predominately blue graph.  Look closely at the "0.0C" temperature anomaly X-axis.  If the Briffa reconstruction were not deleted, Michael Mann could not have drawn a steeply upward sloping line to represent drastic warming. 

Now, the Y-axis scale on the chart below is not remarkable, because the whole chart involves no more than 1.5 degree Celsius in variability.  Thus, the chart only deals with small increases or decreases in the temperature anomaly (aka temperature changes.)  Using smaller increments exaggerates the slope of a graph and serves to deceive people, instead of enlightening them.  It makes that which is little look much more pronounced than it really is.

BELOW:  Look at the Briffa Reconstruction again, in a more clear view.  It's based on tree ring density only.  The Briffa line is green and it starts at the Year 1400 or so.  

As far as goes Mann, he has two lines on that graph.  The thinner line is dark blue and it doesn't begin until 1580.  That was ever-so-coincidentally after the great heatwave & drought of 1540.  None the less, that thinner dark blue line only involves temperatures from Latitude 30N to 70N.  This means that it does NOT involve global temperatures.  After all, no southern hemispheric temperatures are involved, and no northern tropical temperatures are involved.  

The Tropics are 23.5 degrees latitude, north & south.  Yet, Michael Mann's math doesn't begin until the 30th parallel north.  Welcome to Michael Mann's real math trick.  It's the trick where you leave numbers out of the equation.

The other line of Mann, the black one, involves all Northern Hemispheric temps from 1000 C.E to 2000 C.E.  However, it's the dark blue "30N-70N" line which is the one able to hide the decline. 

https://camirror.files.wordpress.com/2009/11/fig2-212.gif

 https://climateaudit.files.wordpress.com/2009/12/briffa_versions.gif

Note that the slope of the temperature decline was very pronounced.  So, the Intergovernmental Panel on Climate Change simply cut off the decline at the Year 1960.  Then came Michael Mann and his bag of tricks. The disappearing act ensued.

The MBH Hockey Stick Graph--- was never test driven or tested for cracks.  (M=Mann, B=Bradley, H=Hughes)

Michael Mann, Decline Hider Extraordinaire, never revealed the data sets that he used to justify the drawing of his asininely ridiculous hockey stick climate graph.  Thus, he never justified why he deleted the historically known Medieval Warm Period and the very well chronicled Mini Ice Age.  

Rumor had it that Mann dropped the use of proxy evidence as soon as it showed a decline in surface temperatures.  He then included thermostat stats, in its place.  This is the act of mixing apples with oranges.

The irony to that graph was that it was a straight declining line for 1,000 years, by a half degree, as if Climate were in a perpetually stagnate coffin, except for handful of upticks.  One uptick on his very fraudulent graph was during the Wolf Minimum.  Oops.  He denied the Little Ice Age at its historic beginning. 

The Wolf Minimum came in 1280 and preceded the Great Plague of 1348.  The Great Plague is often regarded as the start of the Mini Ice Age.  Actually, 1280 C.E. can be regarded as the start of the 550 year age of Ice Dominance.  

None the less, the Briffa reconstruction had temperatures that were higher at the start of the 20th century.  Thus, the real decline was a sharper downward slope. Mann decided to make the slope much more gradual.  This meant that, according to Michael Mann, there are no natural mechanisms to create weather variations on an upward temperature trend more than half a degree.  According to Mann, upward trends can only be accomplished by the use of the combustible engine.   Yet, drastic weather changes occurred throughout history ... long before the invention of the combustible engine and the Mack Truck. 

Well, there were a number of climate change scenarios in the past 4,000 years, when there were no combustible engines or coal power plants.  In some cases, there weren't even chariots.  Michael Mann's graph is an insult to human intelligence.  Well, all of Michael Mann is an insult to human intelligence ... not merely his hockey stick graph.

During the Renaissance Era Ice Age, there were still occasional warm Summers and hot days throughout that time.  One example was the June 28, 1778 Battle of Monmouth which involved 25,000 troops.  It was fought in present-day Freehold New Jersey.  That was a huge number of soldiers for the American Revolutionary War.  The June 1778 battle ended with the British withdrawing its troops at night, incidentally.  

In addition, there were droughts during those centuries, including the 1540s Tudor Drought.  There were catastrophic hurricanes, too, even though the atmospheric co2 count was very low, when compared to today.  As an example, 1780 was a catastrophic year with hurricane damage being its highlight.  One hurricane killed 22,000 people, in 1780.

The 2nd most asinine thing Michael Mann ever said in front of a camera.  

Michael Mann was asked how much CO2 must be removed from the atmosphere.  Mann confidently said, "Half the carbon dioxide in the atmosphere in ten years," ... in order to prevent a 1.5C catastrophic temperature rise.  Stop there.  That spoken line shows that Mann either knows nothing about the new findings in atmospheric physics or he is just not thinking when he talks.

Proxy history showed that not even a 2C rise is catastrophic, but rather, a 2C rise accompanied the rise of the great & historic Roman Empire.  For the record, it was scientifically & professionally surmised, via Mediterranean proxy material, that the Roman Warm Period was TWO degrees CELSIUS warmer than it is today.

Plus, the temperature rise helped the Romans finally conquer the hard hitting Gaul army of Chieftain Vercingetorix, in an eight year-long war --- in a land known as present-day France.  Thus, a 1.5C rise in surface temperature is NOT anywhere near catastrophic.  

For the record, the Gauls used to terrorize Italy ... demand tribute, take Italian gold, etc.  So, Julius decided to stop the terror attacks and bring back to Italy the Roman gold that had Vercingetorix's fingerprints on it.

None the less, here is the supreme asininity of that one Michael Mann assertion, concerning deleting half the CO2 from the atmosphere:

{1} Half of today's level of co2 = 210 parts per million (ppm).  That constitutes 50 ppm LESS THAN during cave-man days.  That constitutes 73 ppm LESS THAN the start of the 19th Century, aka the Napoleonic Era.  Both time periods occurred when the human population was much smaller than today.

See for yourself:  ***>  Atmospheric CO2 graph, starting at 1800  <***

{2a}  Today's population is 8 BILLION in human beings, meaning that much more crop harvesting is needed today than during the Napoleonic War Years when the world population was approximately 1 billion.  Thus, much more CO2 is needed today, and coincidentally enough, the atmosphere is presently providing the extra needed amount of CO2 for our era.  

{2b} CO2 is the KEY to PHOTOSYNTHESIS.  When CO2 goes below 150 ppm, all photosynthesis halts.  Life on Earth soon follows suit.  Dropping the CO2 count to 210 ppm is irresponsible.

{2c} NASA has already reported on the added greening of the present-day Arctic Circle during the Summer months.  Extra CO2 increases photosynthesis throughout the Earth.  In as much, IF you want to "go green," the first thing that you have to do is INCREASE THE ATMOSPHERIC CO2 LEVEL.  Growers do this to their greenhouses, as a rule.

See:  NASA's Satellite Technology shows the greening of the Earth 

          NASA reports a greener Earth of recent

           CO2 levels making Earth Greener

            Added co2 and added plant growth demonstration

The asininity of Michael Mann and his fellow racketeer, Al Gore, is that they are doing the opposite of what it takes to "go green."  This anti-co2 mindset is the Supreme Asininity of the climate doomsayers.

In as much, pursuant to the NY Times vs Sullivan case law authority, I, a private citizen, state my opinion of public figure, Michael Mann:  

Michael Mann is a contrived fad.  He's an artificially propped-up mouthpiece, presented as the wisdom of the ages. 

Mann is only famous, because of the hockey stick graph.  Yet,  he never showed the public the data sets upon which his neon-lighted hockey stick climate graph came to be.   He could have made up that graph as much as some people made-up record breaking high temperatures in those parts of Africa which had NO WEATHER MONITORING STATIONS.

Thus, the one hockey stick graph which made Mann a contrived news show icon has never been tested for cracks.  It has never been test-driven.  Would you buy a car you never test-drove?  Of course not.  So, we the People of the United States do NOT buy Michael Mann's untested climate change hockey stick graph.  

This is especially true for those of us who worked outdoors, year after year, and decade after decade.  This is because we are experienced enough to know that ====> Climate is cyclical.

Plus, Michael Mann has a very financial conflict of interest in the promotion of his hockey stick graph which omits the historically supported Mini-Ice-Age which included:

{1a} the great frosts, great floods, crop failures & mass starvation often mentioned in the Bristol Chronicles.

{1b}, the Sporer Solar Minimum which has now been concluded to have actually existed from the starting point of 1460 C.E.

{2} The irony & counter-intuitive hot year of 1540, followed by the cold account of 1640, in showing how Mann's virtual straight-lined graph needed more spikes in it, to reflect historic climate reality.

{3} The North American drought year of 1580, showing more of the need of upward spikes in the Mann Hockey Stick graph.

{4} The Grindelwald Fluctuation of 1560 - 1630, which even included out-of-season snowfalls.

{5} The well-known Maunder Solar Minimum which included warm Summers, in addition to ice-ridden Winters.

{6} The Dalton Solar Minimum of 1790 - 1830 which included the 1816 Summer That Never Was.

All in all, the "Mann, Bradley, & Hughes" graph is typically Orwellian, in that it rewrites history. 

Why don't the newscasters ask Michael Mann how much personal money he personally made since the publishing of his hockey stick graph?  Why doesn't Michael Mann simply come out and let us Americans know how much currency was transacted into his financial portfolio in the form of taxpayer dollars?

None the less, for the past 4,000 years, climate change has literally been occurring every 124 to 600 years.  Climate is a long-term roller coaster ride.   Climate is cyclical.

Ah, yes.  Michael Mann.  Hiding the Decline Since 1999.

Michael Mann proved himself to be utterly heartless, if not an indifferent psychopath, against an elderly retired Air Force pilot, on account of the pilot saying that, even though Michael Mann was teaching at Penn State, he should have been at the State pen (penitentiary), instead.   One sentence was spoken, and a ridiculous amount of Canadian civil lawsuit attorney fees ensued.

The retired & elderly pilot who earned a doctorate degree let me know how much suffering Mann put him through, and he informed me that he intended to let the world know about those sufferings after the lawsuit ended.  Well, the lawsuit ended.  There was no communication between me and the Canadian gentleman since I left Chicago, in 2019.  He recently passed-on into eternity.  His videos are his legacy.

And remember, pursuant to NY Times vs Sullivan, a private citizen may publicly state his opinion of a public figure, in the United States.  I'll be politely reserved for now.  I only stated half of my opinion thus far.

It suffices to state that some people in this world are really sick jokes, and for long periods of relative time, it appears that they will get away with every wrong they have ever performed.  But, appearances are not all what they appear to be.  History repeats itself.  

Do the math on this one ... on the person who caused schoolchildren dread, and who caused gasoline prices to skyrocket, in his role as an advisor to the Dementia-ridden president.  The same person caused an elderly former air force pilot the loss of his life savings and the gain of accompanying dread.  Justice, in the end, prevails.

For now, be like a charming Latin gentleman, even if you hate us Latins to the marrow of our beings.  Do NOT write to Michael Mann.  Only address his superiors and the Court of Public Opinion, as well as a RICO court.  Do NOT walk up to Michael Mann in a restaurant.  Let him have a relaxing time.  Do NOT picket in front of his house, his office, etc.  Be as charming as a Ricardo Montalban.  Charm doesn't hurt anyone.   Meanwhile, simply boycott Michael Mann.

The goal is to see to it that humanity clearly sees that Michael Mann and the less than brilliant Al Gore have been lying, in sleight-of-hand deceit, all along.  In order to achieve this goal, it is NOT necessary to harass anyone in a restaurant or to picket in front of a domicile.

People like Michael Mann are necessary to avoid, because he's a liar who will claim that you threatened him, if you get anywhere close to him ... or he will tell some lie about you.  So, stay away from Hockey Sticks Mann.  Simply boycott him.

Sincerely,

                        Private US Citizen #40,801,958.

                      There is a meaning to that number                                        

Michael Mann's April Fool's Joke about Australia. It's just a con artist's scare tactic.


My many 2022 Australian phone conversations informed me that hockey stick man, Michael Mann, was & is COMPLETELY full of fraud, in his dramatic, end-of-the-world theatrics, regarding his Australia-is-Doomed Show.  It started a couple years or so ago.  Nothing of the Doom Story that he has thus far told has been occurring in the proportion of time & space & intensity that Mann has been insinuating.  In fact, the opposite happened in Victoria and in the Coral Reef, as well as elsewhere in Australia.  
 
Now remember, according to Michael Mann, you should never spend any money on a vacation to Australia.  That's a form of false light defamation against the Australian tour industry.  After all, if people listen to Mann and decide to avoid Australia like a disease, then he is basically robbing the Australian tour industry of its income.
 
Mann spoke of a possible future of Australian climate refugees.  Well, let's see.  We can start with the news that there definitely are Victorian dams which are full, as of 2022.  The others have been filling without impediment.  Some are overflowing.  No drought there.  Therefore, all of the predictions of a permanent Australian drought prove to be a matter of total incompetence on the part of the predictors.   

They literally need to be removed from their posts, and their funding must be revoked from them.  Not a joke.  They're emotional terrorists who spent at least 16 years terrifying schoolchildren.  And it's not a matter of them being well-meaning, though bumbling, buffoons.  They are deliberate liars who do things such as "hide the decline."

Now, remember what I wrote ... and what others have said:  Climate IS Cyclical.
 
***************************************************************************
 
 See: Melbourne's dams are full to the brim . . .    <========= <========= <=========

***************************************************************************

Below:  Dartmouth Dam, Oct 12, 2022: 101% capacity.   Hume is at 93%.  No drought there.
 
You can be assured that the Global Warming Profiteers will claim that the naturally gained water supply a deadly sign of evil evil Climate Change.  Thus, if it doesn't rain, it's Climate Change and the End of the World, and if it does rain, it's also Climate Change and the End of the World.  If you inhale, it's Climate change.  If you exhale, it's also Climate change.  Every type of weather event has recently been claimed to the result of the burning of fossil fuels & deadly Climate Change.  It's always the end of the world with the Climate Change People.  
 
                      The 2022 chart below is found at Elders Weather: Sydney Dam Levels

And to think, Obama's own EPA head was UNABLE to tell the House of Reps, during a hearing, what percentage of the atmosphere is CO2.  Well, it's less than one-half of 1%, at 42 parts per 100,000.  Nitrogen is 78,000 parts per 100,000, incidentally, and Oxygen is 21,000 parts per 100,000. 

                             We continue to the Indian Ocean side of the continent, with  Perth.

Perth, Australia.  Okay, where are all the dead leafless trees?

But of course, ever so coincidentally, Australia is on the other side of the world.  So, it looks as if Mann could easily get away with lying about things on the other side of the world, without 300+ MILLION Americans ever finding out about it.   Well, for starters, Australia recently had record cold and it had ski lodges open-for-business.   Yes, Australia gets snow. 

https://www.goodfreephotos.com/cache/australia/new-south-wales/other/perisher-valley-snow-fields-new-south-wales-australia_800.jpg?cached=1522527217
New South Wales, Australia.  A nation the size of the U.S. has snow.

Now, Australia is the size of the continental (contiguous) United States.  And of course, the weather is nowhere near the same throughout the United States.  So, you can't use one sentence to describe all of Australia as much as you cannot use one sentence to describe all of the United States.  We in America have snow country and desert-land ...  mountain ranges and flat lands ... hard water and soft water ... clay land and shale land ... as well as a corn belt that overlaps the Goiter Belt where iodine is non-existent.  

For the record, Australia is 2.9 million square miles in size.  It's the 6th largest nation on Earth and 1.7 MILLION square miles larger than India (which happens to be the 7th largest nation on Earth.)  It's also 2.2 million square miles larger than Texas.  This is why a person halfway around the world can instantly tell that any Australia-Is-Doomed tale is another Climate Nazi lie.  It's because the doomsday tales omit mention of the diversity and size of the Australian landmass.  

In addition to snow, Australia even gets Monsoons.   Remember, 370 BILLION American taxpayer-indebtedness dollars have been shelled out for this game-playing.  This game was taken to Australia.   So, where is all this end-of-the-world climate doom in Queensland, anyway?

Chevron Island, Queensland.  So, where is the drought and the brown tree leaves?

Moreover, it was in the Year 2022 when it was officially reported that two of the three Great Barrier Reef regions had the most coral cover in 36 years.  The third region of the Great Barrier Reef became a smorgasbord for hungry crown-of-thorn starfish.  All in all, the Great Barrier Reef is categorically regenerating, and this news invalidates Michael Mann's predictions of doom, as much as it negates his competency.  Mann looks to be too incompetent to make any forecast longer than five days into the future, if that long.  Yet, Michael Mann should know better.

*   *   *   *   *   *   *   *   *   *   *   *   *   *   *   *   *   *   *   *   *   *   *   *   *   *   *   *   *

See furthermore:  But, in 2022, Australia DID have a "brutal cold snap" & record cold.

*   *   *   *   *   *   *   *   *   *   *   *   *   *   *   *   *   *   *   *   *   *   *   *   *   *   *   *   *

 Now, the 30th Parallel South Latitude runs through Southern Australia.  That latitude is where the Hadley Convection Cell exists, thereby causing the existence of deserts.  Thus, the desert lands of Australia are only there, because of a descending high pressure convection cell, and NOT because of CO2  or  N2O  or  Methane  or whatever else the Global Warmists claim to be the cause of doom.   

For those unaware, all major deserts are on the 30th parallel, North & South, due to super large convection cells that circumference the Earth.  In addition, there are moderate deserts located on the Leeward side of Mountain ranges.  This is due to Adiabatic Heating.  You can tell that adiabatic heating ... which causes Santa Ana Winds ... is prevailing, because in those regions the clouds do not cross over the mountain tops.  Rather, they stay on one side.  I've already explained this in another post.  And remember, my own mother was born and predominately raised in the Red Desert of Wyoming.  The clouds stay on one side of the mountain range, there.

In addition, the Northern territory of Australia can be rough, and the Tropic of Cancer runs through the center of Australia.  Rugged land, yes.  But, Michael Mann is trying to deceive humanity into thinking that co2 only recently caused Australia to look the way it has looked for thousands of years.  You had to have heard of the Australian Outback.  Correct?  CO2 did NOT create it.   It has been around for a long time.

All in all, in my opinion (protected by U.S. Supreme Court case-law authority Times vs Sullivan) Michael Mann is a premeditated liar ... an outright con artist.  It's no mystery why Tim Ball said that Michael Mann belongs in the State Pen.  Lots of money was conned out of Congress, in the name of man-made-co2-driven Climate Change.  There still exists "theft by deception" in the law books, and there still exists in the U.S. Code, the False Claims Act. 

It would have been nice if someone would have told the public that only 43 parts per 100,000 is the concentration of atmospheric co2 --- that co2 only comprises 0.043% of the Troposphere.  It would have been nicer if someone would have told the public that far worse weather disasters, in number and in intensity, occurred in recent decades and in recent centuries, as well as in distant centuries.  In fact, it would be nice to have a government who doesn't constantly lie to its people.

Free photos of Kangaroo
Okay,  I'm ready to see all the Australian climate change doom that Michael Mann's talking about.  Hey, where'd it go?  All I see is Woodstock for seemingly well-fed kangaroos.

Yet Another Michael Mann Lie

As a refresher, keep in mind that Michael Mann falsely claimed to be a co-winner of some kind of Nobel Prize.  The link below will take you to the video recording of a Nobel Foundation rep emphatically & clearly stating that Michael Mann NEVER won or co-won any type of Nobel Prize.

See:  A representative of the Nobel Foundation clearly stating that Michael Mann is NOT a Nobel laureate of any kind. 

And remember, ladies & gentlemen, if it weren't for Michael Mann pushing his fraudulent end-of-the-world hockey stick graph, in his claiming that doom is soon to be here, you would not have to have payed $4.50, $5.50, and even $6.50 per gallon for fuel, just so that you could go from Usual Point A to Usual Point B.  After all, it was Mann who claimed that the Planet Earth's climate was mild for a thousand consecutive years, and then was made into a tempest by the Industrial Revolution.  

The truth is that turbulence is an aspect of the round, rotating, and tilted Earth's atmosphere.  Look at the time-lapsed video of cloud masses, if you don't believe this to be the case.  Then, simply look into the history of shipping, during the Age of Exploration ... and colonization.   

In summary . . .  in the past one thousand years, there have been hundreds and hundreds of documented sea storms and the accompanying destruction of ships and even fleets.  For example, there were 120 Spanish-language documentations of sea storms, for the 16th Century alone.  Even the Famous Ponce de Leon reported a 1508 storm.

During the past one thousand years, there were also numerous droughts, floods, early frosts, diseased crops, failed crops, diseased orchards, heatwaves, famines, rain storms, lightning storms, snow storms, floating icebergs, deep freezes, ice stacking, glacier rise, glacial melt, landslides, avalanches, wildfires, forest fires, plagues of insects, epidemics, pandemics, etc, all when atmospheric co2 levels were very low.

Mann made it sound as if, not listening to him would cause climate chaos and World War III.  Wrong.  Listening to him and following his Nazi guidelines is what is causing World War III to transpire, if not a dominoes effect of civil wars.

Tim Ball

You know, when the Mann v Tim Ball lawsuit came to a close, Tim Ball let me know that he intended on letting the world know how much suffering Michael Mann caused him to endure.  All that Tim Ball said, to trigger the lawsuit, was that, "Michael Mann is at Penn State, and he should be in the State Pen."  That one sentence caused Tim to release his financial reserves, out of desperation.  

Tim could not spend the remaining years of his life in peace.  He had to be tortured by Michael Mann.  Michael Mann showed that he does not care about humanity.  He has no sensitivity for human suffering, evidenced by him causing human suffering.  After all, how much money did the poor have to pay at the gas pumps, during the Biden administration years?

BTW, Tim Ball extended courtesies and diplomacy toward me, because I am the son of an United States Air Force decorated combat vet, and Tim was a pilot in the Canadian Air Force.  So, Tim reached out to me, out of respect for my father.  Plus, I did ask Tim for some advise on undoing the blatant meteorological, statistical, and historical lies told by the Gore-Hansen-Mann cabal.  
 
This Climate Con Game is so blatant.  It's like reading a trick question.  How could people not instantly see it ?  Oh, they were never taught textbook material that was known long before Al Gore put his face in front of a camera.  
 
In not allowing that textbook material to be readily spoken on TV, it is equivalent to doing a Nazi book burning, on a Crystal Night.  Nice Freedom of Speech that Al Gore, Michael Mann, and Captain Bow-tie allow, not to mention . . .           Oh, that's right.  I can't mention it.