March 18, 2025

Crop harvest record highs in 2021, ~the deception of the July 2021 temperature claim, ~Antarctica's coldest Winter was 2021.

Greater London had
. . . Also in 2021, Greater London had its least number of yearly fires in its record-keeping history which goes back to 1966.  In fact, Greater London had at least twice as many fires that it did each year, from 1969 to 2005, than 2021 had.  Moreover, 1976's 60,000+ fires were three times more than 2022's 19,297 fires.  And 2022 had the fourth lowest number of yearly fires in Greater London's recorded history.  Yet, the year prior, namely 2021, had the least number of yearly fires, to the statistical tune of 14,929.


Certain scientists of varying fields, as well as politicians and activists, make surprisingly large sums of money promoting the "Sky-is-Falling-due-to-Man-Made-CO2."  Therefore, they have a massive conflict of interest.  Doubly therefore, you will NOT hear the truth or even counterpoint from them.  

Incidentally, did you ever wonder why Al Gore refuses to debate anyone on atmospheric science?  Well, the answer is summed-up in the following instance:  Al Gore once went on the late night NBC talk show (hosted by high IQ bearer, Conan O'Brien) and Gore proceeded to state that the center of the Earth is millions of degrees.  Try 9,800F to 10,800F.  If the Planet Earth's interior were millions of degrees, it would have long since vaporized, literally.  

Anyway, that one video clip shows how entry-level and how lazy in education Al Gore is when it comes to any of the Earth sciences.  He's simply a con artist who holds an obscenely high amount of money that he didn't have in his possession, until after his very non-factual movie came out in 2006.  That movies' assertions (aka declarative statements) are easy to pick apart ...chess piece by chess piece.

Needless to say, the goal in all the climate exaggerations and in  all the censorship of climate whistleblowers, is this:  To keep all of mankind convinced that a rise in the co2 level will automatically result in a rise in temperature and a rise in "weather disasters;" --- and to simultaneously have mankind believe that all of the weather disasters are caused by industrial factories and the operating of combustible engines, instead of decadal ocean oscillations and/or the Sun Spot Cycle (aka the Milankovitch Cycles) and/or orbital forcing (the slow change in the earth's degree of tilt.)

BTW, the end of the last Glacial Maximum (aka Major Ice Age) came about from heat rising from the oceans.  It took that heat 1,300 years to rise to the top.  To understand that long length of time, you need to understand Eckman Transport (kind of a cork screw rotation of the layers of ocean water, due to the Coriolis Effect) ... and you have to understand the behavior of an ocean layer called the Pycnocline and "density gradients."  All in all, atmospheric science and oceanography are not as simplex as Al Gore made them out to be.  Al gore is what is simplex; not the oceans and definitely not the atmosphere.


Even in mentioning coal, the media only mentions its emission of life-giving co2 in a demonizing fashion, all the while omitting from the conversation the true pollutant in coal --- namely, deadly airborne mercury.  Coal needs high tech filtration processes --- or coal needs a clever natural filtration process that only the common-sensed worker can conjure.

The great outrage of obsessing over man-made co2, in a Troposphere that contains less than one half of one percent of co2, is that the true environmental enemies of mankind are ignored and neglected for the most part.  Today's great environmental enemy is ===>  

. . . the irresponsible distribution & use of synthetic chemicals, as well as the dissemination of any petrochemical that goes unfiltered or unregulated. Add to this short list, the use of toxic construction material and furniture-making material.  Fracking liquid need to be audited and then amended, too. Plus, lead lateral lines count too as toxic enemies of mankind and life on Earth, along with the aggravation of leaded gasoline residuals.  CO2, however, is the friend to life on Earth.

BTW, it was found that the largest cause of diesel particulate pollution was engine part abrasion.  The larger particulates simply succumbed to gravity, while the more light weight particulates floated about.  So, it wasn't a fossil fuel problem as much as a metal abrasion problem.   None the less, petrol requires filtration.

Even at that, before you replace a major commodity of society, you first arrange of its replacement to be made available in abundance.  You do not cut mass populations off of the needed commodity, and expect them to buy things too expensive for the average human, as well as not in an inventory abundance equal to the population.  The most asinine of people are presenting running society.


A review of the contradictions of the corporate advertising media, in its collective man-mad-co2 doom predictions, includes the following:

{1} CO2 levels having been 9+ times higher during the Ordovician Ice Age than today.  {2} The graph presented by Al Gore at the start of his first movie having been narrated backwards, in that ice-cores showed that a rise in global temperatures came first, followed by relatively a small rise in the co2 level.  Plus ===>

{3} The atmospheric physics rule of pressure gradient forcing which means that warm periods do not have hurricanes and other low pressure storms in high numbers.   {4} The Year 2021 having been a year of record high crop harvesting and record high agricultural exportation for India, Australia, and the United States, thereby proving wrong Al Gore's predictions of crop disaster in any heightened co2 environment.

In fact, growers purposely add co2 to their greenhouse air.  Those growers proved that, if you want to go green, you must increase the co2.

Another great irony in co2 is that, in its liquid states, co2 is commercially used as ... a refrigerant.  

Zero major hurricanes made landfall in the U.S. between Wilma (2005) and Harvey (2017)

In fact, the great irony about the first Gore movie is this:  The year after the movie was released, the U.S. did NOT have a major hurricane making landfall on its shores for 12 consecutive years.  The opposite of what Gore predicted in that movie occurred.  It's now 18 years later, and there still has NEVER been a Category 6 hurricane.  Plus, NO hurricane ever rose to the speed of an EF4 or EF5 (T10+) tornado.  Hurricanes did NOT become more intense, in any capacity, as Gore's predicted. 

The hurricane record, alone, proved that Gore was and is a lying & thieving  charlatan.  None of his doomsday predictions ever came true. 

Failed doomsday predictions:::  1} The Maldives did NOT go underwater, but instead, became frequented by financially affluent Arabians who are apparently really really happy with the place.  

2} The Arctic Ocean has not even come close to an ice-free Summer.  The closest to Gore's prediction was 1.32 MILLION square miles of ice remaining intact at the end of the Drought Year of 2012.  That's the lowest. 

3} The previously mentioned "Category Six Hurricane" prediction & the general intensification of hurricanes prediction.   Include the previously mentioned fact that never in known history was there any hurricane equal to an F4, EF4, or an F5, EF5 tornado.

4} Gore predicted that lower Manhattan would go underwater.  Everyone in New York, New Jersey, and everywhere else knows that it didn't do so.

The true carbon footprint left behind by co2.  CO2 is the "going-green" molecule.

Now, there was the relatively recent change of data numbers of past charts, tables, and grafts related to climate and weather. They are now the amended charts & graphs, done in the name of "homogenization."   Thus, the record heat that was reported in hundreds of newspapers in the 1930s is now recorded by NOAA as not worth our attention.  And even though research scholars proved, via proxy evidence, that 1934 was the worst drought in one thousand years, it will no longer indicate this on certain adjusted government graphs of recent.

The De Facto Original Climate Record

Keep in mind that the newspapers of old (as in the weather disaster Years 1871, 1878, 1911, 1913, 1921, 1922, 1934, 1936, etc) additionally reported on the human pain experienced, as well as the heat deaths, the fire deaths, the crop losses, and the mass exodus from cities during heat waves; not just the temperature numbers.  Thus, the newspapers are the original climate record.  

This means that, if today's amended numbers in the charts, tables, and graphs of the National Oceanic & Atmospheric Administration fail to reflect the newspaper reports of the actual temperatures, the pain, and the loss reported at the time of the actual weather disasters, then you have yourself a case of massive fraud, with the motive being the predictable ploy for Congressional money, NGO money, publishing prestige, etc.  

Let us review a couple of these weather disaster allegations which either qualify as outright frauds or as gross misinterpretations of valid data or erroneous data --- and therefore they constitute artificially created media hype designed to capture higher ratings:

Sample #1 of the endless end-of-the-world climate hysteria being once again disseminated throughout the airwaves ===>

August 2021:  Media giant CNN & US government administrator NOAA reported with full certainty that July of 2021 was the hottest MONTH for the entire planet in our collective lifetime.  Now, this would infallibly translate into guaranteed crop failure in major proportions, by September or October of 2021, according to the Al Gore Pretend School of Atmospheric Physics.  This would have also guaranteed that there would be no positive record-breaking crop success anywhere in the same year.  

 Newsflash:  The 2021 American, Indian, and Australian harvests were the opposite of the type of harvest that results from disastrous heat.  NOAA's Rick Spinrad has a lot of 'splaining to do.

Undeniable Fact #1:  The United States Department of Agriculture officially reported that the soybean harvest of 2021 resulted in the United States' all-time record HIGH.  The same USDA reported that the corn harvest of 2021 was near the United States' all time record HIGH.  In fact, 2021 cotton production was up 21% from 2020.   Thus, there was no heat-related weather disaster in the American farmlands, in 2021 ... especially in July.

See: soy at record high, corn near record high, cotton up 21%.

Moreover:   In the Year 2021 . . . in the year that was reported to have had the hottest month of July ever, and which would have infallibly resulted in widespread crop disasters . . .

 The USDA furthermore reported that the United States of America's "AGRICULTURAL EXPORTS SHATTERED RECORDS IN 2021," "eclipsing the previous record, set in 2014, by 14.6%."

 See:  U.S. agricultural exports shatter records in 2021.

In re: India's record rice production 

See:  India's rice exports up 46% in 2021

See also: India's 2021 rice production, 121 million metric tonnes.

In re: Australian Agriculture

 See:  Australian farmers harvest record wheat crop

Antarctica had its Coldest Winter in Known history in 2021

Yes, the supreme asininity of NOAA's doomsday heat claim of July 2021 consisted in the fact that Antarctica ended up having its coldest Winter in recorded history in 2021.  July 2021 was during the coldest Antarctic Winter in history.  This negated everything that the NOAA asserted.

The reason why July 2021 was claimed as such by NOAA was this:  In May & June of 2021, Greenland underwent winter conditions which was the undoing of the co2 Global Warming theory.  Then, in July, Greenland's surface temperature went up significantly.  So, the NOAA used the July temperature record to hide the cold temperature record of the preceding months.  This is a form of deception.

We continue with the sham report (or else the heavily misinterpreted report) about July 2021.  Now, it was reported to have been the hottest month worldwide, in the lifetimes of everyone alive.  Well, observe the temperature reports of the entire month of July 2021, in the following sample of international cities.  So, where is all this man-made co2 driven temperature anomaly doom?

Ladies & gentlemen, I first present to you Mexico City, a place far south of the hot hot southern states of the United States.  Looking at its July temperature record instantly makes you ask, "Where are all the hideously high Summertime doom temperatures, during the hottest July of our lifetime?"   During July 2021, a person literally had to wear a light jacket at night, in Mexico City.

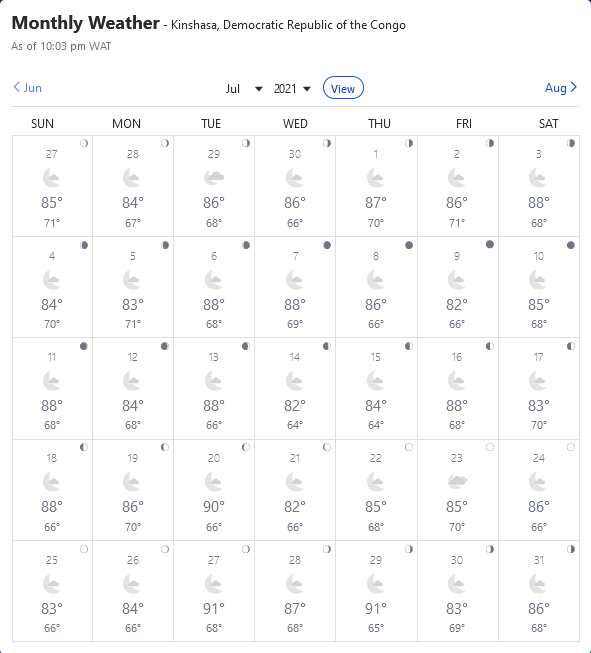
Let's now go to the capital city of the African Congo.  It's called Kinshasa, and it should have been exceptionally hot in that African town, during the hottest month in human memory.  Right?  Well, there was nothing to write home about.  All July 2021 days there were in the 80s Fahrenheit, except for three days in the low 90s.  Two days were at 90F and one day was at 91F.  This does NOT constitute the kind of weather disaster you would expect to witness during the hottest month known to living beings.   

]In all honesty, the hottest of the hot years were 1931, 1934, and 1936.  In fact, the hottest daily temperature ever recorded occurred during 1913.  Hottest months should be located within those years.

We now travel to the African capital of Kenya, Nairobi City.  It should have been super hot there, during the hottest month in human memory.  Right?  Not even close.  In July 2021, there was NOT a day over 75 degrees Fahrenheit.  So, where is all this Kenyan Global Warming doom that Al Gore mentioned in his 2006 movie?  It looks like someone was committing pretty intense fraud, in the making of that movie.

Let's take a look at Los Angeles, in July of 2021.  LA should be a high temperature place during the hottest month known to all the living.  Well, it wasn't.  It was average Summertime temperatures.  Nothing epic. Nothing apocalyptic.  Only one out of 31 days in the low 90s.  You could find this kind of weather up north.

We travel further eastward, to the modernized megacity of Mumbai, Maharashtra, India.  It's located at the center of the Western Indian coastline, next to the Arabian Sea which, too, is supposed to be undergoing ocean warming at the hands of evil evil man-made co2.  

Plus, Mumbai is a Northern Hemispheric city, at the same latitude as is Mexico City.  Well, in July 2021 not a single day was over 92 degrees Fahrenheit, and after July 7, 2021, there was not a single day over 89F, in Mumbai.  And remember, there are cities, such as New Dehli and Phoenix Arizona, where temperatures are habitually over 100F, two weeks in succession, even with temps going into 111F or 112F for consecutive days at a time.  Mumbai is not one of them.   July 2021 was a typical month there; not the hottest in memory.

We continue our rotation around the Earth and land in Quito, Ecuador.  Now, this is a place where the angle of the sun makes a direct hit.  So, the hottest month in the memory of every living human should have been one where Quito was absolutely cooking.  Well, there was no heat wave in Quito that month.  Throughout that entire month (July 2021) in Ecuador, it was Autumn coat weather.

I can go further, with numerous examples.  But, hopefully you get the message.  You have been the recipient of distortion and dishonesty, at the hands of power abusers.

March 17, 2025

Greenhouse Gases with very low Numbers, as in 1 part per THREE million, 1.909 parts per one million, and less than one-half of 1% of the atmosphere.

Thesis Statement of the Hour (or day) (or century):  If the world comes to its end within the next "12 years," it will be from Nuclear Winter, and NOT from any type of Global Warming.  Remember, there was ZERO Global Warming from 1999 until the middle of 2016.  In addition, there was the decline hidden by math trickster Michael Mann who NEVER won or co-won any type of Nobel prize in existence.  Yet, it really did get really cold throughout the 1960s and 1970s.  To deny this is to insult the intelligence of anyone who lived through those two decades.
Question:  Uhmmm, where is the man-man-co2 driven Anthropogenic Climate Crisis, again?
American Sales Training

In American sales training, the trainees are told that one must create a sense of urgency in the potential buyer's mind, in order to make a sale.  The Global Warming Hysteria is the act of scientists trying to make a sale.  They are doing everything they can to create a sense of urgency, allowing school children to be filled with dread, in the process.  

And of course, the goal is to gain massive Congressional funding and/or NGO donations, along with the absolute power one gets when an emergency is declared.  So, the picture constantly being painted by the Michael Manns and John Kerrys of this world is that the world will soon come to an obliterating end, and only they can save it.  So remember, they're too good for you.  You should shut it and say, "Yaas sir" to everything these guys who happen to be white have to say.  They are willing to dictate, but they refuse to debate or to explain themselves to you ... because you and I don't count.

~ ~ ~

Okay now:  Back to trying to make sense out of the constant declarations of a near-death Earth in an emergency, while the stats, facts, plain sight of  Planet Earth, and its history show the exact opposite to the Declaration of Climate Doom.

Let me try again.  Now show me in this graph where the end-of-the-world, man-made climate crisis is, again?  I'm having trouble finding it.

Okay.  One more try.  How about this chart?  Now, the man-made climate crisis which is causing the immediate end-of-the-world is indicated exactly where here?  Me no can find.

We now bring greenhouse gases onto the scene

Climate Doomsayers mention that co2 levels started to rise at the beginning of the Industrial Age which is defined as having begun circa 1760.  Fair enough.  That was 262 years ago.  Well, science data shows that co2 levels have been rising in the Earth's atmosphere for the past 6,700 years.  

Of course, the rate of rise has advanced significantly in the 21st Century.  Therefore, if you are searching for correlations in the rise in atmospheric co2, look at the significantly advanced growth rate of the human population for the same time span.  Then compare it to co2 levels.  

In fact, compare corn crop harvests to human population growth and to the rise of co2 in the Troposphere.  The graphs' lines look very similar.

In as much, Climate Doomsayers have shown definitive signs of being eugenicists at heart, if not manipulative & pernicious ones in application.  After all, do you deny that these same alarmists see humanity as the great enemy of the Planet Earth?  

Whatever be the case with the psychological components of the typical Climate Doomsayer, the center of each one's activism is Carbon Dioxide, when it should be mercury, residual lead, synthetic chemicals, sulfur dioxide, and the irresponsible stewardship of plastics.  So, let us review carbon dioxide, while first making a quick review of the Earth's Troposphere in general:   

The Troposphere's Dry Composition

Dry composition means that you leave out water vapor from the equation.  Water vapor in the atmosphere exists in varying quantities throughout the Earth, ranging from .2% (2/1,000th) of the Troposphere to 4% (4/100th) of the Troposphere.  Thus, it's a variable, as opposed to a constant.

None the less, cold air is always dry air.  This is counter-intuitive, being that hot deserts are associated with dry air.  Well,  Antarctica is the driest desert on Earth. 

For now, water vapor percentage numbers are omitted from the simplex equation below.  When it's included to the dry composition, it's known as the Mixing Ratio .  The following numbers generally apply at a relatively constant percentage:   

The Troposphere comprises 78% Nitrogen, 21% Oxygen, & 0.93% Argon.  This means that 99.93% of the Troposphere is NOT carbon dioxide.   This furthermore means that co2 is a Trace Gas which is too small in quantity to drive the climate.  In fact, Climate Change has been naturally occurring throughout the existence of the Earth,'s atmosphere, like a roller coaster, despite the level of co2.  

When Climate Change has arrived naturally in years, centuries, and Millennia past, the change has been sudden.  The only possible drivers of such a sudden impact throughout the Earth is either 1} Sun Spot Activity or other solar behaviors which affect the Earth's Magnetic Field or 2} Ocean Oscillation Behavior.  There is no other known factor which would be a candidate in possessing such potential.  

As a pertinent point made in passing, the Sun's Irradiance is NOT a factor, being that it is mostly constant.  Those emissions from the sun which do vary do matter.  At your convenience, look-up Coronal Mass Ejection (CME).  Look up the Milankovitch Cycles.

A Numerical Review  ===>  Firstly, today's level of atmospheric co2 is 418 parts per million, whereas, during caveman days, it was 260 ppm.  In fact, at the end of the most recent major Ice Age, it was 180 ppm.  Today's co2 level translates into 0.042% of the Troposphere.   In as much . . .

 99.93% of the Troposphere (Nitrogen, Oxygen, Argon) + co2's 0.042%   =  approximately 99.972%

~ ~ ~

This leaves us with approximately 0.028% of the atmosphere which is occupied by the following Trace Gases:

1} Xenon, 2} Helium, 3} Hydrogen, 4} Krypton, 5} Neon, 6} the vilified Nitrous Oxide, and 7} the vilified Methane which, at last count, existed in the Earth's 21st Century atmosphere at no more than 1.889 parts per million.    That's One-Point-Eight-Eight-Nine Parts Per Million.   And Nitrous Oxide, as was previously stated, is 1 part per 3 million, aka 330 ppb ... with the "b" meaning, billion.

Water Vapor:  80% of all greenhouse gases by mass and 90% of the same, by volume.

Now, water vapor exists in variable proportions throughout the Earth's atmosphere, due to the differences in temperature, pressure systems, & land elevations throughout the Earth.  It's presence in the atmosphere ranges from 0.2% to 4%.  In fractions, water vapor is  1/500th  to  1/25th  of the atmosphere.

In terms of a fraction, as of 2022, co2 amounted to 21/50,000th of the Earth's atmosphere.  If you were to compare the atmosphere's molecules to a Rose Bowl audience, 78,000 of the spectators would be Nitrogen, 21,000 of the fans would be Oxygen, 930 would be Argon, 42 would be Carbon Dioxide.  Methane and Nitrous Oide wouldn't even make the scene.

The Cirrus Cloud Factor, a Predominant One

At this point, another revelation needs to be repeated ===> Cirrus Clouds possess far more ability to capture / absorb / retain infrared heat than does co2.  The great irony here is that cirrus clouds are entirely composed of ice.  

In addition, the irony about Carbon Dioxide goes as follows, especially in light of the fact that modern activists accuse it of orchestrating a conspiracy to heat the world to the point of destruction:  In its liquid state, Carbon Dioxide is commercially used as a  . . .  refrigerant.

Inconvenient Goof

Concerning the large CO2 graph that Al Gore presented to the audience at the beginning of his first science fiction movie, that which actually is shown is that temperature first rises.  Then co2 levels follow ... in terms of centuries later.  The rise in air temperature comes first.  Then the rise in co2 follows.

The understanding is that, as the oceans' surfaces warm, evaporation occurs, and more co2 molecules are released into the air.  But, the warming of the ocean comes first.  All in all, claiming what Al Gore claimed about temperature & CO2 . . .

          . . . is equivalent to claiming that "the steering wheel moves the driver's hands."

https://i2.wp.com/climatechangedispatch.com/wp-content/uploads/2018/04/Holocene-CO2-10500-Years-Ago-to-1800-AD.jpg?ssl=1
Now remember, co2 levels have been rising for the past 6,700 years.

 Concerning that time or two when you heard someone say, "If they could tax you for the air you breath, they would do it."   Remember that, the climate doomsayers are trying to do this in the inverted way.  They are trying to tax you for the air you exhale, proverbially speaking.  Well . . . 

The average human exhales 2.3 lbs (circa 1 kg) a day --- 839 lbs a year x 7.9 billion humans = 6,628,100,000,000 lbs  = 3,314,050,000 US Short Tons per year.  It might sound alarming, but 'tis no big deal in the grand scale of the massive-sized Troposphere.  Don't let anyone spook you into Eugenics.

 Most Important Feature of co2 as it Applies to Infrared Light

CO2 has three varying vibration modes, concerning polarity which, in co2's case, is dipolarity.  In one of those three vibrations, co2 is incapable of capturing infrared heat.  This is how & why there can be an ice age during a time when co2 levels are 9 times higher than today.  Such a thing actually happened on Planet Earth.  During the Ordovician Ice Age, co2 levels were more than NINE TIMES HIGHER than they are today.  This negates the Al Gore & John Kerry assertion that rising co2 levels raise the temperature commensurately.

Extremely Important:   CO2 Vibration Modes   <=====

                                    *******************

And remember, it has been recognized that the radiative forcing of co2, when it can capture infrared heat, is 3.7 watts per meter squared.  That's a night light.  After all, CO2 is plant fertilizer ... NOT jet fuel.

And remember folks, photosynthesis comes in many colors.

The True Correlation, or lack thereof, between co2 and land surface temperatures:

 In contrast to the predictions of doom, it has been repeatedly observed that, as the co2 levels on Earth rose throughout the 20th & 21st Centuries, the life expectancy of humans also rose throughout the world.  And amidst the political damning of life-giving co2, the Earth has been increasing its acreage of greenery, as well as enjoying rising crop harvest numbers & record crop harvests.  In as much, if you want to go green, you must first increase the co2 level in the Earth's atmosphere. 

See:  How an increase in co2 increases plant size   

    &  NASA Studies a Greening Arctic  

Also See:  Study Observes Rising co2 Levels & the Re-greening Effect on Earth

All in all, Carbon Dioxide replaced the Iraqi Weapons of Mass Destruction, as an excuse for creating fear amongst Americans.  The Weapons of Mass Destruction Scare was in 2003 & 2004  The CO2 Global Warming Scare started with the first Al Gore movie, in 2006.  Ever-so-Coincidental Timing.

March 16, 2025

Antarctica's smallest "sea ice extent maximum" (2023) was the size of RUSSIA.

This is an October 2023 NASA satellite product.  Take a look at the vastness & magnitude of sea & land ice that was present at the Southern Polar Cap, during a time when certain propagandists claimed that Antarctica was in an "once-in-a-7.5-million-year" "extreme ice melt."  Well, that's extreme bull crap.  Compare the ice sheet's size to Australia and South America.   
Newscasters of 2023 reported that Antarctica was in the process of "extreme" ice melt during its 2023 Winter Season ... during its six months of sun-deprived darkness.  In fact, one journalist claimed that the Weddell Sea was a melting mess.  Well, the asininity in believing this assertion is that the Weddell Sea comprises 1.08 MILLION square miles of surface area, and its widest section spans 1,200 miles across.  Something that size will not melt while there is no sunlight to melt it.

Furthermore, the Weddell Sea's continuous ice sheet is connected to the Ronne-Filchner Ice Shelf which happens to have the same surface area as does California.  Historically speaking, the gigantic Weddell Sea has been known to have tight ice packs.  Moreover, temps throughout Antarctica are usually -10 to -60 degrees Fahrenheit, during wintertime.  Therefore, to claim that air temperatures were drastically melting Antarctica during the dark & sunless wintertime is to spread two pivotal lies in one statement.  

[1a] The actual fact is that not as much sea ice formed around the Antarctic Continent in 2023, as it did last year ... or the year prior (when Antarctica had its coldest winter in recorded history) ... or during any year of the Satellite Era.  This means that 2023 was declared to be the year with the least amount of MAXIMUM sea ice extent.  Yet, 90% of the sea ice which usually forms around Antarctica each winter did form in 2023.  As you can see in the NASA product above, there is still a super massive amount of ice within ... and also beyond ... the Antarctic Circle.  The concept of "massive ice loss" is a massive lie.

[1bi] Let it be repeated:  The Antarctic Winter of 2023 was NOT a matter of melting ice.  It was a matter of not as large an amount of sea ice being formed around the Antarctic continent as usually forms there.  Even at that, only 10% less was formed there.  There was no "warm air" melting Antarctic sea ice during the Winter of 2023.  Antarctica was simply forming only 90% of the sea ice that it usually does.

The Russian landmass is 6.32 MILLION square miles.  The 2023 Antarctic Maximum Sea Ice Extent was larger than Russia, at 6.55 MILLION square miles.  And 2023 was the year of the least amount of sea ice surrounding Antarctica, during Antarctic wintertime.  The lesson here is that Antarctic wintertime sea ice extent has been massive every year.
[2a]  The lowest amount of "maximum sea ice extent" is not that much less than the usual amount that has been measured, year after year, from 1981 to 2010.  The usual amount of Antarctic sea ice extent is known as the "median."  The median is the middle number in a list of numbers.  

[2b] In addition, "sea ice extent" is defined as being any surface area of the sea which is comprised of 15% or more of ice.

[2c] Likewise, the highest amount of Antarctic sea ice extent ... which occurred in 2014 ... was not at all very much higher than the median --- than the usual amount.  All in all, there was no extreme ice melt in 2023, and there was not even "extreme" sea ice absence in the same year.  Likewise, there was not any extreme sea ice gain in 2014, even though 2014 was the year of the most sea ice area in the Satellite Era.  The hyper-exaggerations must cease on both sides of the equation.  

We now proceed to the Sunspot Cycles Illustrated ... throughout the past.

Notes:  [1] In 1980, during a high sunspot year ... during a sunspot cycle summit ... Dallas Texas had FORTY-TWO consecutive 100F+ days.  [2] The Year 2003 ... a high year for the Sunspot Cycle ... was tragically hot, especially for Paris.  [3] There was a drought in America from 1988 to 1990, and that was during a very high sunspot activity time span.  [4] 1983 was recognized by NOAA as the most active sunspot year, for most of the months in that year.  Go and read about the North American Drought of 1983-1985.  It was during that drought when global warming was first mentioned on TV. 

In going further back into history, the highest sunspot activity between 1600 and 1800 C.E. occurred two years prior to the year of the most deadly hurricane in history.  The deadliest Atlantic hurricane emerged in October of 1780.  It resulted in 22,000 or more deaths.

In the following year, the French Navy made sure that it was not going to get caught in another Caribbean hurricane season.   So, the French fleets travelled northward, to help General George Washington in the Battle of Yorktown.

However, this 1780 hurricane would usually be a contradiction, pursuant to the law of Pressure Gradient Force.  This is because cooler atmospheric conditions are accompanied by the more turbulent skies than the much warmer ones.  So, the question for this event would be ===>  'How much cooler was the Arctic than the Equator at this time?'  After all, the more distant the temperatures between the Polar regions and the Equator, the more turbulence there is.  The point to mentioning this hurricane is that far more destructive natural disasters occurred when atmospheric co2 level was much lower than it is today

In addition:  [I] There was the Blizzard of 1996, during a low sunspot year.  [II] The Winter of 2007-2008 had record cold weather, and that occurred during a low sunspot cycle year.  [III] Accuweather regarded 2009 as having been "defined by snowstorms of historic proportion and record cold."  This was during a solar cycle low.  [IV]  The Winter of 2009-2010 started with a great blizzard.  It also occurred during a solar cycle low period.  

And of course, this is posted pursuant to the U.S. Fair Use Act; 17 USC, section 107.

Added Examples, compliments of the Royal Observatory of Belgium, in Brussels

WWII was known for viciously cold weather during some of its battles.  Bastogne, in late 1944, is one such example.  Below is the sunspot record for 1944, and of course, the index below is posted pursuant to the US Fair Use Act.
Below:  1958 had its share of heat, and the sunspot record of that particular year goes as follows:
The lesson is that, it's very immature, asinine, and narrow-minded to reduced all considerations for climate assessment to the trace amount of co2 that exists in the Earth's atmosphere.  Doing so is merely a ploy to deceive you into thinking that you cannot live without Al Gore and other propagandists whose names aren't worth mentioning.  In reality, the doomsayer projections ... based on computer models and NOT based on observed outdoor reality ... claims that feedbacks will cause a revving-up of heating.  Yet, most feedbacks in nature are negative & depletive; not positive and accumulative.  In the past, cold periods and hot periods came all at once . . . not after a mythological "tipping point" is achieved.

Concerning any of those occasional heated-years not coinciding with the solar sunspot cycle, check to see if it were an El Nino Year.  This includes the El Nino year of 1976, when the solar cycle was at it low-point.  There was a tragic heatwave that year, especially in Paris.

Even though 2014 was a peak year in sunspot activity, it was in one of the lowest Solar Cycles, compared to the other ones in recent record-keeping.  That low-activity cycle was SC24.  And of course, 2014 was the year with the most sea ice extent maximum in Antarctica's modern record-keeping.  Yet, two years prior was the heat wave of 2012.  

Moreover, in the 1700s, co2 was far less in the atmospher than it is today, at 280 ppm.  Compared to today's 420 ppm, co2 was two-thirds of what it is today.  Yet, 1780 was the year of the most disastrous hurricane of them all ... thus far, in human history.   Thus, the claim that major hurricanes are more frequent and vicious today is a lie.  So too is the case with droughts.  

Climate is much more intricate than what the doomsayers claim it to be, as they reduce all consideration of climate to co2 which comprises less than 1/2 of 1% of the atmosphere.  Specifically co2 is 1/2,381st of Earth's Atmosphere.   This means that, for every 2,381 molecules in the sky, only one of them is co2.  That's not very much.  

If you were to compare the atmosphere to the Rose Bowl, then only 42 of the 100,000 seats would be occupied by co2.   78,000 of those seats would be occupied by Nitrogen, and 21,000 of those seats would be occupied by Oxygen.  In addition, argon would occupy 930 seats.

Concerning methane, only one seat would be occupied for every 5 Rose Bowls.  Methane exists at 2 parts per million on Earth, and it ready converts into co2 within Earth's atmosphere.  

Within the atmospheres of Venus and Mars, co2 exists at approximately 960,000 parts per million.  So, compare Mars' 960,000ppm to Earth's 420ppm.  There is literally 2,285 times more co2 on a much colder Mars than on Planet Earth.  Thus, there's no comparison between Mars and Earth, as well as Venus and Earth.

Water Vapor, aka Humidity, is the only greenhouse gas that affects Planet Earth

As far as goes "greenhouse gases," only water vapor carries any weight in this matter.  You have probably heard the phrase, "It's not the heat.  It's the humidity."  Well, the heat is literally in the humidity.  And of course, humidity is defined as "the concentration of water vapor in the air."  Moreover, cirrus clouds have infrared-heat-retaining ability also.  Cirrus clouds are ice.  Take note of the contradiction, where ice in the sky helps to keep the Earth from turning into a globe of ice.

Also keep in mind that one of the three molecular vibrations of co2 causes co2 to be incapable of retaining any infrared heat.  This is why there was an ice age when the co2 count was 9.5 times higher than it is today ... the Ordovician Ice Age.  BTW, the vibrations are called "dipole moments."

As far as goes the total amount of the September 2023's maximum Antarctic sea ice extent, it was literally the size of 81 Minnesotas ... or ...  115 Michigans.   That is NOT extreme Antarctic ice loss in any capacity or in any definition thereof.  You need to realize that you're being conned by the media, by your government, by in-your-face activists, and by scientists who want a share of that $370 billion US Congressional "climate appropriation."

The climate doomsayers hyper-exaggerated the whole thing, in order to scare you into submission.  For people who simply viewed a bit of weather history, by means of looking at archived newspapers, almanacs, weather reports, and magazines, the whole Antarctic Scare was so ridiculous that the "global boiling" people lost their credibility . . . as usual.  Temperatures were extremely hot in 1895-96, 1901, 1905, 1911 (tragic death toll), 1913, 1921-22, 1931, 1934-36, 1958-59, 1976 (tragic death toll), 1988-90, 1998, 2003 (tragic death toll), and 2012, as well as 1757, 1540, 1279, etc, etc, etc, etc.  Climate is cyclical.

[BTW]  Concerning the claim that the "burning of fossil fuels" destroyed the Florida coral reefs, it only takes one hurricane to uproot coral.  That is par for the course.  Moreover, when a hurricane comes and goes, it causes "upwelling."  This results in colder water and life-giving nutrients coming to the surface of the ocean area where a hurricane recently passed-by.  It's the sign of a money-grabbing fraud to blame every weather event on co2 and the "burning of fossil fuels."

[A] Remember, politicians hyper-exaggerate weather & climate circumstances to the point of claiming the existence of a crisis, in order to get taxpayer dollars into their districts, thereby getting themselves re-elected.  Activists do so, in order to get money into their 501C corporations' bank accounts and also into their own bank accounts, as commission salary.  United Nations personnel do the same hyper-exaggerating, in order to get money and influence also.  The whole thing is a money-grab & a power-grab.

[B]  Yet, the vocal & visual media mentions nothing of the real environmental disaster of today, namely =====> the glut of synthetic chemicals thrusted upon humanity, thereby affecting endocrine systems, respiratory systems, DNA chains, vulnerability to cancer development, and additional medical conditions.  Chemical influx is a form of assault and battery on susceptible bodies.  This too was previously explained at this site.  There's a search box at the top righthand side of this page.

[C] In review, the Antarctic "once-in-a-7.5-million-year" doomsday hoax and other climate hyper-exaggerations were a matter of nerd boys, politicians, and in-your-face activists vying for a share of that $370 BILLION (US taxpayer dollar) appropriation made by the US Congress.  The climate crisis town-criers want a chunk of that taxpayer dough.  They want a lot of G.W.s (George Washingtons).  They want Chase Manhattan cabbage leaves ... Crane and Company's finest greenery ... the Bureau of Engraving & Printing's finest scripted legal tender.  Yes, that is what they really mean when they say that they are "going green."  And green they have gone.

Going Green, anyone?   All aboard, as we terrify schoolchildren with predictions of climate woe.
[i] Now, the newscasters & journalists stated that the 2023 "loss of" Antarctic sea ice extent --- when comparing it to the usual "median amount"  --- was equal to the size of British Columbia.

[ii] The newscasters & journalists also stated that the "loss of" Antarctic sea ice extent in 2023 was equal to the size of British Columbia & Alberta Canada combined, when comparing it to the highest amount of sea ice extent ... of the sea ice which surrounded Antarctica in 2014.

[iii] The newscasters and literary journalists reported that the 2023 sea ice extent area was 398,000 square miles less than the previous record-low year of 1986.  And of course, this is literally the square mileage of 5 Minnesotas ... or ... 7 Michigans.  It's also the size of the Western African nation of Mauritania.  It surely seems like a lot of missing ice, until you realize how much sea ice extent did form around the Antarctic Continent in the Winter of 2023.  Observe:

 2023's Sea Ice Extent Max       The median Sea Ice Max         The 2014 Sea Ice Max

   6.55 MILLION sq miles             7.23 MILLION sq miles         7.72 MILION sq miles

Now, the difference between the most sea ice extent ever recorded during the Satellite Era and the least amount is 15.2%.  That is to say that 2023's sea ice extent was 84.8% of Antarctica's known record high.  This also means that the 2023 Antarctic Sea Ice Extent Maximum was the size of ELEVEN British Columbias.  The size of the 2023 Antarctic sea ice extent max was also equal to 25 Alberta Provinces.   It's furthermore 7.88 times the size of British Columbia & Alberta Province combined. 

For the record, British Columbia's land area is 574,884 square MILES.  The land area of Alberta Province (Canada) is 255,541 square MILES.  Together, both provinces comprise  830,425 square miles.  That happens to be the size of Greenland.  This means that the least amount of wintertime Antarctic sea ice extent was the size of SEVEN & a half Greenlands.  Greenland is 836,330 sq miles in surface area.  BTW, Saudi Arabia is the size of Greenland, in surface area.

Furthermore, the difference between the highest Wintertime sea ice extent and the usual amount (aka, the Median) is 7%.  Yes, the usual & expected amount of wintertime Antarctic sea ice extent is 93% of the record-breaking 2014 high.  Then there is the matter of 2023's sea ice extent being 90% of the usual Antarctic sea ice extent maximum.  Now, 90% of 7,230,000 square miles is a lot of ice.  Where is this "extreme ice loss?"

In review, NASA and other entities long since stated that it's expected for 85% of the wintertime Antarctic sea ice to melt, by the end of the Antarctic summer.  The same agencies stated that it's normal for 60% of the wintertime Arctic sea ice to melt, by the end of the Northern Hemispheric summer.  Thus, at the end of Antarctic summer, approx 15% of the sea ice should be remaining.  At the end of Arctic summer, a third of the Arctic wintertime ice should be remaining ... and less will be remaining during an El Nino year ... and also during the high year in the 11 year sunspot cycle.  (The sunspot cycle is a discourse of its own.)

Antarctica's South Pole & Dome C (southeastern AQ) in September of 2023.

It's not exactly April in Paris, boys & gargoyles.  When you pack for your trip to Antarctica, you do not need to take any suntan lotion ... or sunscreen.  The temperatures on the two calendars below here are 2023 temperatures.  Well, 2023 was supposed to be a once-in-a-7.5-million year Antarctic meltdown.  The two temperature calendars below show the opposite.

We continue with "the math"

It is a pivotal lie to claim that Antarctica has been going through a trend of ice loss and temperature increase for years.  This is because the coldest known wintertime in Antarctic history occurred two years ago, in 2021.  This, alone, destroys the entire co2 narrative.  CO2 was on the rise for decades, before & while Antarctica had its coldest known winter in history.  If the "CO2 Narrative" were true, then Antarctica would not have come close to having had its coldest winter two years ago ... or four years ago ... or six years ago ... or 26 years ago.

Plus, the Antarctic Peninsula is a lot closer to Chile than it is to the South Pole.  The distance between the South Pole and  the Antarctic Peninsula is 1,550 miles (from Rothera Station), 1,712 miles (from Vernadsky Station), and 1,840 miles (from Esperanza Station) to the South Pole.  Thus, one expects the Antarctic peninsula to be less cold than the interior sections of the 5.4 million square mile Antarctic Continent.  Part of the Antarctic Peninsula is outside of the Antarctic Circle.

Antarctica is a desert.  There are places there which have not received rain or snow in extremely long time spans.  Both Polar Caps of Planet Earth are high pressure & dry air convention cells.  Furthermore, when you have extremely cold weather, you have dry air.  

Now, a newscast claimed that the 9.5% less of the wintertime sea ice median harms penguins.  The claim was that penguins need ice to spawn a new generation of penguins.  Well, penguins look for dry land, in order to enable them to keep their eggs warm.  If you want penguins to become extinct, make sure that all of the Antarctic Continent is under a sheet of ice.

Now, look at the NSIDC's October visualization for Antarctica below.  You will see a lot of area occupied by ice.  There is no super massive Antarctic ice loss transpiring.  The Antarctic climate hysteria is merely a pathetic attempt at con artistry.  These people should be sued for gigantic amounts of money in a class action lawsuit, for the Intentional Infliction of Emotional Distress, especially upon the schoolchildren they have been unjustly terrifying since 2006 and the showing of Al Gore's absolutely pathetic science fiction movie.  

BTW, the glaciers on Kilimanjaro do NOT undergo melting.  They undergo "sublimination."  That's when ice turns into water vapor without first melting into the liquid state.  I've already explained sublimation at this site, in another discourse ... in another post.  There's a search box above, to the right.

Federal Communications Commission

Those climate-hysteria entities should also have their FCC licenses revoked, based on "failure to serve the Public Interest."  The doomsday scientists, activists, and politicians are inciting violence, in telling weak minds that the world will soon come to an end, if you let people use gas stoves.  

There is also the matter of the False Claims Act which involves whistleblowers filing a civil action in federal court.  The original complaint is then kept confidential for a short period of time, and there's more to mention about the procedure.  It can be learned online ... or in a law class.  I don't have the time to explain it.  Others have already done so.  

BTW, when a False Claims Act complaint is filed, keeping it temporarily confidential is known as placing the complaint "in camera."  This refers to being kept in "a private chamber," so that no one can read it.   In Latin, it was known as "in pectore," meaning "held to the breast," so that no one could it.  Some American legal language needs to be changed, pursuit to the change in language since the 18th Century.

The thesis statement is that you are being lied-to massively.  All you have to do is look at weather history & newspaper archives, NASA satellite imagery,  NSIDC visualizations, an atmospheric science book or two, a bit of oceanography textbook material, etc.  

When you find the textbook material, look up [1] Pressure Gradient Force (as in Baroclinic and Barotropic stability/instability,) as well as Eckman Transport & the Coriolis Effect.  All in all, the media and certain scientists ... along with in-your-face activists ... think that you are far too lazy to read and far too stupid to understand anything that you read, anyway.  Yet, the material which proves their assertions to be blatant falsehoods is easily attainable at present.  The politicians, activists, and scientists see themselves as superior minds, possessed with the ability to cleverly trick you . . . to trick you, a member of "the little people."  

Yes, you're the "little people."  The problem is that they are the stereotypical high school, [1] nerds, [2] dorks, [3] wedgie-boys, [4] dweebs who repulsed us during our high school years.  And of course, they are still creeping us out, to this day.  Are you going to let nerd boys dictate your life?

March 15, 2025

March 18th Antarctic plateau temperature rise: Warm Australian winds. Not caused by co2, as is evidenced by high (sunlight reflective) snow albedo.

NASA photo of none other than Antarctica
Let's take a few moments and look at the March 18, 2022 media reports on the Antarctic Plateau temperature rise, as was reported by the French and Italian scientists at the Concordia Dome C Research Station.  The temperature reading was conveyed as "provisional."  That denotes conditional ... contingent ... yet to be confirmed ... definitely not final.  

The report was that the Antarctic Plateau (located 10,607 feet above sea level) reached an extremely unique high of 11.3 degrees Fahrenheit (It should have been marked at 10.76F, by the way) and MINUS 11.8 Celsius. 

The average temperatures of the Concordia Dome C region for that day are -62F for a high and -75F for the low temp.  In addition, March 18 is the coldest day of the month for that area, statistically speaking.  THUS, it was a temperature anomaly wave, as opposed to a heat wave that occurred for about five days there.  Yet, it involved big numbers, relatively speaking.

This March 18 temperature did get news coverage, but it would have been an insult to even the average intelligence to have blamed the temperature on co2.  This is because the Antarctic Plateau is shear white, and the Albedo of ice/snow is 85, meaning that 85% of all the sun rays which hit a sheet of snow/ice reflect back into outer-space.  That means that . . .

. . . there simply isn't the presence of infrared light at the Antarctic Plateau to affect or effect temperature there.  

Now remember, greenhouse gases have no power in the absence of infrared light.  Therefore, greenhouse gases are instantly ruled-out as a cause of anything decisive where there is there is the whiteness of a snow-scape or an ice-scape.  

As was proven via the many heatwaves & droughts of centuries past (when co2 levels were 108 to 138 ppm LOWER than today), CO2 is NOT the driver of climate in any capacity.  Rather, CO2 is the driver of PHOTOSYNTHESIS, and without photosynthesis, life on Earth eventually ceases.  To kill off co2 is kill off mankind.  This explains why pro-abortion activists are obsessed with the Al Gore "Climate Change" doctrine.  They hate humanity and want to kill it off, as much as possible.

They claim that mankind is killing Planet Earth.  But, the statistics are that Planet Earth has been killing humanity very successfully throughout the centuries, via:

{1} hurricanes, {2} tornadoes, {3} droughts, heatwaves & crop failure, {4} plagues, {5} tsunamis, {6} volcanoes, {7} cold spells, {8} lightning strikes, {9} wild animal attacks, {10} shark attacks, {11} blizzards, {12} avalanches, {13} allergic reactions, {14} poison mushrooms, {15} poison plants. {16} heavy metal contamination, {17} forest fires, {18} floods, {19} pestilence, and {20} EARTHquakes.

It's a mystery that any human is still alive on Earth.

Now, the co2 levels of 2021 were the same as 2022, and 2021 is when Antarctica had its coldest winter on record ... in all of known history.  Thus, if you have two drastically different types of climate while having the same one co2 level, then co2 did not cause the drastically different climate events which occurred in less than 8 months' time.  The case is closed on this.  However, the students of the American public school system, having been as brainwashed as any students of centuries past, will hold on to that belief.  This includes the stubbornness and insistence of Hitler's Youths.

The higher than usual temperature of March 18 on the Concordia Plateau was said to have been caused by warm Southeastern Australian winds and "an atmospheric river." That phrase is new to me, UNLESS it's meant to describe the reality that the air above oceans is LATENT HEAT.  But, apparently, it didn't mean that.

None the less, a review of the Specific Latent Heat of Vaporization is essential for all beginners-novices.  Therefore, the following will help, after the following quick intro:

Q:  What is heat?  ANS #1:  It's energy.  ANS #2: It's transferable energy.  ANS #3:  It's transferable energy in motion.  More Specifically:  It's transferable kinetic energy.

Q2:  How does it transfer?  ANS: Via convection or conduction or thermal radiation (which involves electromagnetic radiation.) 

In as much, hot air rises.  Cool air descends.  Low pressure rises.  High pressure descends.  Plus, wherever you have cold air, you have dry air.  For now, that which matters is the Latent Heat of Vaporization (aka Enthalpy)  There also exists Latent Heat of Fusion.

See:  Latent Heat Tutorial

Also see:  Additional Latent Heat Tutorial for beginners

Now, an atmospheric river is described as something that carries a tremendous amount of water.  Well, it was NOT humid in Concordia on March 18.  

I simply assumed that the Australian winds rode the Latent Heat altitude above the Southern Ocean and then traveled inland for 680 miles, up the incline that leads to the Antarctic Plateau.  

Maybe the winds were of the Chinook variety ... the Foehn variety ... the Santa Ana variety ... downsloping.  However, downsloping winds compress as they rapidly heat.  The Concordia Plateau was low pressure city.  Yet, there was a climb up an incline that was the height of a mountain.  This translates into Adiabatic Heating and Orographic rain.  Such a thing is usually followed by instant heating of compressed wind going down a mountain.  

The difference with March 18, 2022 was that the wind was NOT traveling downhill in a compressed state.  It was crossing a plateau at low pressure.  But, it was exceptionally hotter than expected, even though it still remained well below freezing temperatures.

After all, if it were a matter of orographic rainfall following the path of the 10,607 foot  incline, the report would have mentioned at least a token amount of rain.  Did it?  I didn't see any rain report.  Well, it should have rained in the desert called Antarctica, being that, when air rises, precipitation falls.

If orographic rain were involved, then this was a typical adiabatic heating event, and there had to have been an actual atmospheric river floating across Antarctica.  Yet, it was such a rare event for a typical action to have caused the rarity.  None the less, the Global Warming Lobbyists made a spectacle out of this event.

The most important factor is that co2 did NOT cause this, evidenced by snow's high albedo and therefore it's high reflectivity of sunlight back into outer-space.  Period. 

Latent Heat

Concerning the oceans emitting latent heat, this phenomenon is what happens when "super-cooled" water has it's temperature raised to 32 degrees Fahrenheit.  As the temperature rises to the usual freezing point, heat is released.

Incidentally, super cooled water is that which remains liquid even though it's below 32F.  As the super cooled temperature rises, calories of heat are released into the air above the ocean surface.  Did anything like this happen between Australia and Antarctica on March 18, 2022?

One question at this point:  Why is super cooled water still liquid when below 32F?  ANS:  That water has not yet released its calories.

~~~

Anyway, a recessed front was present in Antarctica on March 18, and such a thing enables a wind to insert itself.  It is similar to those openings in enemy formations that Alexander the Great always searched to find and penetrate.

The temperature anomaly lasted until the 21st of March.  Yes, -22F was a heat anomaly.

BTW, Antarctica has dark desert land which can allow sunlight free-rein.  But, Antarctica is 5.5 million square millions and mostly white.  Albedo prevails there.

None the less, the "apparent" ... the "seeming" ... record high temperature of March 18 was amended on a couple record-keeping data sheets.  The MINUS 11.8 degree Celsius number was changed to MINUS 17.7C in one data set, and MINUS 20C on another set.

This translates into -4 and 0 degrees Fahrenheit which doesn't look as apocalyptic as originally reported. 

Below is an illustration of the Australian wind (green colored border) inserting itself into an Antarctic front (blue) on March 18, 2022.  It arrived at a low-pressured 850 hector-pascals.  This would translate into 12.32 psi --- aka 25.1 inches of mercury, in terms of air pressure, and it was following the Coriolis Effect for a low pressure system in the Southern Hemisphere.  (Incidentally, standard surface air pressure throughout the Earth is 14.7 psi.)  

The Vostok Station got similar temperatures at the same time.  Incidentally, Vostok means "East"in Russian.  Vostok is 350 miles from Concordia.  It's close to the distance between Pittsburgh and the New Jersey border.  In mid-March 2022, they shared similar temperatures, 350 miles apart.

Speaking of Jersey, while the media endlessly harped on heat waves and decreasing water levels, the Jersey shoreline water was exceptionally chilly.  And why?  

ANS:  Because of Upwelling ... because of water rising through the Pycnocline layer of the ocean, making its way to the surface.  It brings with it rich nutrients for the ocean dwellers.  

The average temps for Jersey ocean water, for August, is around 70 - 75 degrees, and it has made it to 79F.  This August, it was found to be 58F and similar temps.

This is pertinent, in light of the Resplendy-Keeling paper of recent years, where it was claimed that the ocean is heating 60% faster than assumed.  Well, the paper had mathematical errors in it that invalidated it.   

At Jersey this Summer, that Resplendy paper was doubly invalidated, being that the upwelling water is soooooo cold.  I stated previously that the majority of ocean water is dark and 39 degrees Fahrenheit.  Well, the Jersey shoreline concurs.  It was Brrrr City there.

Jersey ocean water 12 to 18 degrees Fahrenheit colder this summer

Back to the Concordia Station

The bottom line is that co2, n2o, & methane (ch4) had NOTHING to do with the March 18, 19, 20, 21 temperature rise which still stayed mostly 30 to 35 degrees Fahrenheit under the melting point.

Moreover, Antarctic March is equivalent to Northern Hemispheric September when there are temporary returns of Summer temps.  Take note of the change of ... the adjusting of ... the amending of ... the March 18, 2022 temperature.


 ~  ~  ~

Below:  Take note of the barometer reading for March 18.  It's 28.5 Hg.  That translates into 965 millibars.  That's a category 2 hurricane pressure.  None the less, an anabatic wind is dependent upon solar irradiance, instead of pressure... so say the writers of the textbooks.  That's the opposite of a katabatic wind which is a Chinook Wind and a Foehn Wind and a down-sloping wind.

The low humidity makes things believable enough in this case.

Looks like the end of the world has been postponed.  The world needs consolation more than theatrics & hype.  Easily bored people need theatrics and hype.  Easily bored people are boring people.  So, they market hype, instead of hope.

Boring people are void of true intrigue, such as how things work in nature.  Closed minds learn nothing, especially those in brainwashing chambers (called classrooms) where they repeatedly heard, "co2", "greenhouse gases," and "the burning of fossil fuels."

~~~

The media simply wants to see people hyped-up ... as in sensationalism ... as in running wild in the streets, setting fires.  This is done in search of higher ratings.  That wild-in-the-streets pyromania has been done before.  Nothing new or intriguing there.  Try to solve some of life's mysteries, instead of ending life.  Intrigue is built into the human system.