July 24, 2025

To exaggerate is to lie, part 3. Come and view the list of megadroughts that occurred when the Atmospheric CO2 Count was much lower than it is today.

Background:   Michael Mann and David Attenborough both asserted in varying venues that, for the one thousand year period preceding the start of the Industrial Age, Planet Earth's Climate was mild.  That is a complete lie.  There was much climate turbulence & many years of drought, along with heatwaves, throughout that one-thousand year period.   Add floods to the turbulent storm inventory, also. 

Now, that period of time was when the atmospheric CO2 level was much lower than it is today.  In fact, from the Year 1000 to the Year 1825, the atmospheric CO2 level did NOT rise above 284.3 ppm. The fact that there were many natural disasters during that time-span disproves the Al Gore & Michael Mann Theory of Climate which claims that a rise in CO2 causes more natural disasters.  So, compare the Year 1000's 280 ppm to Feb 1, 2025's  426.35 ppm.   Compare

The truth is that, if you ever open an Atmospheric Science textbook, and turn to the Pressure Gradient Forcing pages, you will see that it's during cold spans of time when atmospheric turbulence increases.  This is an element of "baroclinic" instability & stability.  "Baro" means pressure.  Thus, air pressure is a pivotal co-driver of temperature and/or air turbulence and/or air direction.  

And of course, the greater the difference between the pertinent low pressure air mass and the pertinent high pressure one, the stronger the wind will be.  In addition, the involved spirals of wind will move clockwise around areas of high pressure in the Northern Hemisphere, and counter-clockwise around areas of low pressure.  

I've already addressed this elsewhere, at the Blue Marble Album.  The bottom line is that weather will be more turbulent during global cooling phases than during warm ones.  After all, the Little Ice Age had disastrous weather events, as did the years following 536 CE.  The evidence is that Al Gore failed when he predicted ... from 2006 to onward ... that hurricanes will get stronger and cause all the more damage.  There is still no such thing as a Category 6 Hurricane in the Atlantic Ocean.

Moreover, there is only 0.043% of CO2 in the outdoor sky.  99.96% of the Earth's atmosphere is Nitrogen, Oxygen, and Argon.  CO2 doesn't have the volume or size to have any effect on an entity as huge as Planet Earth's atmosphere.  CO2 affects flower after flower, tree after tree, grape vine after grape vine individually, one at a time, many times simultaneously.  CO2 brings forth gardens, orchids, and wheat fields; NOT massive natural disasters.  So, we proceed:

When you go back further in history, you will see that there was an intense British Isle drought from 1765 to 1768.  In fact, twenty prior, France had a devastating drought in 1788.  The nation would never be the same after 1789.  None the less, the CO2 level was very low at the time, at 278 ppm.  In continental Europe, there was a drought in 1718 & 1719.   The same CO2 level was there.

There were famines in the same British Isle region in the 1690s, as well as in 1622.  Before this was the 1616 Drought which affected London and southern England.  The Tudor Drought of 1540 was the epic one, as well as.

Concerning the CO2 level, in 1545, the level was 283 ppm.  Then came a constant and gradual decrease until 1615, when the CO2 level dropped to 275.5 ppm.  The CO2 level in the centuries to come would not go lower than the 1615 level, making 1615 the lowest CO2 year in the past 410 years.  Yet, in the following year ... in 1616 ... there was a drought which made history.   Thus, a low CO2 level does NOT protect you from natural disaster.

The Elbe River Hunger Stones have markings for each of the drought years of the Czech & German terrain dating from 1417 to 1893.  The Elbe River hunger stone markings are in Děčín, a Czech town closer to the German town of Dresden than to the Czech town of Prague.  

The years of drought are marked as 1417 (faintly), 1616, 1707, 1746, 1790, 1800, 1811, 1830, 1842, 1868, and 1893. None of it is "proxy evidence," as are tree rings and cave walls water marks.  It's all witness testimony.     However, a person or a crew can investigate the years mention, and search for proof or disproof of the hunger stones' validity.  Incidentally, the Year 1616 definitely passes the test.  As far as goes 1790, there was a drought in India, called "the Great 1790 to 1794 El Nino."  Moreover, in 1791 a number of droughts developed in different parts of the world, including New South Wales, in Australia.

In fact, tree-ring reconstructions show that, in 874 CE, Western & Central Europe endured hideous drought conditions ... all when the CO2 level was really really low.  Observe:

                                Above:  Posted pursuant to 17 USC 107, the Fair Use Act.   

In each instance, the outdoor CO2 level was very low ... too low to have caused the droughts.    More precisely, from the Year 1000 to the Year 1814, the outdoor CO2 level did NOT exceed 275 to 284 ppm, with the majority of time pinpointed at 280 ppm.  

It wasn't until 1851 when Planet Earth reached a CO2 level of 285 ppm.   It was not until 1912 when CO2 reached the 300 ppm.  As for the 330 ppm mark, that occurred in 1975.  The 350 mark was reached in 1989, and the 400 ppm mark occurred in 2015.

Moreover, when Joe Biden took office in January of 2021, the CO2 level was 415.51 ppm.  When he left office, on January 20 of 2025, the CO2 level was 426.74 ppm.  The Biden-Harris presidency was supposed to be the presidency that was going to significantly reduce atmospheric CO2.  Rather, Biden & Harris did what it took to get the atmospheric CO2 level to skyrocket, proving that particular administration to have been the most incompetent administration in the history of the United States.  

Under four years of Biden & Harris, the CO2 level rose 11.23 ppm.

Donald Trump began his 2nd term on January 20, 2025.  After Trump was in office for merely 15 days, the atmospheric CO2 level decreased 0.46 ppm ... for whatever reason, even if only luck.  See for yourself:


Climate activists claim that 300 to 330 ppm of CO2 is the "safe zone."  So, anything from the beginning of civilization to 1912 (300ppm) or 1976 (329ppm) ... and maybe only up to 1949 (310ppm) ... were fine and acceptable times to these activists.  Well, here's a newsflash:

A human is fine when CO2 is at 1,300 ppm, 1,600 ppm, and even 1,900 ppm.

Droughts of Centuries Past

Previous to those droughts was an American megadrought in the 16th Century.   This occurred before the dawn of the Industrial Revolution.   Read all about it:

🌐🌐🌐🌐🌐🌐🌐🌐🌐🌐🌐🌐🌐🌐🌐🌐🌐🌐🌐🌐🌐


🌐🌐🌐🌐🌐🌐🌐🌐🌐🌐🌐🌐🌐🌐🌐🌐🌐🌐🌐🌐🌐

Moreover, modern science recognizes that megadroughts in the American Southwest existed for a span of time comprising the 9th to the 16th Centuries.   In this case, "IT" all definitely happened before, long before the start of the Industrial Revolution ... long before the atmospheric rise in CO2.

📖📖📖📖📖📖📖📖📖📖📖📖📖📖📖📖📖📖


📖📖📖📖📖📖📖📖📖📖📖📖📖📖📖📖📖📖

Add the Tudor drought of 1540 to the list, along with the Drought of 1360-to-1362 and the Drought of 1302-to-1304.  

🌅🌅🌅🌅🌅🌅🌅🌅🌅🌅🌅🌅🌅🌅🌅🌅🌅🌅🌅🌅


☆☆☆☆☆☆☆☆☆☆☆☆☆☆☆☆☆☆☆☆☆☆☆☆☆☆☆☆☆☆☆☆☆☆


🌅🌅🌅🌅🌅🌅🌅🌅🌅🌅🌅🌅🌅🌅🌅🌅🌅🌅🌅🌅


      💠💠💠💠💠💠💠💠💠💠💠💠💠💠💠💠💠💠💠💠💠💠💠💠💠💠

This includes the American droughts which occurred from 990 to 1060 CE ... 1135 to 1170 CE ... and from 1276 to 1297 CE.  So, when it comes to heatwaves and droughts, as well turbulent storms and floods,  it has all been done before.  There has been nothing new in the 2020s ... or even in the 2010s ... that hasn't happened decades and centuries ago, concerning weather events and weather history.


      💠💠💠💠💠💠💠💠💠💠💠💠💠💠💠💠💠💠💠💠💠💠💠💠💠💠
      
Below is a product of the United States government's National Integrated Drought Information  System which was authorized by Congress in 2006 (Public Law 109-430).  It's an official agency. 


                       Above:  According to the United States government, Michael Mann is a liar.
                       There were many megadroughts during the thousand year period Mann claimed 
                       to have been a millennium of mild weather.  David Attenborough told the same lie. 

This crying-of-wolf has been ongoing since the June 1988 Senate subcommittee hearing predictions of  Jim Hansen.  All of his 1988 predictions failed, after thirty years patiently waiting.  It's now 6 years beyond 2018, and the Maldives are not underwater.  In fact, the Maldives presently have 18 airports.  Five of them are international airports.   In addition, the Arctic Ocean has not come close to being ice-free, during any summer after Hansen's 1988 Senate Hearing testimony.


In 1967, Paul Ehrlich predicted a long-term famine would start in 1975.  In fact, he predicted that Americans were going to be subject to water rationing, by 1974.  He predicted a list of doom.

There were many other doomful predictions that were made a few decades ago by other modern scientists which never came true, either.  After all, England did not become another Siberia.  

Motivation:  Money.  It's that simple.

Concerning the present activists, politicians, and scientists who constantly say that we're in a Climate Crisis, the goal of these people is either taxpayer funded Congressional appropriations or NGO donations.  Moreover, creating a crisis in the mind of the voters ... and then promising to combat that crisis ... can get you re-elected.  To think, politicians use outrageously high sums of taxpayer dollars to get re-elected by the taxpayers they are robbing.  Go figure.

And of course, a person or group of persons acquires large sums of grant money through successful propaganda.  Therefore, these activists and scientists need to have it set in stone that the World is coming to an end at the end of the decade, because you and the rest of mankind drive cars, cook dinner on a gas range, use gas water heaters, operate mixed-fuel weed whackers,  and exhale CO2 within every half-minute.   Some people even herd cattle which is now declared a Climate Sin. 

That which has been repeatedly mentioned ... as if to be reading from a teleprompter .... is your carbon footprint.  HOWEVER, Nitrogen, Oxygen, and Argon occupy exactly 99.96% of the atmosphere outdoors.  Yet, it's the three-atom molecule which happens to take-up less than 1/10th of 1/2 of 1% of the sky ... and which comprises merely one carbon atom ... which is going to heat up the planet to the point of extinction.   CO2 is 1/2,347th of the Troposphere.  That is to say, for every 2,347 molecules in the sky outside, only one of them is CO2.  That's 0.042%.

In addition, the rise in the level of radiative forcing in a three-atom molecule is NOT endless, especially when considering that CO2 is incapable of capturing any infrared heat when it's in the vibrational mode known as the "Symmetric Stretch Mode."  Well, technically speaking, it will absorb a half a watt per meter squared, in the symmetric stretch mode.

The Actual Scorecard on 2023, in review

Now,  Europe had notable tragedy, in 2023.  But, it wasn't the first time ... or the second time ... or even the third time.  There were 47,690 estimated heat-related deaths in Europe, in 2023.  And once again, there were 70,000 in 2003.  In fact, in 1911 there were 41,000 European deaths, due to a 70-day heatwave there.  In addition, 1921 was the Year of the Grimmest of Reapers.  It was followed by the Arctic Ice Melt Year of 1922.  

Even 1980 saw Dallas Texas endure 42 consecutive days of 100F+ temperature highs.  Heatwaves are & have been a part of Planet Earth's history, per se.  It's more important to safeguard against fine particulate matter such as PM2.5 in the surface area of the Troposphere than life-giving CO2.  That's Particulate Matter smaller than 2.5 microns.  Al Gore and Michael Mann choose the wrong enemy.  

PM2.5 has been known to contribute to death, according to coroners' reports.  CO2 has been the Don Quixote Windmill that the media, the activists, and the politicians have been chasing.  Crying wolf is how these people have been making their money.

Heatwave-related deaths also involves mismanagement ... as in ill city-planning.  Such deaths also involve air pollution adding to the burden of people.  The predominate pollution in this case would be particulates, as in PM2.5.  Those are low-weight & very fine particulates.  The heavier particulates fall to the ground ... or rooftops ... faster.  They quickly bypass human respiratory systems ... and those of other mammals.

America was alleged to have had 2,300 heat deaths in 2023.   And NYC had its share of heat-related deaths in several intermittent summers before 2023.  The Year 2023, therefore, was a lot like 2003 and 1976.  The Summer of 1901 was a bit more brutal.  The Summer of 1921 was far too brutal.  Plus, 1934-to-1936 was the definition of heatwave & drought brutality.

Claiming 2023 to have been the worst year in the past 2,000 years is a sale pitch for more taxpayer-funded Congressional spending.  It's an attempt to finally convince people that the mere 0.042% of CO2 in the sky outside drives the Planet Earth into a fiery doom.

There is a lot to add to the list of heatwaves and/or droughts, as well as raging storms of varying sort, ranging from Continental Europe to the Mediterranean to Southern Asia to Eastern Asia to Northern America to Southwestern desert America to Rocky Mountain America to Arabia to the Pacific Islands to Australia and to New Zealand.   Natural disasters are a part of the human timeline.

The great lie was in Michael Mann and David Attenborough claiming that the weather of Planet Earth was "mild" for a thousand years, until the start of the Industrial Revolution.  The blatant truth is that drought, plagues, pestilence, crop failures, famine, heatwaves, windstorms, sea storms, dust storms, cold spells, blizzards, ice-stacking, glacier melt, glacier growth, and floods appear all throughout the timeline of human history.  Eventually came the witnessing of tornadoes, later in human history.

Concerning Europe, how much of a contributor to its heatwave disasters were the Sirocco Winds of Africa and/or the Foehn Winds of the Alpine regions?  Such a thing would involve something known as Adiabatic Heating, concerning the Foehn Winds.  

Concerning the Sirocco Winds, they involve something known as Hadley Cell Convection which is stationed over the 30th Parallel of both hemispheres.  That is where heavy, high-pressured, and dry air descends to the Surface of the Earth.  

That air came from the Equator, after low-pressured & moist air rose toward the ceiling the Troposphere.  The Equatorial air reaches the Tropopause as dried-out air, and then it moves north and south, until it reaches the 30th parallel of both hemispheres.  It then descends to the surface of the Earth.  Actually, the air literally sinks.  All of the major deserts on Earth are located at 30 degrees parallel ... both in the northern and southern hemispheres.  

Other notable deserts are east or southeast of the "leeward side" of mountain ranges.  In those ranges, white clouds never pass over the mountain tops.  They stay on one side of their mountain range.  This was very typical of my mother's hometown in Wyoming.  In the center of Wyoming is the Red Desert.  Oregon has a desert, too.  Desert terrain is a part of the American West and has been that way long before Al Gore and Michael Mann were even born.

It's frustratingly amazing how the modern media operates 24/7, yet it has no time to teach people these types of things.  Adiabatic Heating is something very well understood in science, and it has nothing to do with CO2.  It deals with things called "orographic lifting" and air compression.   

Hadley Cell Convention is well established.  The Ruler of both Hadley Cells is gravity.  The teachings on the Earth's convection cells are very well done on internet websites.  I even wrote about them.   Learning about convection cells at any site will do you well.  

There is one warning note here.  The Earth should be presented at a 23.5 degree tilt.  However, the typical Convection Cell model of Planet Earth has no tilt in its illustrations.  In real life, there's a tilt.

Climate activists, the media, politicians, and scientists were doing little more than crying wolf and taking outrageously large sums of taxpayer indebted dollars in the process ... with the politicians getting themselves re-elected, as the US National Debt sky-rocketed into levels of insanity previously unimagined.
========

For the readers' convenience, the links to parts 1 & 2 are located here:

Part 1, the heatwave newspaper reports dating back to 1878, 1896, 1901, 1911, etc:


Part 2, the relatively recent temperature charts of July 2023, to show that there were
many places in the Northern Hemisphere that were not temperature infernos:

July 23, 2025

The Great South American Heatwave Hoax of 2023

It was a super big media alarm.  The End of the World was coming.  Oh my!  An untold, unprecedented, unparalleled, unimaginable, unquenchable, and unbearable heatwave was menacing South America, during its Winter of 2023.  The central focal point of time was August 1st of that year.  

Santiago was reported as being a place of oppressive & "sweltering heat," all the while creating plumes of deadly smog over the city ... even though smog is simply ground-level ozone and is NOT formed the way in which journalists uneducated in atmospheric science claim.  

None the less, also put on display was Vicuna, Coquimbe (in Chile).  It was reported to have reached 99F there, on August 1st, 2023, in the middle of the Southern Hemispheric winter ... NOT.   It was only 63 degrees Fahrenheit there, on that day, pursuant to professional meteorological record-keepers.  The mainstream TV & Print media outright lied.  

Predictably enough, this trend of FALSE weather reports occurred under the Biden Administration.  The goal was to deceive the world into believing the Year 2023 was the hottest year ever.  This would then allow the Biden Administration and the UN to possess dictatorial powers upon the West.  

 The  Fraudulence of CNN

It was then mentioned by none other than the less-than-honest CNN that 100F+ temperature readings were occurring throughout South America in early August of 2024.  However, the meteorological companies  such as Accuweather & the Weather Channel tell a much more tame story.

Immediately below is part of a CNN article, also posted pursuant to the US Fair Use Act.  It's a report on the August temperatures in Chile.  Take note that it states:  "dozens of stations are recording their highest ever temperatures in the first half of August."  The mention of 100F temperature readings is included in that wintertime news article.  

Okay then.  Where is the list of the weather stations involved?  Where are the official stats, data, charts, calendars, graphs, reports, briefings?  Where's the evidence of this global boiling winter?  Were people being hospitalized by the tens of thousand in those areas?  Were people dying by the thousand there? 

People were dying by the thousand in Paris France, in the Summer of 1911.  Paris in 1976 and 2003 were tragic summers, also.  So, if South America in the Winter of 2023 was not like Paris in 1911, then the recent news reports were a collective fraud via sensationalistic hyper-exaggeration ... done by media employees who needed to be fired immediately.

Below is actually one of many Doomsday passages in the CNN Book of the Apocalypse.  This is countered by over 31 pieces of evidentiary support, all posted here.  Let us begin.  Shall we?

                              *************************************************
This makes it sound as if South America ... between the 30th and 35th Parallels ... has become an apocalyptic inferno that demands an immediate environmental response by which all humans are to surrender all of their rights and then do whatever they are told to do.  Santiago is on the 33rd Parallel.  In North America, the 33rd Parallel passes through the middle of Arizona, New Mexico, Alabama, Mississippi, Georgia, and South Carolina.   That's warm weather land. Thus, expect no Arctic temperatures in the Southern Hemisophere's 33rd parallel degree, either..

Moreover, the Tropics are located at 23 degrees ... north and south.  And of course, the Tropic of Capricorn travels through northern South America, meaning that the temperatures will also be at least warm ... even in wintertime.  Even concerning the Tropics, there is no concept of "warm season/cold season" there.  There is Dry Season and Wet Season, instead.

All in all, if August temps are between 55F and 75F in the vicinities ranging from Santiago to Vicuna, then you have no end-of-the-world scenario.  You have average --- the mean --- the median -- the mode.  You have   You only have con artist journalists who need to have their FCC licensing revoked from their establishment.  

Such an entity also needs to be served with a major class action lawsuit, for the Intentional Infliction of Emotional Distress, especially upon the school students told horrors about the weather which has been nothing more than a repeat of the 1930s, 1920s, 1890s, and 1870s.  After all, history repeats itself and climate is CYCLICAL. 

CNN did NOT pass the Carl Sagan Test

Now remember, "extraordinary claims require extraordinary evidence." (Carl Sagan)  In as much, where is the picture of the thermometer which recorded a 99F or a 100+ degree reading in Wintertime Chile? Where are all the certifications of all of these "hottest day ever" assertions? 

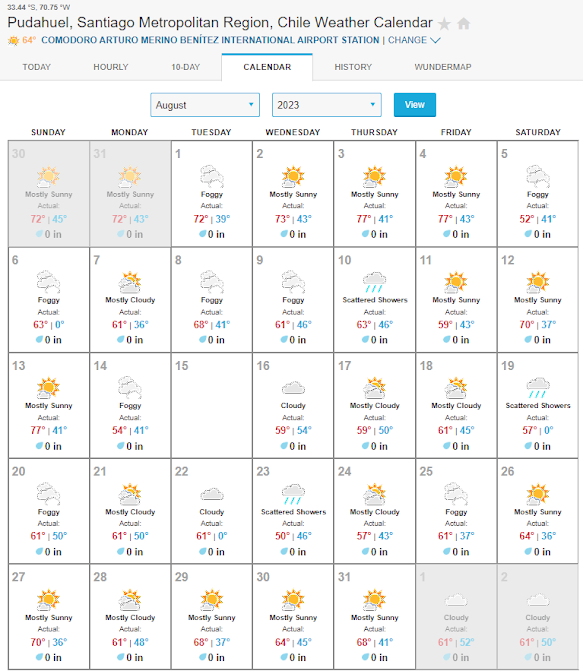
Concerning Santiago's "smog" and "sweltering heat," it was officially reported by meteorological professionals that Santiago was "foggy" ... and NOT smoggy ... on August 1st --- with a 72F to 74F high temperature and a 39F low.  Someone lied once again to humanity, in an intentional act to create emotional distress and to maybe get some of that US Congressional funding sent their way.

Immediately below are three reports of Santiago, for August 2023, posted pursuant to the Fair Use Act.  One of from the world famous Weather Channel.  Another is from the equally known Accuweather.  The third one is the reading at the international airport in Santiago.  No 100F heat there, folks.  No 90F heat there, either.  No 82F, 84F, or 86F heat there, as well, concerning August of 2023.  The only brutal heat in Santiago was the heat coming out of the engines of the passenger jets there.

Take note as to how low the nighttime temps were in the general and even specific vicinities of Vicuna and Santiago.  They were sometimes near the freezing mark.


*   *   *   *   *   *   *   *   
Below:  Now for JULY.  Specifically, Santiago in July of 2023, pursuant to the Weather Channel.  CNN said it was blazing hot there, in July & August of 2024.  CNN lied.   There were NO 90F days there; NO 80+ Fahrenheit days, either.  Moderate temps only.  CNN needs to have its FCC licensing REVOKED.
BELOW:  Now for Accuweather's report on Santiago, for July 2023.  CNN lied with such audacity that it's FCC licensing should have been revoked.  However, the corrupt are in power at present, and the corrupt always keep the equally corrupt in power.
★☆★☆★☆★☆★☆★☆
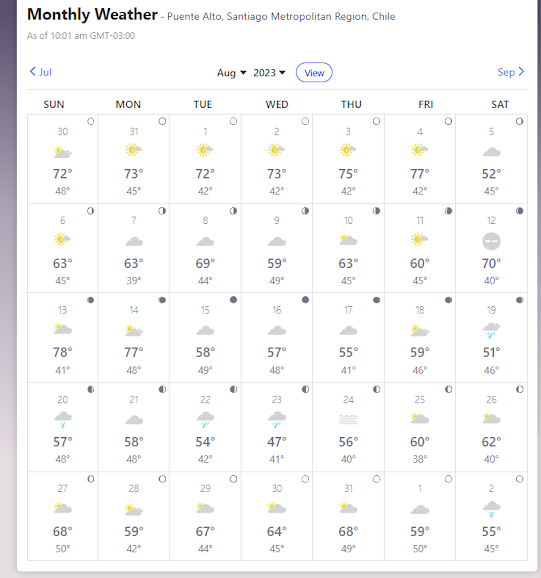
A town near Santiago would have close to the same temperature as did Santiago.  Thus, the nearby town of Puento Alto could confirm if any placee near Santiago was brutally hot.  It wasn't.  Puento Alto reported 72F as the high temperature on August 1st.
Below:  Another two Puente Alto weather reports for the months of July and August 2023.  These are two products of the world renown Weather Channel.  According to this report, it was 73F or 74F in Puente Alto, on Tuesday, August 1st, 2023.  That's NOT sweltering heat.

We begin with the August 2023 calendar, so that you can see immediately that August 1st near Santiago was only in the low 70s Fahrenheit.  This is more evidence that the media reporters lie and lie and lie again.
Below here:  Take note how mild the July temperatures were, also!!!  You need to come to terms with the reality that the modern media lies.  Proof is that it never allows climate debates.  Media info is rigged info.
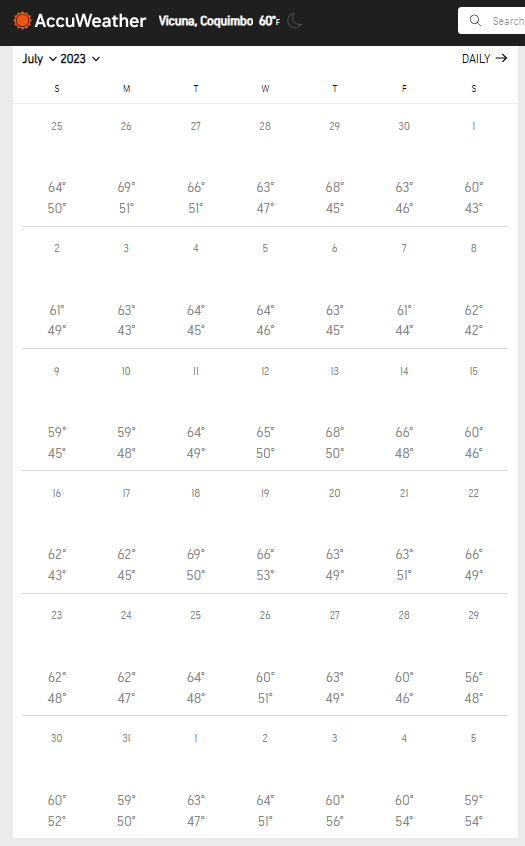
We next go to Vicuna ... in Chile, below here.  Now, the commercial media reported it as having been 99F there, in the middle of wintertime, on Aug 1st, 2023.  The reality is that both the world renown Weather Channel and the equally known Accuweather Corporation reported Vicuna as having had a temperature no higher than 63 degrees Fahrenheit, on August 1, 2023.   This is more proof  that the mainstream media lies to humanity on ... apparently ... a regular basis.

When it comes to discerning the truth about the claim of Vicuna Coquimbo's high temperature as of August 1, 2023, the tale of the tape will be found in [1] the temperatures of the towns surrounding Vicuna, [2] and in the temperatures of the days leading to August 1st, 2023.

BELOW:  Accuweather's official record from June25th, 2023 to August 5th, 2023.  On July 29th, it was 56F there.  That's moderately chilly, for those of you who are used to the metric system.  None the less, on July 30th, it was 60F there.  On July 31st, it was 59F.  This is the weather that compels a person to wear a windbreaker.  In the Fahrenheit System.  80F is quite warm.  86F is hot.  95 is quite hot.  And 110F is the desert.  

All in all, according to the most famous weather networks, CNN lied about South America, in August of 2023.  There are a whole list of "climate lies" that have been told, ever since Al Gore received an award for a movie which is an insult to the intelligence of anyone who studied Atmospheric Physics.  That movie is a chump change joke of zero educational value.

Below is the weather report for August 1st (2023), only.  The report was that Vicuna was only 24C.  Now, 24C = 75F.  That's 24F lower than what the media reported.  In fact, the Weather Channel & Accuweather reports were 36F lower than what the media reported. 

Below:  Towns relatively close to Vicuna

If Vicuna were 99F on August 1st, then nearby towns would have been unusually hot, also.  Let's start with PAIGUANO, 11.8 miles away from Vicuna,.  Surely two cities less than 12 miles apart from each other would have the same weather and temperatures.  Well, according to well-known Accuweather, on the day when the media reported Vicuna as having reached 99 degrees Fahrenheit, Paiguano's high for that same day was only 63 degrees Fahrenheit (17.2C).  In fact, throughout the entire month of July ... and throughout the first five days of August 2023, the temperature at Paiguano did NOT exceed 69F (20.5C) ... according to the same Accuweather meteorological service.  That is a 42-day period.  Where is this 100F heat that CNN said was out there?

Below is what worldweatheronline reported about Paiguano, for Tuesday August 01, 2023.  And it is the same Paiguano which is situated in the Region of Coquimbo, Chile, 12 miles away from Vicuna.
24C = 75F.  That's NOT a heatwave temperature.
One more temperature record of neighboring Paiguano is below.  This one is by the Weather Channel.  Where is all of the End-of-the-World heat that the mainstream media reported?  According to the world famous Weather Channel, nearby Paiguano was only 63 degrees Fahrenheit, and not anywhere near 99F.  Do you yet see how much and how badly today's mainstream media lies?  Do you see how some TV networks need to have their FCC licensing revoked?
Below:  Let's go next to Ovalle which happens to be 49 miles away from Vicuna.  Therefore, if there were a widespread heatwave, Ovalle could have reflected this.  However, it did not do so.  Ovalle was NOT reported as having had any 90+ Fahrenheit day in July or in early August 2023, by any weather website.  In fact, it didn't even register an 80F day, between June 25 to August 5, 2023.  The Weather Channel reported Ovalle as having had a 71F high temp on Aug 1, 2023.
Keep in mind that this is the July 2023 report.  This means that the report for Tuesday, August 1 high temp is in the bottom row here.  The first five days of August are reported in that row.
Next comes Accuweather's report on Ovalle, for the First of August, 2023.  63F on August 1st.  Now, Ovalle may get visited by true heatwave temperatures next week, but it didn't get visited by searing heat in late July or in early August.  The August 1 high temp report is at the bottom row of this calendar, along with the first five days of August.  This is because the calendar below is the one for July 2023.  It's here, instead of the August 2023 calendar, so that you can see that there was no "global boiling" transacting in Ovalle, during July, leading up to August 1st.  As you can see, there was no 100F days there, in July of 2023.  

Below:  Another town near Vicuna is Pisco Elqui.  It's 24 miles from Vicuna.  So, if Vicuna had blazing heat, then so too would have nearby Pisco Elqui.  Well, on August 1st, 2023, Pisco Elqui was said to have been only 63F according to the world famous Weather Channel & Accuweather corporation.   So, where's all the End-of-the-World heat?  
Below: Accuweather reported the exact same temperature for Pisco Elqui as did the Weather Channel.  No 100F temps there, and no debate here.   Only lies from CNN and similar intruders upon the modern mind exist.
Below:  Next is Andacollo Coquimbe.  It's approximately 26 miles from Vicuna.  The Weather Channel claimed that the August 1, 2023 high temperature there was only 63 degrees Fahrenheit.  That amounts to 36 degrees LESS THAN the 99F reported by the mainstream media as having occurred at nearby Vicuna.  
Below: Accuweather concurred with the Weather Channel ... or visa-vera.  Andacolla's high for August 1st, 2023 was only 63F.  Both mainstream weather services agreed that there was no 80+F day and no 90+F day in Andacollo, from late June to Early August.  
Below:  Also near Vicuna is La Serena, 35-40 miles away.  Now, if you have 99F in one town, then you will have nearly as hot a temperature 40 miles away.  The La Serena temp for Aug 1st was 63F, according to the Weather Channel.  That's 36 degrees Fahrenheit lower than what was reported by the mainstream media, for Vicuna.  This is yet another confirmation that the media of today is operated by liars who need to be fired at once.
Below is another weather chart report on the same La Serena, also in calendar form.  It concurs with the chart above.  Both weather agencies claim that it was 63F in La Serena on the day when nearby Vicuna was supposed to have been 99F.
As was previously stated, the extremely famous Carl Sagan designated the measuring rule to be thus:  "Extraordinary claims require extraordinary evidence."  And of course, CNN and the other climate hysteria networks showed zero evidence to support their over-the-top claims.  Concerning CNN mentioning the creation of smog in Santiago, the professional meteorologists mentioned Santiago having --- NOT smog.  

Now, the greatest smog disaster ever ... which occurred in Donora Pennsylvania, in 1948 ... occurred due to a thermal inversion in late OCTOBER, when chilly autumn weather was present.  In a thermal inversion, the cold temps are at the surface, and the warmer temps are above the cooler temps.  To attribute a cloud of hovering smog to a heated day shows that the writer knows nothing about basic atmospheric science, even though he/she presents himself/herself as an expert with a degree of knowledge above and beyond "the little people."

"Smog" is a phrase that was originally used to describe the combination of fog & smoke during the days of heavy European coal use.  Heat does NOT cause smog.  Photochemical reactions do, and nitrogen oxides are ingredients involved.  Classical Smog is basically ground-level ozone (surface-level ozone) that needs cooler temps.  Furthermore, when it comes to photochemical smog, sunlight is required for that type of smog to materialize.  More weather reports on Santiago are posed here, in addition to the ones above,  just to prove that CNN is nothing more than a corporation of liars. who need to be put out of business.  This can be done by boycotiing every product advertised on CNN.

Note: 24C = 75F ... 18C = 64F ... 12C = 53F.

Above:  According the this weather agency, it was only 72F on Tuesday, August 1st, 2023.  This proves CNN to have been a liar, in claiming that Santiago was going through never-before-seen "sweltering heat." 

Below confirms CNN's dishonesty, too.  It was 72F in Santiago on August 1st.  No "sweltering heat" was there, contrary to what the liars at CNN stated.  And of course, CNN needs to fire every liar.

Now, for Buenos Aires

The mainstream media specifically mentioned how Buenos Aires got caught in the alleged South American heatwave of 2023 with a heat wave of untold proportions, as well as it reaching into Uruguay in general.  

Okay then, for my first trick, ladies & gentlemen of the jury, I will show you a professional temperature report of none other than hot hot Buenos Aires!!!  Needless to say, it's posted pursuant to the Fair Use Act.  Look for yourself and see ... See how full of crap the modern media and climate activists are.  In thirty-six days out of forty-two days there, there were only high temperatures in the 50s & 60s Fahrenheit.  This is not any kind of climate crisis for that region at any time.

Below is another professional monthly temperature report about hot hot Buenos Aires, dating from June 26 to Aug 5, 2023.  This one is from the world renown Weather Channel.  Look for yourself.  How many hot were there, in August of 2023?
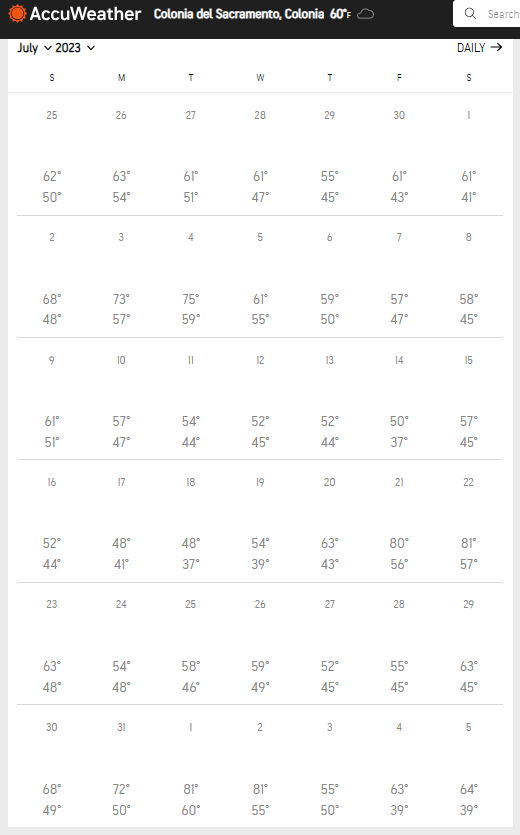
Below:  The city across the river from Buenos Aires.  If Buenos Aires were as hot as the media claimed, then the city across the Rio de la Plata would be as hot.  That city is Colonia del Sacramento, in Uruguay.  In a 42 day period, ranging from June 25 to August 6, 2023, the city across from "hot hot" Buenos Aires had a high in the 50s for 20 of those days, along with a high in the 60s on 15 of those days.  Zero days were in the 80s or 90s.  So, where is this heatwave the media obsessively reported?
Below: Colonia del Sacramento, Uruguay once again, for confirmational & concurrence purposes.
Above:  In a 42 day period, 17 days had highs in the 50s, 15 days had  highs in the 60s, and even 2 days had highs in the 40s ... Fahrenheit, of course.
Below: Uruguay most definitely was mentioned in the commercial news reports as having been hit with massive heat this past Winter.  Let's next present the July/Aug temps of the largest city there.  That is Montevideo.  Below are the temps there, as of late June to early August 2023.   It shows the South American heatwave report to have been more dishonest than the 2009 Climategate emails.   Half of the highs were in the 50s Fahrenheit in Montevideo, and almost a third were in the 60s there.  See for yourself, below:
Below is another professional temperature calendar of Montevideo Uruguay, between late June and early August 2023.  In as much, where is this highest-temperature-ever South American heatwave?  

BTW, cities near the Tropics do NOT count, in claiming "global boiling" heat.  This is because the Tropics are the hottest places on Earth, next to valleys at the base of the leeward side of mountain ranges ... and the African Sahara.  Thus, high temps are usual for the Tropics.  Heatwaves involve heat anomalies.
Let's now go toward the center of Uruguay, to Durazno.  Keep in mind that the media claimed that even Uruguay was getting pounded with heat in July and August of 2023.  Between June 25th and August 5th, Durazno had four days with highs in the 40s, 18 days with highs in the 50s,  and 11 days with highs in the 60s ... Fahrenheit.  No 99F days.  No 89F days.  No 79F days.  That's not a climate crisis.  That's NOT Global Boiling.  Look for yourself:
Now, there was a place in central Argentina which did have an unexpected heatwave of note.  That, alone, would have been enough subject matter for the climate hysteria people to have reported.  But apparently, the climate folk had to "pour it on" and expand the perimeters of the heatwave, in order to scare you into submission.  This was apparently done, so that they will get a handsome share of that multi-billion dollar US congressional "climate funding."  

In order to get a large amount of taxpayer-indebted money from the US Congress, you have to deceive people into thinking that the world is coming to an end and it needs you to save it.  Keeping people stupid and easily deceived is absolutely necessary for you.   CNN works hard to accomplish the task of keeping modern humanity completely stupid and utterly mindless.

None the less, any true heat during July & Aug 2023 can all be attributed to El Nino, and NOT to the burning of fossil fuels.  As I illustrated in a previous post, El Nino can also be attributed as the cause of the lack of high velocity Atlantic Hurricanes.  El Nino brings wind shear power to the Atlantic.  And of course, Hurricane Lee was a prime example of El Nino taming a hurricane.  

In as much, climate is extremely intricate.  It's not the simpleton version presented by Al Gore to the English-speaking world in 2006.  That movie was an insult to one's intelligence.  The way of the climate activist is the way of hyper-exaggerating everything so much so that it becomes a ridiculous lie.  The climate activists blow everything out of proportion.  

Now, 2023 did have a "heat anomaly summer" attached to it.  In fact, 2023 had three heat anomaly months in a row.  But, it was not more severe than were the heatwave years of ~2012, ~tragic 2003, ~1988-90, ~1980, when Dallas had 42 consecutive days of 100+ Fahrenheit heat, ~tragic 1976, ~the Hurricane Hazel year of 1954, ~searing hot 1934-36, ~the Arctic ice melting years of 1921-22, ~the undertaker overtime year of 1911, ~the grape vine withering year of 1901, etc.   

And let us not forgot the heat of 1895-96, when the co2 count was quite low, proving that a rise in co2 is NOT the cause of heatwaves. Additional proof that 2023 was not as bad as the other heatwave years of the past 140 years consists in the fact that you ... your friends ... your family ... your acquaintances ... are still alive.  

Plus, 2023 ever-so-coincidentally fits the 11 Year Sunspot Cycle Theory which is still only in "theory status."  And concerning this, the high heat does NOT come in tandum with high sunspot activity.  Yet, there is a reasonable pattern of note ... with the high temperature years which are subject to the direction of the Equatorial ocean current; if weather it is travelling Eastward or Westward, as in "El Nino" v "La Nina."  

Yes, temps are subject to the existence of the Sun.  But, the determining factor of temps throughout the Earth is dependent upon the directional flows of the nearest ocean areas.  Ocean current directions explains why Ireland basically gets moderate/mild winter and why Southern sectors of Greenland remain ice-free all year round.

Then comes the matter of upwelling and down-welling.  The east-west direction of ocean water is not all that matters.  The upward & downward directions of ocean water is a determining factor, too.

In review, 2023 was very close to the heatwave year of 2012, eleven years prior ... as in "Eleven Year Cycle."  In addition, 2023 also had record cold in the first half of the year, as well as seemingly miraculous water replenishment and snowpack accumulation in the American West.  It was a fraud to claim that the American West was undergoing a continued drought in 2023.  Moreover, the American West has Monsoon Season.

The "Iceless Arctic" Prediction ... that goes back to 1988 ... and gets recycled continuously

In review, if the Summer of 2023 were the hottest year in the last 125,000 ... or even 7.5 milllion years ... the Arctic Ocean would have been ice-free at the time of this writing.  

BELOW:   National Snow & Ice Data Ctr / NASA Earth Observatory, as of Aug 11, 2023.

For those of you who are products of the American Public School System, look below and know that you are looking at an official visual report of "a Hell of a lot of ice."  Yet, this year has the twelfth lowest amount of sea ice on top of the Arctic Ocean, since the satellite era began.  This means that ALL late summer sea ice extent volumes were large.  The lowest amount of Arctic ice cover ... in 2012 ... was an area of ice which had a perimeter equal to flying from NYC to Minneapolis to Houston to Miami, and back to New York City.  It was also the size of the subcontinent known as India.  That is a large chunk of ice, even though it was the smallest chuck in recorded history..

Most importantly is that fact that, even if all of the ice on the Arctic Ocean would suddenly turn into water, the sea level rise would be zero . . . just like when the ice cubes in your iced tea completely melt.  No water rises over the top of your glass.

 
Above:  The Arctic as of August 11, 2023.  Now, the daily July average ...  (actually, the 1981-2010 median) ... of Arctic Ocean ice-melt is 27,000 to 33,606 square miles.  The daily Arctic ice loss for July 2023 was 36,000 square miles.  Now, that's not the End of the World.  Yet, [1] politicians seeking to bring money into their districts, [2] grant-seeking scientists, [3] audible activists, and [4] media personnel hyper-exaggerated this recent 6-months-of-daylight in the Arctic, making it sound like the End of the World.  

In review:  At the end of August 2023, the Arctic Sea Ice Extent was 2.15 million square miles.  That's 19 Arizonas ... or 28 South Dakotas ... or 41 Louisianas ... or even 172 Marylands, when laid side by side, like jigsaw puzzle pieces.       
It's no longer a matter of proving the Michael Manns & Al Gores of the era to be wrong.  It's a matter of procuring False Claims Act filings in federal civil actions, as well as grand larceny theft-by-deception indictments in federal criminal actions.  These people have been inciting violence which is now evidenced by the recent "blessings given" by a climate activist to any of today's youths who will commit terrorism in the name of the climate agenda which basically comprises shutting down society . . . shutting down humanity.

And of course, keep in mind that Al Gore NEVER won a Nobel Prize in Physics (science.)  Only the Peace Prize.  Meanwhile, the Nobel Prize that Michael Mann claims to have co-won was also NOT the Nobel Prize in Physics (science.)  And Mann is not a nice Mann.  Peace is not his most viable asset.  Disturbing others tremendously is.  

Michael Mann should win the Anti-Peace Prize.  After all, he is inciting congressional financial irresponsibility and he is inciting violence.  He tries to make people feel desperate and to believe that co2 is actually going to make the world come to an end.  Well, co2 below 150 ppm will result in the extinction of all species ... starting with plant-life.  

At present, according to Hawaii, we are at the 420 ppm range.  The Ordovician Ice Age, by the way, occuring when the co2 level was 4,000 ppm ... over nine times higher than today.  And the explosion of life throughout the oceans of the Earth occurred during the Cambrian Period, when the atmospheric co2 count was 7,000 ppm.  So, there was 7,000 v. 4,000 v. 420.  

The opposite of what Al Gore and the Doomsday Sayers claimed about the effects of high co2 occurred.  They predicted the disintergration of shell fish.  Well, shell fish flourished during the time of the highest count of atmospheric co2 in Planet Earth's atmosphere.  Plus, an ice age occurred during a time when the co2 count was NINE times higher than today.  You have been taught easily provable falsehoods.


Plus, it would only be proper to revoke from CNN its FCC license, for lying as a matter of habit.  After all, its newscasts are propaganda pieces.  They are infomercials.  Those "reports" are basically "in kind" donations to certain candidates of a certain political party.  After all, they are free campaign ads, telling everyone how evil the political opponents are, while stating how just and moral are the politicians benefitting by CNN's completely bogus propaganda pieces.

Procuring the highest extent of punishment allowed by civilized society upon climate con artists engulfed in a racket is needed.  These con artists have gone beyond the Sound Barriers of Obscenity.  They will be coming for your tax money ... your natural gas stove and your natural gas furnace ... and let us not forgot your grocery merchandise in your refrigerator.

July 22, 2025

Come and see how hot it was NOT, during the "highest average global temperature day" ... as is seen in 37 weather archive tables & graphs.

 Let's review one of the many intelligence-insulting LIES of the Biden-Harris Years.  It was also one in a long string of politician con games, not unlike the <> Iraqi Weapons of Mass Destruction Hoax <> the Russia Collusion Hoax <> The Gulf of Tonkin Speculation which resulted in the Gulf of Tonkin Resolution  <> The Richmond FBI Latin Mass Infiltration memo  <> the Duke Lacrosse Rape Hoax  <> the Jussie Smollett Hate Crime Hoax <> the Joe-Biden-is-mentally-as-sharp-as-a-tack Hoax and so many other ones.  

The present hoax of the moment pertains to the claim that July 4, 2023 was the hottest day since ... since ... since ... who-knows-when.  The explanations were irritatingly vague & contradictory, when coming from the media.

Important to note, at this point, is that the Year 2023 had brutal record-breaking cold, as well as heatwaves.  This included a MINUS 108 degree Fahrenheit wind chill in New Hampshire.  That fact needs to sink inward, deeply:


At the end of 2023, in December, 60% China went through record-breaking cold:


Even, in December of 2022, a couple weeks before the start of 2023, there was record-breaking cold on a national scale in America, with life-threatening wind chills:


Even concerning the Year 2021, from Feb 7 to Feb 21, there were 9,027 cold temperature records that were tied and surpassed.  Plus, Antarctica had it coldest winter in recorded history, in 2021.  

The bottom line is that the coldest of the cold weather has been here, in the 2020s, all along.  It's simply that you had to put up with the Biden Administration in the first half of the 2020s.  Biden always was a known liar, and Kamala was caught lying throughout her entire campaign.  Those details are posted at the Blue Marble Album, too.  None the less, if the Al Gore CO2 Climate Theory were true, there would only have been mild winters since his 2006 movie.  There have been occasions of tremendous cold during that time.  After all, I was in -7F and -11F weather in Chicago, during that time span.  I was also in 104F and 106F weather.  The climate outside has not been one-sided, with heat only.
                            
Below:  German television photos from the First Day of Summer 2017 & 2022.  They show how propaganda developed over a short period of time.  Take note that 2022 was during the Biden-Harris years.  The temps of the first day of Summer 2022 are much lower than the ones of 2017.  Yet, the temps of 2022 are made to look like heatwave numbers.  Fifteen out of sixteen of those temps were not.
22 Celsius = 71.6F   24 Celsius = 75F   26 Celsius = 78.8F  28 Celsius = 82.4F   
Above:  All  but one temp on the 2022 map are pleasant summertime temperatures to us Americans.  They should NOT be posted on a background of searing, heat-driven, global-warming-red.

The Worldwide Temperature Scorecard, for July 4th, 2023

It was originally reported as "the hottest day on Earth."  That didn't sound right, so it was then reported as the day of the highest average global temperature.  It was next reported as the "unofficial" temperature.   It then came to be regarded as the hottest day in history, even though DOZENS of official archived weather reports don't show this to have been the case in any capacity.  It had to do with "Surface Temperature Anomaly."

The reason for the claim

It was on July 4th, 2023, when two Antarctic weather stations underwent an extreme temperature rise within a 36 hour period, with both of the stations' outdoor terrain remaining solidly frozen real estate.  The two stations together had a temperature increase of 86 degrees Fahrenheit and such data can numerically make it look like Planet Earth is burning-up, even though the places of the temperature rise constitute frozen terrain.  However, the combined average temperature between the two stations that July 4th day was -33 degree Fahrenheit.  

Such a ploy is a False-Light Deception.  Such a ploy is a sleight of hand trickery.  Let us go through the names and the numbers.

One station was the Davis Station, situated on a coastline, at the 68th Parallel.  This means that it's not deeply within the Antarctic Circle.  It's average July high temperature is 7 degrees Fahrenheit, and its average July low temperature is -8F.

On Sunday, July 2nd ... 2023 ... within the 12pm-6pm time bracket, the temperature at Davis was -29F.   Approximately 36-48 hours later, it was 21F.  The temperature rose 50 degrees F.  Yet, the outdoor air was eleven degrees below freezing.

 ***************************************************************************

The other Antarctic weather station involved in this sleight of hand deception was the Concordia Station, located 10,607 feet above sea level.  This is one of the weather stations where epic cold transpires on a regular basis. 

On Monday, July 3rd, within the 6pm-12am time bracket, Concordia was 90 degrees below zero, Fahrenheit.  Within 24 to 30 hours, the temperature at Concordia was 54 degrees below zero.  The temperature rose 36 degrees Fahrenheit in approximately one day's time. 

When you add 36 & 50 you get an 86 degree Fahrenheit rise in temperature.  If you have no conscience, and if you are looking to deceive Congress and/or an NGO into giving you outrageously large financial donations, then you'll make July 4th, 2023 look like a killer heatwave upon humanity, when the only epic temperature rise on the planet was in the dead cold polar night of Antarctica's winter.

It was also a diversionary tactic that conveniently hid from the minds of American citizens the recent record cold & recent dam replenishments

More importantly, the claim of the hottest day since whenever was a great diversionary tactic which could easily get the public to forget about the recent record cold temps of early 2023, as well as the seemingly miraculous 2023 water replenishment of the dams in California and elsewhere in the American West.  

That water replenishment was equivalent to a cancer patient suddenly being cured.  Yet, the replenishment was predicted by those of us ... including me ... who understood that the directional flow of the Pacific Ocean's equatorial currents oscillate ... and cause very predictable atmospheric behaviors.

Simultaneously, there was the matter of how the weather of 2023 was expected to resemble the heatwave & drought Year of 2012, due to existence of the 11 Year Sunspot Cycle Theory.  And mysteriously enough, the hottest years are not also the years with the most sunspots.  Yet, there seems to be a pattern.  Perhaps.  Therefore, if and only if the 11 Year Sunspot Cycle Theory is the real deal, then a repeat performance of the record cold winter of 2014 will come in 2025, at least in part.  

Concerning 2014, Antarctica had it's largest sea ice extent in recorded history.  In 2014, America had its harshest winter in 40 years, even to the point of making Florida a chilly venue, in the process.  Seven years later, in 2021, Antarctica ended up having its coldest winter in recorded history.  And in 2021 & 2022, there were record high harvests.  Such facts are NOT a Climate Crisis.

Paris

A tragic heatwave that comes upon the same European landscape  ... in intervals of time ... does NOT constitute any form of a never-before-seen global phenomenon.  When the atmospheric CO2 level was undoubtedly low, there was summertime tragedy in Paris in 1911.  There was the same type of tragedy there in 1976 and in 2003, when the CO2 level differed between the three years of Parisienne tragedy.  

The truth is that whatever weather events on Earth happened in the past three years ... and in the past thirty years ... all happened previously.  Mankind has repeatedly seen it ... over and over again and again ... even when the CO2 level was low.   Therefore, that which Sigourney Weaver read at the 2016 Democrat Party Convention was one easily provable lie.

Moreover, the recurring Paris heatwave tragedy that dates back to 1911 was NOT an issue on the 4th of July, 2023.  This is BECAUSE the high temperature in Paris on that day was only 72 degrees Fahrenheit.  See for yourself.

London

Meanwhile, in London, a city claimed to be engulfed in greenhouse gas-induced flames, the high temperature for July 4th, 2023, was no more than 64 degrees Fahrenheit.  It was 17.77 degrees Celsius there.  That temperature comprises a Spring day in Pittsburgh ... or Philly ... or Cincinnati.

Despite the statistics, certain players of the UN, the Biden-Harris Administration, and the mainstream media acted as if the End of the World was at hand and that it was all the fault of people who drive automobiles, use gas stoves, own gas water heaters, and herd cattle.  The political players had no idea how asinine & buffoonish they sounded in front of video & TV cameras, whenever they spoke.  

                                                       ☘📖📖📖📖📖📖📖☘ 

 Review of the temps of July 4th, 2023 throughout much of the Northern Hemisphere

As a quick preview, it was at the actual South Pole, in Antarctica, where it officially measured -67F to -81F on the day that was "unofficially" declared the hottest one since 1979 ... and later declared the hottest day in human history ... with that day being July 4, 2023.  

Moreover, at the United States McMurdo Station, located very near the famous & exceptional large Ross Ice Shelf, the high temperature there was a deadly MINUS 14 degrees Fahrenheit, with the low of that day being an even more deadly -28F ... on the 4th of July, 2023, of course.   Then there is the famous Vostok station.  On July 4th, 2023, it was -56F at Vostok.

And Now to Africa

At Addis Ketema, Ethiopia, it was no more than 67 degrees Fahrenheit, on July 4th, 2023.  On the northern border of Ethiopia is Eritrea.  At Asmara Maekel, Eritrea, the temperature did not go above 77F, on the same July 4th day.  

At Kampala Uganda, the temperature did NOT go above 75F, on that day.  At Mbabune, Haut Uele, in the Democratic Republic of the Congo, the temperature did NOT go above 77F on the exact same day.  

Of course, one would assume that the general Congo area is always blazingly hot.  Well, it's not.  Tanzania also has regions that are perpetually mild, as does Kenya and Ethiopia.  In fact, there is a plateau in Nigeria where it doesn't get any hotter than it does in Pennsylvania, 5,000+ miles away.  

In continuing, it was at Karachuonyo Kenya, on July 4th, where the temperature did NOT go above 78F.  In Nairobi Kenya, the high temperature of 7/4/23 was only 68 degrees Fahrenheit.  These African temperatures are equivalent to Springtime in Pennsylvania, and this shows that Africa is not a continent engaged in a wall-to-wall high temp climate crisis.  

Concerning the absence of heat in regions of Africa, if all of Africa were as heated as the Climate Hysteria People make it out to be, then fur-clad mammals could not survive there.  This includes the lion, the ocelot, the hyena, the monkey, the gorilla, the giraffe, the fennec fox, and the rock rabbit.  Political activists don't think.  They live on emotional surges.

Back in the USA

Let's take a look at Los Angeles in Southern California, as in "It never rains in Southern California."  It should have at least been 90 degrees Fahrenheit in sunny LA, on the hottest day in satellite history.  It was only 78 degrees Fahrenheit on that Fourth of July day, and that is equal to a late Springtime day in Pittsburgh, Pennsylvania ... or Columbus, Ohio.   

The Mediterranean

Even Beirut Lebanon was 7 degrees Fahrenheit below its July average.  Thus, on July 4th, 2023, Beirut was like a summer day in none other than . . . yes, you got it . . . Pennsylvania.  So, where was all the "record-breaking heat" on July 4, 2023 ???  Beijing had a high temperature that day.  But, Beijing is not the "whole world."  Chicago had a hot day too, as did Seoul South Korea.  But, Chicago & Seoul do not constitute the "whole world," either.

Past the Red Sea

Yemen borders on Saudi Arabia to the north and the Arabian Sea to its south.  The Red Sea is to its left.  So, a novice would assume that Yemen would be as hot as the interior desert lands, minus the area that gets the Arabian Sea Breeze.  Well, on July 4th 2023, it was 74F at Shib al Murasysi.   

And yes, it's always hotter in Pennsylvania on the 4th of July.  For example, the July 4th temperature average for historic & tragic Gettysburg Pennsylvania is = = = =>  85F.  On July 4th (2023) it was officially 87F in Gettysburg.  Two degrees Fahrenheit above average is NOT global boiling.

India is known for hot summertime temps

At the southwestern tip of India is Thiruvananthapuram.  It used to be called Trivandrum, and it's still the capital of the State of Kerala.  It's located at 9 degrees latitude.  So, its between the Tropic of Cancer and the Equator.  Surely it gets blazingly hot there.  Well, not on July 4th, 2023.  It was 84F there on that day.  In fact, its historic July average high temp is 85F.  

At this point, enter the center of Southern India, where it should be really really hot in the summertime.  The city is Bengaluru, aka Bangalore.  It's in the State of Karnataka, and its historic average July high temperature is no higher than 81F.  On July 4, 2023, it was one degree BELOW average in Bangalore.  That doesn't sound much like the hottest day in human history.  That doesn't sound much like "global boiling."

Now enter Mumbai, the Indian city which was the recipient of a wave of terrorist attacks in November of 2008.  It's India's most populated city.  It's historic average July high temp is 86F.  On July 4, 2023, it's high was 84F.  Mumbai's hottest day in the entire month was no more than 2 degrees Fahrenheit BELOW average. 

London England, the actual Tale of the Measuring Tape.

London England's July 4th, 2023 temps are the most influential of them all.  And why?  It's because the 2022 media went haywire, in FALSELY CLAIMING that CO2 was causing London to heat-up, dry-out, and burn so badly that the London Fire Brigade had it busiest day since WWII, on July 19, 2022.  Well, a number of days in 1976 and in other 20th Century months were more busy for the LFB than was July 19th, 2022.

None the less, on July 19, 2022 it was boldly proclaimed that London was on the verge of charred annihilation and that all of the Earth was now in a Climate Crisis.  This means that the Year 2023 was guaranteed to be just as hot and dry as 2022 was in London for a four or five day period.  In as much, what was London's high temperature, during the July 2023 day which was declared to have been the hottest day in known history?  Was it over a hundred degrees Fahrenheit in London?  

ANS: Not at all.  It was 64 degrees Fahrenheit in London, on July 4, 2023.  The low nighttime temperature for that particular day was 57F.  That's equivalent to a chilly Spring day & a mild Spring night in Pennsylvania, USA.  

London's high temp for July 1st, 2023 was 72F.  For July 2nd, it was 68F.  For Monday, July the 3rd, London's  high temp was 68F.   

Then, on July 19th, 2023 ... on the one-year anniversary of the London-is-burning-due-to-greenhouse-gas story, the temperature in hot hot London was no more than .... 72F ... with the humidity being 52% ... and with the barometer reading 29.98 Hg ... and with a windspeed being 11.807 miles per hour, between the hours of 12pm & 6pm.  After 6pm, the humidity rose to 61%.   

And remember, the date was July NINETEEN, 2023.  There's your blazing Global Boiling heat for you, folks.  It was all a con game.   See for yourself:

                                   Below: July 1 to July 6, 2023.  No infernal temperatures here.

One year after all of the End-of-the-World-in-London hype,  the high July temperatures ... day after day in London ... were only in the 70s Fahrenheit.  The journalism of July 19, 2022 was shear fraud.    *********************************************************************************

                                     Below: July16 to July 21, 2023:  The Anniversary of a Lie


That unconscionable deceit of the Greater London Story is covered at the Blue Marble Album, in two detailed posts, with numerous illustrations contained within, including some of the Incidents Report pages from the London Fire Brigade, itself:

            https://www.bluemarblealbum.com/2022/11/london-fire-statistics.html

                        &                                        &                                           &

https://www.bluemarblealbum.com/2024/05/July2022-official-greater-london-fire-stats.html

Elsewhere

Bogota Columbia had a high of 69F, on that exact same July 4th day.   With this having been cited, answer one question:  Where was all the excess heat on July 4, 2023 ??? 

Keep in mind that there are regions where 90+F and 100+F and even 110F are the average temps.  This includes Baghdad & Kirkuk as two examples.  In the middle of July there, the average high temperature hovers around 111F.  Well, on July 4th, the temperatures at those hot-temp regions were basically average.  You can go and look for yourself at a number of readily available information sites.   Here is an example:

Mexico also has been known to have hot temperatures.  Yet, on July 4th 2023, it didn't go above 80F in Mexico CityToluca Mexico only had a high of 79F, on the exact same July 4th day, and Metepec Mexico only had a high of 72 degrees Fahrenheit.  

Meanwhile, the high temp in Fresnillo, Zacatecas, Mexico was only 73F.  In fact, it didn't get hotter than 73 degrees Fahrenheit in Fraijanes Guatemala.  It is literally hotter during any given Pittsburgh summer day, and Pittsburgh is 2,348 miles north of Mexico City.  

Thirty-six or so photographic samples are below, comprising one Greenland illustration & 35 or so monthly temp charts ... trimmed down in two-week or one-week increments.  

Of course, being that it's Wintertime in the Southern Hemisphere in July, no Southern Hemispheric city or town is cited below.  No Russian or Scandinavian city is cited, either.   And no Canadian city is cited herein.  

None the less, Planet Earth doesn't appear to be the End-of-the-World inferno it was made out to be, by those who, under Biden & Harris, planned to confiscate your gasoline-powered car, your gas stove, and then your gas water heater, followed by your gas-powered central heating unit, otherwise known as your furnace.  Look, perceive, and be liberated.

Above:  July 2023.  Two years prior, in 2021, Antarctica had its coldest winter in history.  The co2 level was almost exactly the same as today.  So, how do you go from record cold to record heat, if co2 rules the planet?  Plus, how does co2 drive the atmosphere, if it only exists there at 1/10th of 2/5th of 1%?  ANS:  CO2 doesn't drive the climate.  The Sun does.

Below:  The actual South Pole was MINUS 67F on the 4th of July, 2023, and it got as low as -98F in Antarctica, at more than one place there ... during July of 2023.
******************************************************

Below: McMurdo had a high temp of MINUS 14, on the 4th of July 2023.
                      ***************************************************
Below:  Africa ...
On July 4, 2023, Nigeria's Jos South Plateau had a high temp of 78F.
  ****************************************************************
       
Below:  Falchi Oromia, Ethiopia, had a high of only 78F, on the 4th of July, 2023.

                         **************************************************

        The high temp in Addis Ketema, ETHIOPIA was only 67F, on the 4th of July, 2023.

****************************************************************
The high temp for Nairobi Kenya, on July 4, 2023, was 68F.  That's  a Springtime temp.

*****************************************************************

At Kendu Bay Karachuonyo, in Homa Bay KENYA , 78F was the high temp on 7/4/23.

******************************************************

On July 4, 2023, in Mbabune, Haut-Uele, Congo, the high temp was 77F.

         ******************************************************************

             In Kampala Uganda, on July 4, 2023, the high temperature there was 75F.

****************************************************************
  
        In Hharwetaay Kalvari, TANZANIA, on 7/4/23, the high temperature there was 64F.

Are you getting the feeling that the UN lied to humanity?

Below:  Mexico & Central America            
                                                                      73F at Toluca
                    ******************************************************
                                                             80F at Mexico City
****************************************************************

  Fresnillo, Zacatecas is in between Guadalajara and Monterrey.  It was 73F on 7/4/23.
 Is this NASA's idea of an Inferno Earth?  Where was all this excess heat? 

                       ****************************************************
   
 Below:   Frainjanes Guatemala.   On 07/04/2023, the high temp there was 73F.

           ***************************************************************
Below:  Los Angeles
     Los Angeles reached no higher than 78F on 7/4/23.  
Above:  This is NOT global boiling.  It's the U.N. & the Biden People lying to the world, al the while creating fear & dread & a sense of servile urgency in the hearts of the uneducated & the undereducated ... aka the misinformed.
              *************************************************************

The Middle East

Below:  Any place bordering Saudi Arabia should be ablaze with climate-crisis heat.  Well, not Yemen.  That's for sure.  At Shib al Muraysi, the high temp there was 74F.  Needless to say, that's equal to Springtime in Pittsburgh.
       
*********************************************************

Below:  A high temp of 76F next to Saudi Arabia is nowhere near a climate crisis.

                     *****************************************************

Now for L'Espagna & L'Italia, as well as Aveiro, Portugal

**************************************************

*************************************************

****************************************************************

72F in Aveiro, on the 4th of July, 2023.  This is NOT how the world is going to end.

                          ************************************************
       
   Below:  It was only 70F on July 4th, 2023, in Brescia.  No global boiling here, folks.

                       ************************************************

Below: India & Indonesia

                                    Below: This was once known as Bangalore, India

           **********************************************************

  Below:  The capital of the State of Kerala.  It was once known as Trivandrum.  

                       77F on July 4th, 2023.  81F the day before and 76F the day after.

             ******************************************************

Below: Mumbai is the Indian city with the largest population, located on the west coast of India.  It's average July high temp is 86F.  On the 4th of July, 2023, its temperature was two degrees Fahrenheit below average.  So, where on Planet Earth was all of this "record-breaking" heat, on July 4th, 2023 aside of Beijing & Chicago?

          *************************************************************

Below:  Tinggimoncong, South Sulawsei, Indonesia.  It's located at the southern section                                                                        of Borneo's middle island.  70s Fahrenheit temps are NOT end-of-the-world                                                                              heat stroke temps.

            **************************************************

Below: Tragic Beirut.
  Once upon a time, it was the most beautiful city in the Middle East.  But of course, envy kills.  Now, Beirut's historic average high temp for July is 88F.  Thus, it has been known to get very hot there.  But NOT on July 4, 2023 or on any day surrounding July 4th.  In fact, from June 28 to July 4th, Beirut's high temperature each day was six to seven degrees Fahrenheit BELOW AVERAGE ... in 2023.  

     ***************************************************************

Below:  Somewhat center of the northern border of Turkiye is Giresun.   No heatwave there on 7/4/23. 
       ***********************************************************

Let's go to Sri Lanka, the island southeast of India.  It used to be called Ceylon.  There's a major city there, called Ratnapura,  In Sanskrit, it means, City of Gems.  It's located in the southwestern sector, about 6 or 7 latitudinal degrees above the Equator.  It can get hotter there than in the average city, but not on July 4, 2023.  The high for that day was 82F.  That was like summer in . . . Pennsylvania.  Actually, parts of Pennsylvania were hotter.
       
              ****************************************************************
Let's travel eastward and do one more example.  Let's go to Honolulu, Hawaii, which can be construed as a land somewhat in the middle of the Pacific Ocean.  

To start, what is ... at present ... Honolulu's average high temperature, for any July, based on thirty years of data-gathering?  ANS:  88 degrees Fahrenheit.  

Okay then, what was the high temperature in Honolulu on July 4th, 2023?  ANS: 88 degrees Fahrenheit, a perfectly average temperature for that day.   There was no global boiling then or there.

Okay then, what was the high temperature in Honolulu on the day prior to July 4th, 2023?  ANS:  Honolulu's high temperature was 88 degrees F.  Okay then.  What was Honolulu's high temperature for the 2nd of July 2023?  ANS: 88 degrees Fahrenheit, also.  

Okay then,  What was the high temperature for Honolulu the day after July 4th, 2023?  ANS:  It was 84F, four degrees Fahrenheit LOWER than the average.  Alright then.  What was the high temperature for Honolulu two days after July 4th, 2023?  ANS: 86F, two degrees Fahrenheit below average.

Now look below.  You're looking at average temperatures.  Have you gotten the point yet?

The source mentioned by NASA, as having alerted scientists to the heat of July 4th, was the Univ of Maine's climate department.  It operates a "Reanalyzer"   Yet, NASA's July 4th satellite image and the July 4th satellite image used by the Univ of Maine differed.   None the less, without anybody going outside to check how hot it was out there, July 4th 2023 was declared the hottest day since whenever.

The Univ of Maine has a climate department that goes back to the 1970s.  The original purpose of the Maine climate center was to fend off what apparently was an oncoming ice age.  It was brutally cold in the 1960s, as well as during most (but not all) of the 1970s.  It was also colder than average in the 1940s, as is evidenced by the bitter cold that accompanied some of World War II's most famous  ...  and tragic  ...  military operations.

Concerning the image NASA used to describe July 4th 2023, it was an infrared image, as opposed to a "visible image" or a "water vapor image."  Now, infrared images are naturally shades of gray.  Color is artificially added to the IR image, to help the viewer differentiate the things in the photo.  Well, NASA ever so coincidentally painted red over the airspace of every landmass on Planet Earth, except for the Himalayas.  Yet, there were numerous places in the Northern Hemisphere and at the Equator where the temperature was mild ... and even in the record cold/low range.     

Plus, during wintertime in the Southern Hemisphere, NASA made the Southern Hemisphere look like it was locked in a heatwave, recently ... under Joe Biden, of course.  However, the Univ of Maine's satellite image had the color blue over places where there were near-record cold temps and where mild average temps existed.  This included the middle north of the United States.

On any given day, there are places on spherical Planet Earth which are below normal in temperature.  There are other places where the weather is often mild, including certain nations on the African continent.  The NASA photo which advertised the hottest day in modern history presented the low temp regions and the perpetually mild regions of Planet Earth as "global warming infernos."  Some people need to be immediately dismissed from their posts at NASA.  In fact, CNN must have its FCC license revoked.  CNN is nothing more than the Liar's Television Network, as well as the Insult to the Intelligence Television Network.

Northward to the Arctic

As far as goes the satellite score-keeping on the Arctic, the climate activists claim that it began in 1979, when there ever so coincidentally was the most ice coverage in the Arctic ... in the Space Age.  This means that every ice reading after 1979 was certain to be lower than 1979's ice volume.   Satellite views of the Arctic began in 1964.  There's an entire post about the 1960s satellites, as they applied to monitoring the Polar Caps.

If you lie to the people, they won't know that 1979 was an exceptionally high volume sea ice year.  They will assume that 1979 was an average year, even though it was the highest year of Arctic ice volume in recorded history.  It was the summit ... the crest of the roller coaster ride.  This is why the Biden-Era charts start at 1979 ... to deceive into thinking that there weren't any low sea-ice years before 1979.

The use of the Year 1979 as the starting point of a sea ice graph was done with the intention of hiding the lower ice year that came before 1979.  Sea ice, on occasion, came before 1979.  But, the Biden People wanted to deceive you into thinking that there were no low-Arctic-ice years until after 1979, so that they could blame the reduction in sea ice on CO2.  Proving that there were lesser & lower sea ice years before 1979 invalidates the whole Global Warming Theory, and it puts Al Gore out of business.

However, when winter comes, Arctic ice is mostly the same volume, with only a fraction of difference ... usually in the East, near Scandinavia's northern sector.  It has something to do with the clockwise-moving Atlantic Gyre ... and its transport of Mexico gulf water northward.

The Reality of it all

Antarctica had massive ice gains between 2009 & 2019, pursuant to a peer reviewed science research team.   The Ross Ice Shelf was found crystallized at its bottom, pursuant to a New Zealand research team who was there.  In fact, Antarctica had its largest Sea Ice Extent in 2015.  And the Year 2021 was Antarctica's coldest winter in human history.

Greenland had a recent ice gain on a massive scale as recently as June 2023. (See the official illustration below, provided by Danish scientists.).   And of course, the Jakobshavn Glacier ... aka Llulissat Glacier ... was discovered growing once again, in the late 2010s.

All in all, "the climate crisis" people are lying to the public about the statistics and the present objective realities of weather & climate.  They use false light assertions & sleight of hand deception.  They present Computer Model as if to have been measurable physical realities touched by scientists.

An example of the deceit is Mount Kilimanjaro, where the temperature never goes above the 32F melting point.  It doesn't even rise above 21F there.

As far as goes Antarctica, the climate doomsayers only focus on a western string of ice shelves in ... of all places ... West Antarctica.  Well, East Antarctica had the massive ice gains from 2009 to 2019.

Now for Mount Kilimanjaro, as well as the tops of the Himalayan mountains:

They both experience sublimation.  Sublimation is the phenomenon where ice turns into water vapor without first turning liquid.  It's based on powerful winds called Chinook winds ... Foehn Winds, etc.   The obvious sign of sublimation is that the ice looks jagged, as opposed to smooth.  Yet, Al Gore had the indecency to tell the world that Mount Kilimanjaro was melting because of co2, when the truth is that Mount Kilimanjaro is 19,000 feet above sea level and a 16,000 foot climb to the top, from its landmass base.

In addition, Antarctica had its coldest winter in history, in 2021.  If the Al Gore CO2 Climate theory were true, then Antarctica would not have had its coldest winter as recently as 2021.

The Arctic was in the Melt Mode in 1922 & 1911, when atmospheric co2 was much less.

Mankind was technologically advanced enough to have known during a very heat-ridden 1922 that it's official ice sheet in the Arctic did NOT exist until the 82nd parallel.  In as much, the Arctic Circle begins at the 66th Parallel, while the 90th Parallel is the tip of the North Pole.  Do the math on 1922 ice loss.

Modern science knew that the Northern Hemisphere's ice sheet receded significantly.  Yet, the co2 count back then was 116 parts per million less than today, and according to Al Gore, Michael Mann, and John Kerry, such a thing is impossible.  

If the Global Warmists of today let people know that there was a major decline in Arctic & glacial ice a hundred years ago, then their co2-centered doctrine of climate paranoia would instantly fall apart in the minds of anyone not yet brainwashed by You-Know-Whom.  None the less, there was far more Arctic ice in 2022 than there was in 1922. 

In re: July 4th, 2023

It was NOT the first time when America's Independence Day was declared the hottest day in the history of this, that, and the other thing.  Thus, anything posted by the climate paranoia lobby on the 4th of July reeks with propaganda & indoctrination.

Concerning the July 4th claim, extraordinary claims require extraordinary evidence, and the burden of proof is on the tall-tale tellers who seem to only know how to frighten schoolchildren.  Plus, extraordinary claims require extraordinary experiences.  If July 4 were the hottest day since 1979, there would have been widespread catastrophes in every time zone, and there would have been a lot of stories to tell news reporters.  

People would have easily remembered that day as something epic, as well as something traumatizing.  No one would have needed CNN to tell them that it happened two days later.  Fuel supplies would have been already drained.  Deaths would have been as many as those in a war zone.  Ambulance tires would have been worn-away.  Society would have completely shut down for a short while, if July 4, 2023 were an epic weather day.  

There are no epic life experiences that accommodate the epic claim that Planet Earth underwent its hottest "average temperature" on July 4th of 2023.  Major cities didn't get visited by deadly heatwaves.  Ambulances were not roaring up & down city streets.  It was just another dime-a-dozen American Holiday when a Yankee can catch up on his sleep.  

In addition, there is the same amount of co2 in the sky today, as there was on the 4th of July.  Why isn't today also the hottest day ever, if the Al Gore theory of co2-driven Temperature is true?  Another note to make is that, as soon as an event occurs which disproves the Al Gore Theory of Climate, a new climate horror story comes out for public view.

Simultaneously, when there is a cyclical rise in temps for a transitory period of time, someone in the Global Warming Activist World piles on and makes an asinine claim that involves Planet Earth for all time or Planet Earth for the past one thousand years.  

Well, the satellite experts noted that May & June of 2023 had temps that were higher than average, to the tune of 0.37C for May, and 0.38C for June.  So, someone decided to pile-on and claim that the hottest day ever had just occurred ... without us feeling it.

Q:  So, what events recently occurred that make the Al Gore Theory of CO2-centered Climate look like a blatant farce?  

ANS: [1]  Greenland had a recent massive gain in its Surface Mass Balance, as is illustrated below, by the Danish Meteorological Society.   Concerning this, it's important to keep in mind that Greenland's sovereign is NOT the United States.  It's DENMARK.  Therefore, the official news of Greenland's weather and climate comes from THE DANISH METEOROLOGICAL SOCIETY.  The United States is NOT the absolute dictator of the world, as some people might be inclined to believe.  

At present, the United States is a black-hole of debt, in having run by some of the most banal minds & manipulative deceivers you can find.  After all, power and wealth attracts the most evil of greed-stricken & power-hungry predators.  This includes public hair sniffers who have been on film doing there hair-sniffing numerous times.  None the less, the scientific source of Greenland is Denmark.  And the Danes are not stupid people.

[2] It was found that 16 of Antarctica's 34 ice shelves were growing so well that Antarctica underwent a gain of ice amounting to 661 gigatons, between 2009 and 2019.   Of course, the very dishonest, money-grabbing climate activists only spotlighted the 18 receding ice shelves in West Antarctica.  And remember, the Antarctic Peninsula is outside of the Polar Circle, and the tip of that stretch of land is 1,840 miles away from the South Pole.  It's only 500 miles away from Argentina.

[3] Fort Lauderdale's April 12th rain & low-speed wind wasn't even close to Florida's record high rain storm --- or to anything resembling "a thousand year storm."   Nor was it close to Texas' rainfall record, Virginia's rainfall record, and Pennsylvania's rainfall record.  But, it was close to California's record which occurred long before Florida's April 12 storm ... and which came a whole lot sooner than 1,000 years ago.

[4] The claim that Greater London experienced its most fires & incidents on July 19, 2022 wasn't even close to the reality.  The reality was that, on numerous days throughout the late 20th Century & early 2000s, London Area fires occurred in much higher numbers than today.  In fact, 2022 was the year of the fourth least number of Greater London fires.  In the prior year ... 2021 ...  Greater London had its LEAST NUMBER of fires.

[5] The Great Barrier reef was officially reported to have regenerated in two of its three sectors, while rain returned to Australia, meaning that Australia is NOT going to be a climate refugee state anytime soon.   

[6] The dams of California and elsewhere out West were readily replenished in very little time.   

[7] During February of 2023, Asia underwent its lowest cold temperatures.  

[8] Antarctica underwent its coldest Winter in documented history, in 2021.

[9] Antarctica had its largest sea ice extent in 2014, and the bottom of the massive Ross Ice Shelf was found crystalized & frozen ... and NOT smooth & melting ... in 2015.

[10] Plus, the Winter of 2014 was declared the coldest winter in 40 years for the Northern east of the United States.

Now, with all of the aforesaid findings having been posted & published for public view, the co2-obsessed climate doomsayers had to fabricate a new set of climate horror stories, as a diversionary tactic.  Plus, they had to pile on to the report that the months of May & June 2023 were months of relatively high temperature anomalies (0.37C for May & 0.38C for June.)  This anomalous warmth came after record cold.  But, the climate activists will omit mention of the record-breaking cold & snow of the Year 2023.  

Freedom of Speech had become regarded as an Un-American activity at the Turn of the Millennium, as much as it is today ... by those in power ... who want to stay in power ... but who know that they must keep you stupid, in order to achieve their goal ... of having power over you ... which results in them getting taxpayer dollars from you.  

But, you must be kept unheard & unread as much as possible ... no matter how much experience & research hours you have accumulated ... and no matter how many writings you have personally written --- and no matter how many charts & videos on pertinent subjects you have composed.  You are to not have a voice outside of mimicking the narrative of tyrants who amassed fortunes on the salary of a senator or a congressional rep.  

Wall Street Wizards

These politicians sit on fortunes without having any proof of having sold a product or service, to justify such a fortune.  This absence of product sales & service sales is seen in the tax returns of congressional lawmakers.  Their stock investment records are so magnificent that these people should not be in Congress.  They should be on Wall Street.  But of course, Congress is where you get the insider information that makes you look like a Wall Street Wizard.

The Climate Doomsayers' Perfect Record of Failed Predictions

After years of an American & British presence in Iraq, no such weapons of mass destruction were ever found.  Likewise, none of the doomful climate alarmist predictions have ever come true, and those predictions began in June of 1988.   This amounts to 35 consecutive years of failed predictions.  The only thing that changes are the prediction dates.  They keep getting moved back.  After all, the very first year predicted to be the one when all the glaciers at Glacier National would be gone was . . . by 1948.

Meanwhile, [1] the polar bears did not go extinct.  [2a] The islands of the Maldives remain above water, along with several international airports there.  [2b] The drinking water for the Maldives did NOT dry-up by 1992, as predicted.  [3a] The Atlantic Ocean's gulf current did NOT stop flowing northward.  [3b] Britain did NOT become "Siberian" by 2020.  [4] Nobody disappeared in a cloud of blue steam by 1989, as Ehrlich predicted.  [5] There has never come to be the category 6 hurricane.  

[6]  Crop yields have occasionally been at record highs.  [7]  It still snows.  [8] We still do NOT have an ice-free Arctic Ocean in August.  [9] The glaciers still have not melted away.  [10]  Lower Manhattan is still not underwater.  [11a] The Great Barrier reef replenished.  [11b] Australia is still not a climate refugee state.   

Then came 2022 and the claim that co2 was causing an increase of Greater London fires.  The truth was that the 607 square mile Greater London landmass had its LEAST NUMBER OF FIRES one year prior, in 2021.  In 2022, it had its FOURTH LEAST number of fires.  In fact, in all years from 2014 to 2022, yearly fires were at least half the number they were, from 1969 to 2008.  As co2 levels rose, Greater London fires decreased significantly enough for the London Fire Brigade to have bragged about it.  As a result, at present, 2023 stands to be the year with either the least number of London County fires --- or the second least --- ever since record-keeping began in 1966.

SEE:  https://www.bluemarblealbum.com/2022/11/london-fire-statistics.html

ALSO: https://www.bluemarblealbum.com/2023/06/July2022%20greater%20london%20fire%20stats.html

The Ultimate "Climate Change" Activist's Hypocrisy

The greatest hypocrisy of the Climate Change Activists comes from the fact that the Mississippi River, at New Orleans, unleashes 4 million gallons of FRESH (unsalted) water into the Gulf of Mexico every second, 24 hours a day, 7 days a week.  

Plus, the Atlantic gets fresh water drained into it from  [1] the Amazon,  [2] the Orinoco,  [3] the St. Lawrence River,  [4] The Congo River, to the tune of 50,000 cubic meters of water per second,  [5] the Loire, at the 47th Parallel,  [6] the Niger River, into the Gulf of Guinea,  [7] the Elbe, into the North Sea at Cruxhaven's estuary.  

Of course, #8 on the list would be the Mississippi River.  So, that's a lot of fresh water entering into a salt water ocean, not causing England to turn Siberian.

In as much, it is such hypocrisy for Climate Hysteria Salesmen to obsess people with the seasonal "ice melt run-off from Greenland" (into the Atlantic Ocean), claiming that it's going to cause a Siberian England and a stationery Atlantic Ocean.  Well, the supreme asininity in this assertion is that, in order to stop the Atlantic Ocean from moving, you have to stop the rotation of the Earth and you have to stop the winds from blowing across the Atlantic.  The big problem is that those winds start at sea, and we are dealing with MILLIONS of square miles of saltwater ocean where within winds generate.  See:

https://a-z-animals.com/blog/4-million-gallons-per-second-and-7-other-incredible-facts-about-the-mississippi-river/

One More Decisive Feature to June 2023

You do know that El Nino was declared officially present in the American Pacific as of June 8th, 2023, correct?  That's an article (a tutorial) of its own.  None the less, ENSO drives the climate far more effectively than co2 ever could.  

But of course, cirrus clouds drive the climate more than co2 ever could.  And water vapor drives the climate far far far more than co2 ever could.  None the less, a predictable feature of El Nino is that Indonesia and Australia will get less rain ... even dry conditions ... NOT because of co2 levels, but because of the eastward-bound El Nino ocean current lane which happens to be bordered by relatively small ocean gyres.  Those things are like small spinning tops in the water, made out of water.  

In review, keep in mind the existence of the Eleven Year Sunspot Cycle, El Nino, and even the Atlantic Ocean Oscillation Cycle.  Climate is far more advanced than the Al Gore CO2 model.  

Furthermore, Michael Mann is a multiple liar.  [1] He never co-won any Nobel Prize, and the Nobel prize that Al Gore co-won was the PEACE Prize which is entirely different than the physics prize. 

[2] There most certainly was a Medieval Warm Period ... and a Roman Warm Period ... and a Minoan Warm Period.  [3]  There most certainly was a Little Ice Age from 1284 to 1840, and there even was a 124 year-long Justinian-Era ice age, starting in 536 C.E.  Numerous scholarly, research-oriented, peer-reviewed papers attest to these things that Michael Mann denies.  Thus, Michael Mann is the actual Denier.  Moreover, climate is very intricate.

It was not the climate that you had to have feared.  It was the lying politicians, lying media personnel, and thoroughly corrupt government officials appointed by those lying politicians whom you had reason to dread ... along with the useful idiots placed in front of cameras by dishonest media personnel who stopped  allowing counterpoint ... rebuttal ... debate ... & cross-examinations.  Under Biden, ... and also under the Cheney vice-presidency ... it was the United States of Orwell, where intelligence was regarded as the ability to deceive others.