It was a super big media alarm. The End of the World was coming. Oh my! An untold, unprecedented, unparalleled, unimaginable, unquenchable, and unbearable heatwave was menacing South America, during its Winter of 2023. The central focal point of time was August 1st of that year.
Santiago was reported as being a place of oppressive & "sweltering heat," all the while creating plumes of deadly smog over the city ... even though smog is simply ground-level ozone and is NOT formed the way in which journalists uneducated in atmospheric science claim.
None the less, also put on display was Vicuna, Coquimbe (in Chile). It was reported to have reached 99F there, on August 1st, 2023, in the middle of the Southern Hemispheric winter ... NOT. It was only 63 degrees Fahrenheit there, on that day, pursuant to professional meteorological record-keepers. The mainstream TV & Print media outright lied.
Predictably enough, this trend of FALSE weather reports occurred under the Biden Administration. The goal was to deceive the world into believing the Year 2023 was the hottest year ever. This would then allow the Biden Administration and the UN to possess dictatorial powers upon the West.
The Fraudulence of CNN
It was then mentioned by none other than the less-than-honest CNN that 100F+ temperature readings were occurring throughout South America in early August of 2024. However, the meteorological companies such as Accuweather & the Weather Channel tell a much more tame story.
Immediately below is part of a CNN article, also posted pursuant to the US Fair Use Act. It's a report on the August temperatures in Chile. Take note that it states: "dozens of stations are recording their highest ever temperatures in the first half of August." The mention of 100F temperature readings is included in that wintertime news article.
Okay then. Where is the list of the weather stations involved? Where are the official stats, data, charts, calendars, graphs, reports, briefings? Where's the evidence of this global boiling winter? Were people being hospitalized by the tens of thousand in those areas? Were people dying by the thousand there?
People were dying by the thousand in Paris France, in the Summer of 1911. Paris in 1976 and 2003 were tragic summers, also. So, if South America in the Winter of 2023 was not like Paris in 1911, then the recent news reports were a collective fraud via sensationalistic hyper-exaggeration ... done by media employees who needed to be fired immediately.
Below is actually one of many Doomsday passages in the CNN Book of the Apocalypse. This is countered by over 31 pieces of evidentiary support, all posted here. Let us begin. Shall we?
*************************************************
This makes it sound as if South America ... between the 30th and 35th Parallels ... has become an apocalyptic inferno that demands an immediate environmental response by which all humans are to surrender all of their rights and then do whatever they are told to do. Santiago is on the 33rd Parallel. In North America, the 33rd Parallel passes through the middle of Arizona, New Mexico, Alabama, Mississippi, Georgia, and South Carolina. That's warm weather land. Thus, expect no Arctic temperatures in the Southern Hemisophere's 33rd parallel degree, either..
Moreover, the Tropics are located at 23 degrees ... north and south. And of course, the Tropic of Capricorn travels through northern South America, meaning that the temperatures will also be at least warm ... even in wintertime. Even concerning the Tropics, there is no concept of "warm season/cold season" there. There is Dry Season and Wet Season, instead.
All in all, if August temps are between 55F and 75F in the vicinities ranging from Santiago to Vicuna, then you have no end-of-the-world scenario. You have average --- the mean --- the median -- the mode. You have You only have con artist journalists who need to have their FCC licensing revoked from their establishment.
Such an entity also needs to be served with a major class action lawsuit, for the Intentional Infliction of Emotional Distress, especially upon the school students told horrors about the weather which has been nothing more than a repeat of the 1930s, 1920s, 1890s, and 1870s. After all, history repeats itself and climate is CYCLICAL.
CNN did NOT pass the Carl Sagan Test
Now remember, "extraordinary claims require extraordinary evidence." (Carl Sagan) In as much, where is the picture of the thermometer which recorded a 99F or a 100+ degree reading in Wintertime Chile? Where are all the certifications of all of these "hottest day ever" assertions?
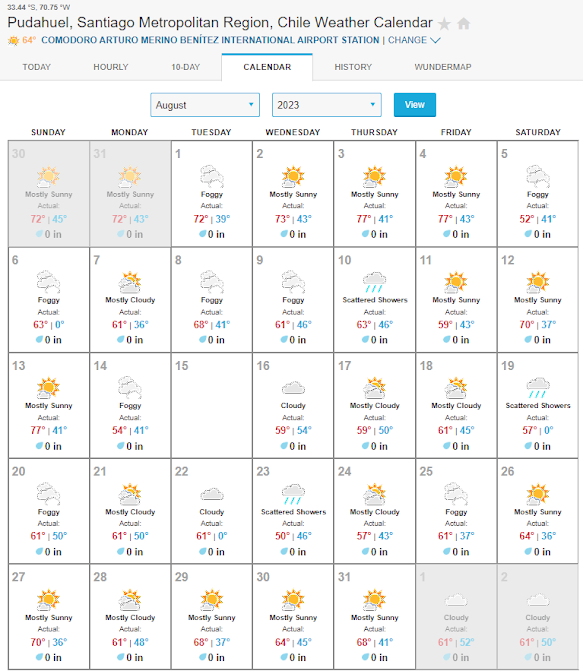
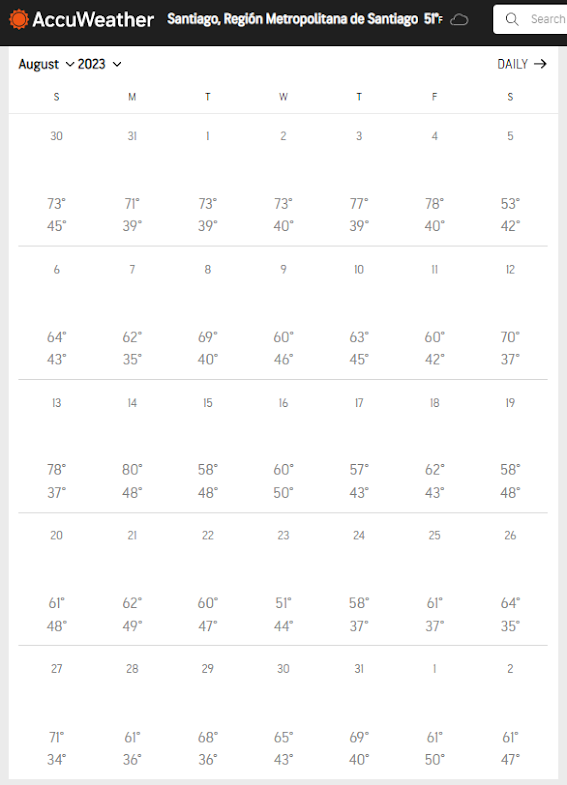
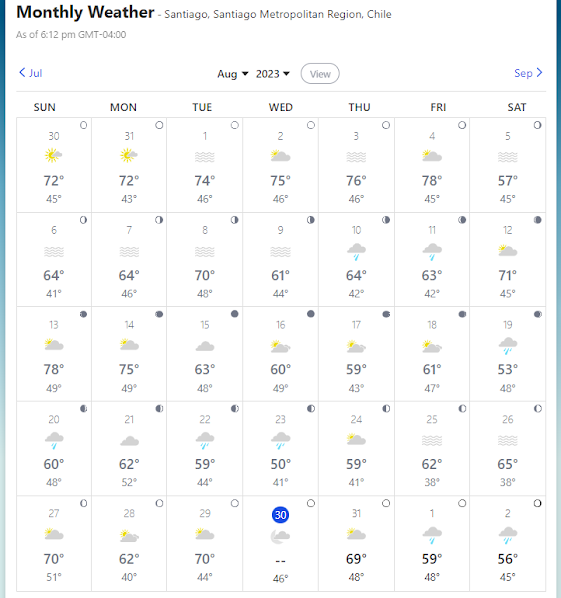
Concerning Santiago's "smog" and "sweltering heat," it was officially reported by meteorological professionals that Santiago was "foggy" ... and NOT smoggy ... on August 1st --- with a 72F to 74F high temperature and a 39F low. Someone lied once again to humanity, in an intentional act to create emotional distress and to maybe get some of that US Congressional funding sent their way.
Immediately below are three reports of Santiago, for August 2023, posted pursuant to the Fair Use Act. One of from the world famous Weather Channel. Another is from the equally known Accuweather. The third one is the reading at the international airport in Santiago. No 100F heat there, folks. No 90F heat there, either. No 82F, 84F, or 86F heat there, as well, concerning August of 2023. The only brutal heat in Santiago was the heat coming out of the engines of the passenger jets there.
Take note as to how low the nighttime temps were in the general and even specific vicinities of Vicuna and Santiago. They were sometimes near the freezing mark.
* * * * * * * *
Below: Now for JULY. Specifically, Santiago in July of 2023, pursuant to the Weather Channel. CNN said it was blazing hot there, in July & August of 2024. CNN lied. There were NO 90F days there; NO 80+ Fahrenheit days, either. Moderate temps only. CNN needs to have its FCC licensing REVOKED.
BELOW: Now for Accuweather's report on Santiago, for July 2023. CNN lied with such audacity that it's FCC licensing should have been revoked. However, the corrupt are in power at present, and the corrupt always keep the equally corrupt in power.
★☆★☆★☆★☆★☆★☆
A town near Santiago would have close to the same temperature as did Santiago. Thus, the nearby town of Puento Alto could confirm if any placee near Santiago was brutally hot. It wasn't. Puento Alto reported 72F as the high temperature on August 1st.
Below: Another two Puente Alto weather reports for the months of July and August 2023. These are two products of the world renown Weather Channel. According to this report, it was 73F or 74F in Puente Alto, on Tuesday, August 1st, 2023. That's NOT sweltering heat.
We begin with the August 2023 calendar, so that you can see immediately that August 1st near Santiago was only in the low 70s Fahrenheit. This is more evidence that the media reporters lie and lie and lie again.
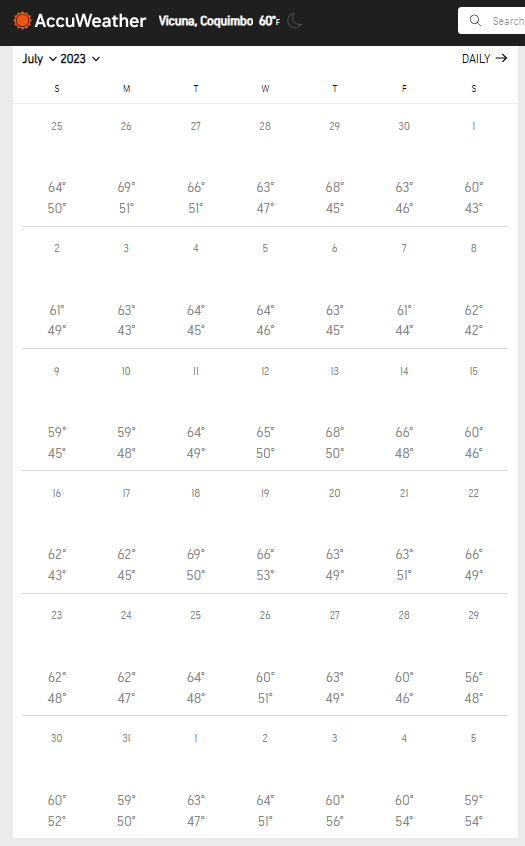
Below here: Take note how mild the July temperatures were, also!!! You need to come to terms with the reality that the modern media lies. Proof is that it never allows climate debates. Media info is rigged info.We next go to Vicuna ... in Chile, below here. Now, the commercial media reported it as having been 99F there, in the middle of wintertime, on Aug 1st, 2023. The reality is that both the world renown Weather Channel and the equally known Accuweather Corporation reported Vicuna as having had a temperature no higher than 63 degrees Fahrenheit, on August 1, 2023. This is more proof that the mainstream media lies to humanity on ... apparently ... a regular basis.
When it comes to discerning the truth about the claim of Vicuna Coquimbo's high temperature as of August 1, 2023, the tale of the tape will be found in [1] the temperatures of the towns surrounding Vicuna, [2] and in the temperatures of the days leading to August 1st, 2023.
BELOW: Accuweather's official record from June25th, 2023 to August 5th, 2023. On July 29th, it was 56F there. That's moderately chilly, for those of you who are used to the metric system. None the less, on July 30th, it was 60F there. On July 31st, it was 59F. This is the weather that compels a person to wear a windbreaker. In the Fahrenheit System. 80F is quite warm. 86F is hot. 95 is quite hot. And 110F is the desert.
All in all, according to the most famous weather networks, CNN lied about South America, in August of 2023. There are a whole list of "climate lies" that have been told, ever since Al Gore received an award for a movie which is an insult to the intelligence of anyone who studied Atmospheric Physics. That movie is a chump change joke of zero educational value.
Below is the weather report for August 1st (2023), only. The report was that Vicuna was only 24C. Now, 24C = 75F. That's 24F lower than what the media reported. In fact, the Weather Channel & Accuweather reports were 36F lower than what the media reported.
Below: Towns relatively close to Vicuna
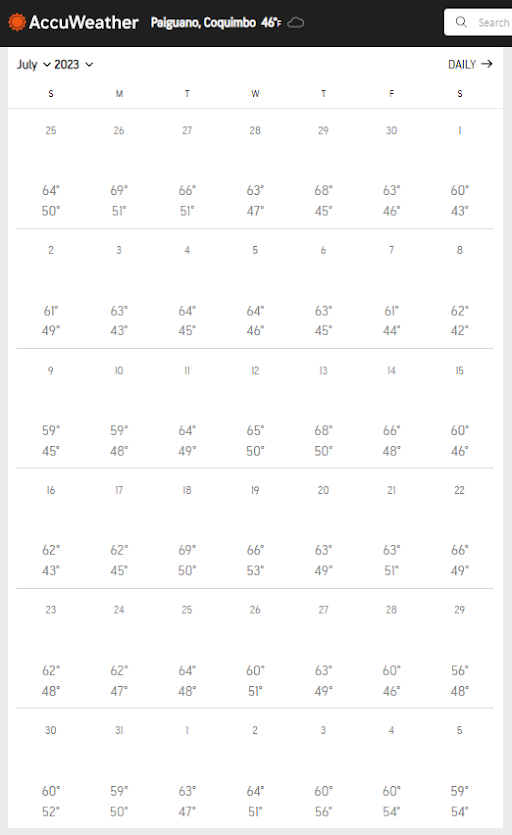
If Vicuna were 99F on August 1st, then nearby towns would have been unusually hot, also. Let's start with PAIGUANO, 11.8 miles away from Vicuna,. Surely two cities less than 12 miles apart from each other would have the same weather and temperatures.
Well, according to well-known Accuweather, on the day when the media reported Vicuna as having reached 99 degrees Fahrenheit, Paiguano's high for that same day was only 63 degrees Fahrenheit (17.2C). In fact, throughout the entire month of July ... and throughout the first five days of August 2023, the temperature at Paiguano did NOT exceed 69F (20.5C) ... according to the same Accuweather meteorological service. That is a 42-day period. Where is this 100F heat that CNN said was out there?
Below is what worldweatheronline reported about Paiguano, for Tuesday August 01, 2023. And it is the same Paiguano which is situated in the Region of Coquimbo, Chile, 12 miles away from Vicuna.
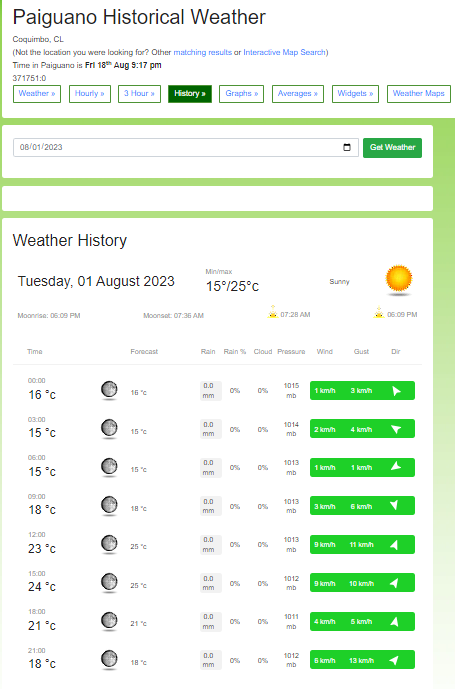 |
| 24C = 75F. That's NOT a heatwave temperature. |
One more temperature record of neighboring Paiguano is below. This one is by the Weather Channel. Where is all of the End-of-the-World heat that the mainstream media reported? According to the world famous Weather Channel, nearby Paiguano was only 63 degrees Fahrenheit, and not anywhere near 99F. Do you yet see how much and how badly today's mainstream media lies? Do you see how some TV networks need to have their FCC licensing revoked?
Below: Let's go next to Ovalle which happens to be 49 miles away from Vicuna. If there were a widespread heatwave, then Ovalle could have reflected this. However, it did not do so.
Ovalle was NOT reported as having had any 90+ Fahrenheit day in July or early August 2023, by any weather website. In fact, it didn't even register an 80F day, between June 25 to August 5, 2023. The Weather Channel reported Ovalle as having had a 71F high temp on Aug 1, 2023.
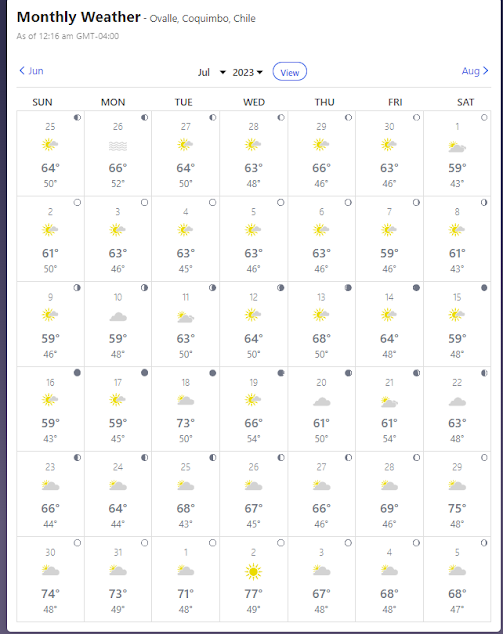 |
| Keep in mind that this is the July 2023 report. This means that the report for Tuesday, August 1 high temp is in the bottom row here. The first five days of August are reported in that row. |
Next comes Accuweather's report on Ovalle, for the First of August, 2023. 63F on August 1st. Now, Ovalle may get visited by true heatwave temperatures next week, but it didn't get visited by searing heat in late July or in early August. The August 1 high temp report is at the bottom row of this calendar, along with the first five days of August. This is because the calendar below is the one for July 2023. It's here, instead of the August 2023 calendar, so that you can see that there was no "global boiling" transacting in Ovalle, during July, leading up to August 1st. As you can see, there was no 100F days there, in July of 2023.
Below: Another town near Vicuna is Pisco Elqui. It's 24 miles from Vicuna. So, if Vicuna had blazing heat, then so too would have nearby Pisco Elqui.
Well, on August 1st, 2023, Pisco Elqui was said to have been only 63F according to the world famous Weather Channel & Accuweather corporation. So, where's all the End-of-the-World heat?
Below: Accuweather reported the exact same temperature for Pisco Elqui as did the Weather Channel. No 100F temps there, and no debate here. Only lies from CNN and similar intruders upon the modern mind exist.
Below: Next is Andacollo Coquimbe. It's approximately 26 miles from Vicuna. The Weather Channel claimed that the August 1, 2023 high temperature there was only 63 degrees Fahrenheit. That amounts to 36 degrees LESS THAN the 99F reported by the mainstream media as having occurred at nearby Vicuna.
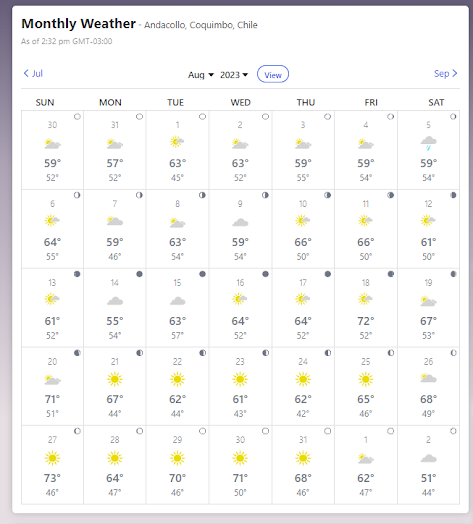
Below: Accuweather concurred with the Weather Channel ... or visa-vera. Andacolla's high for August 1st, 2023 was only 63F. Both mainstream weather services agreed that there was no 80+F day and no 90+F day in Andacollo, from late June to Early August.
Below: Also near Vicuna is La Serena, 35-40 miles away. Now, if you have 99F in one town, then you will have nearly as hot a temperature 40 miles away. The La Serena temp for Aug 1st was 63F, according to the Weather Channel. That amounts to 36 degrees Fahrenheit lower than what was reported by the mainstream media. This is yet another confirmation that the media of today is operated by liars who need to be fired at once.
Below is another weather chart report on the same La Serena, also in calendar form. It concurs with the chart above. Both weather agencies claim that it was 63F in La Serena on the day when nearby Vicuna was supposed to have been 99F. As was previously stated, the extremely famous Carl Sagan designated the measuring rule to be thus: "Extraordinary claims require extraordinary evidence." And of course, CNN and the other climate hysteria networks showed zero evidence to support their over-the-top claims. Concerning CNN mentioning the creation of smog in Santiago, the professional meteorologists mentioned Santiago having --- NOT smog.
Now, the greatest smog disaster ever ... which occurred in Donora Pennsylvania, in 1948 ... occurred due to a thermal inversion in late OCTOBER, when chilly autumn weather was present. In a thermal inversion, the cold temps are at the surface, and the warmer temps are above the cooler temps. To attribute a cloud of hovering smog to a heated day shows that the writer knows nothing about basic atmospheric science, even though he/she presents himself/herself as an expert with a degree of knowledge above and beyond "the little people."
"Smog" is a phrase that was originally used to describe the combination of fog & smoke during the days of heavy European coal use. Heat does NOT cause smog. Photochemical reactions do, and nitrogen oxides are ingredients involved. Classical Smog is basically ground-level ozone (surface-level ozone) that needs cooler temps. Furthermore, when it comes to photochemical smog, sunlight is required for that type of smog to materialize. More weather reports on Santiago are posed here, in addition to the ones above, just to prove that CNN is nothing more than a corporation of liars. who need to be put out of business. This can be done by boycotiing every product advertised on CNN.
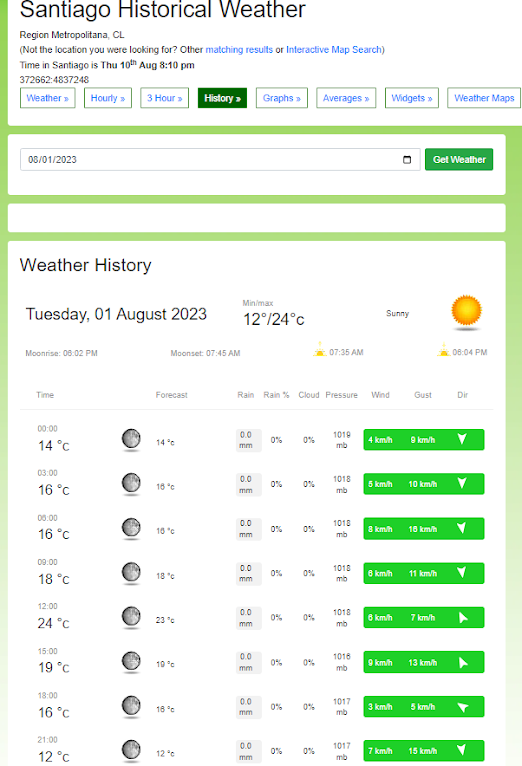 |
| Note: 24C = 75F ... 18C = 64F ... 12C = 53F. |
 |
Above: According the this weather agency, it was only 72F on Tuesday, August 1st, 2023. This proves CNN to have been a liar, in claiming that Santiago was going through never-before-seen "sweltering heat."
Below confirms CNN's dishonesty, too. It was 72F in Santiago on August 1st. No "sweltering heat" was there, contrary to what the liars at CNN stated. And of course, CNN needs to fire every liar.
Now, for Buenos Aires |
The mainstream media specifically mentioned how Buenos Aires got caught in the alleged South American heatwave of 2023 with a heat wave of untold proportions, as well as it reaching into Uruguay in general.
Okay then, for my first trick, ladies & gentlemen of the jury, I will show you a professional temperature report of none other than hot hot Buenos Aires!!! Needless to say, it's posted pursuant to the Fair Use Act. Look for yourself and see ... See how full of crap the modern media and climate activists are. In thirty-six days out of forty-two days there, there were only high temperatures in the 50s & 60s Fahrenheit. This is not any kind of climate crisis for that region at any time.
Below is another professional monthly temperature report about hot hot Buenos Aires, dating from June 26 to Aug 5, 2023. This one is from the world renown Weather Channel. Look for yourself. How many hot were there, in August of 2023?
Below: The city across the river from Buenos Aires. If Buenos Aires were as hot as the media claimed, then the city across the Rio de la Plata would be as hot. That city is Colonia del Sacramento, in Uruguay. In a 42 day period, ranging from June 25 to August 6, 2023, the city across from "hot hot" Buenos Aires had a high in the 50s for 20 of those days, along with a high in the 60s on 15 of those days. Zero days were in the 80s or 90s. So, where is this heatwave the media obsessively reported?
Below: Colonia del Sacramento, Uruguay once again, for confirmational & concurrence purposes.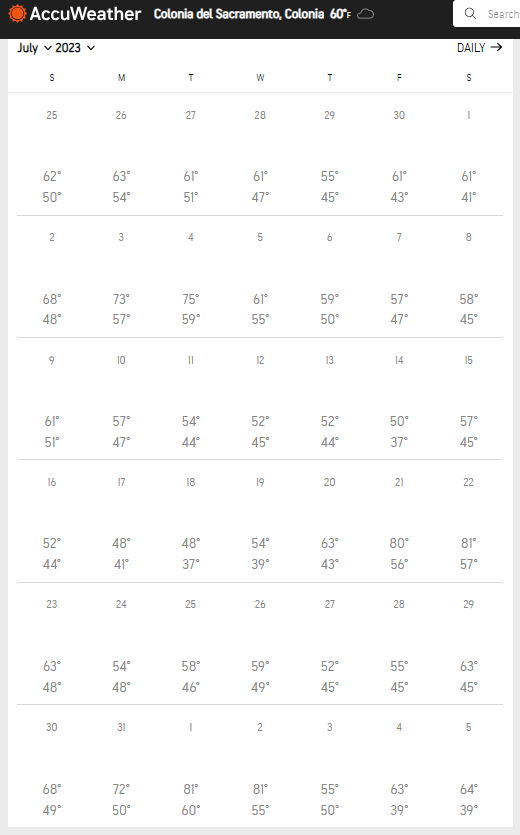 |
| Above: In a 42 day period, 17 days had highs in the 50s, 15 days had highs in the 60s, and even 2 days had highs in the 40s ... Fahrenheit, of course. |
Below: Uruguay most definitely was mentioned in the commercial news reports as having been hit with massive heat this past Winter. Let's next present the July/Aug temps of the largest city there. That is Montevideo. Below are the temps there, as of late June to early August 2023. It shows the South American heatwave report to have been more dishonest than the 2009 Climategate emails. Half of the highs were in the 50s Fahrenheit in Montevideo, and almost a third were in the 60s there. See for yourself, below:
Below is another professional temperature calendar of Montevideo Uruguay, between late June and early August 2023. In as much, where is this highest-temperature-ever South American heatwave?
BTW, cities near the Tropics do NOT count, in claiming "global boiling" heat. This is because the Tropics are the hottest places on Earth, next to valleys at the base of the leeward side of mountain ranges ... and the African Sahara. Thus, high temps are usual for the Tropics. Heatwaves involve heat anomalies.
Let's now go toward the center of Uruguay, to Durazno. Keep in mind that the media claimed that even Uruguay was getting pounded with heat in July and August of 2023. Between June 25th and August 5th, Durazno had four days with highs in the 40s, 18 days with highs in the 50s, and 11 days with highs in the 60s ... Fahrenheit. No 99F days. No 89F days. No 79F days. That's not a climate crisis. That's NOT Global Boiling. Look for yourself:
Now, there was a place in central Argentina which did have an unexpected heatwave of note. That, alone, would have been enough subject matter for the climate hysteria people to have reported. But apparently, the climate folk had to "pour it on" and expand the perimeters of the heatwave, in order to scare you into submission. This was apparently done, so that they will get a handsome share of that multi-billion dollar US congressional "climate funding."
In order to get a large amount of taxpayer-indebted money from the US Congress, you have to deceive people into thinking that the world is coming to an end and it needs you to save it. Keeping people stupid and easily deceived is absolutely necessary for you. CNN works hard to accomplish the task of keeping modern humanity completely stupid and utterly mindless.
None the less, any true heat during July & Aug 2023 can all be attributed to El Nino, and NOT to the burning of fossil fuels. As I illustrated in a previous post, El Nino can also be attributed as the cause of the lack of high velocity Atlantic Hurricanes. El Nino brings wind shear power to the Atlantic. And of course, Hurricane Lee was a prime example of El Nino taming a hurricane.
In as much, climate is extremely intricate. It's not the simpleton version presented by Al Gore to the English-speaking world in 2006. That movie was an insult to one's intelligence. The way of the climate activist is the way of hyper-exaggerating everything so much so that it becomes a ridiculous lie. The climate activists blow everything out of proportion.
Now, 2023 did have a "heat anomaly summer" attached to it. In fact, 2023 had three heat anomaly months in a row. But, it was not more severe than were the heatwave years of ~2012, ~tragic 2003, ~1988-90, ~1980, when Dallas had 42 consecutive days of 100+ Fahrenheit heat, ~tragic 1976, ~the Hurricane Hazel year of 1954, ~searing hot 1934-36, ~the Arctic ice melting years of 1921-22, ~the undertaker overtime year of 1911, ~the grape vine withering year of 1901, etc.
And let us not forgot the heat of 1895-96, when the co2 count was quite low, proving that a rise in co2 is NOT the cause of heatwaves. Additional proof that 2023 was not as bad as the other heatwave years of the past 140 years consists in the fact that you ... your friends ... your family ... your acquaintances ... are still alive.
Plus, 2023 ever-so-coincidentally fits the 11 Year Sunspot Cycle Theory which is still only in "theory status." And concerning this, the high heat does NOT come in tandum with high sunspot activity. Yet, there is a reasonable pattern of note ... with the high temperature years which are subject to the direction of the Equatorial ocean current; if weather it is travelling Eastward or Westward, as in "El Nino" v "La Nina."
Yes, temps are subject to the existence of the Sun. But, the determining factor of temps throughout the Earth is dependent upon the directional flows of the nearest ocean areas. Ocean current directions explains why Ireland basically gets moderate/mild winter and why Southern sectors of Greenland remain ice-free all year round.
Then comes the matter of upwelling and down-welling. The east-west direction of ocean water is not all that matters. The upward & downward directions of ocean water is a determining factor, too.
In review, 2023 was very close to the heatwave year of 2012, eleven years prior ... as in "Eleven Year Cycle." In addition, 2023 also had record cold in the first half of the year, as well as seemingly miraculous water replenishment and snowpack accumulation in the American West. It was a fraud to claim that the American West was undergoing a continued drought in 2023. Moreover, the American West has Monsoon Season.
The "Iceless Arctic" Prediction ... that goes back to 1988 ... and gets recycled continuously
In review, if the Summer of 2023 were the hottest year in the last 125,000 ... or even 7.5 milllion years ... the Arctic Ocean would have been ice-free at the time of this writing.
BELOW: National Snow & Ice Data Ctr / NASA Earth Observatory, as of Aug 11, 2023.
For those of you who are products of the American Public School System, look below and know that you are looking at an official visual report of "a Hell of a lot of ice." Yet, this year has the twelfth lowest amount of sea ice on top of the Arctic Ocean, since the satellite era began. This means that ALL late summer sea ice extent volumes were large. The lowest amount of Arctic ice cover ... in 2012 ... was an area of ice which had a perimeter equal to flying from NYC to Minneapolis to Houston to Miami, and back to New York City. It was also the size of the subcontinent known as India. That is a large chunk of ice, even though it was the smallest chuck in recorded history..
Most importantly is that fact that, even if all of the ice on the Arctic Ocean would suddenly turn into water, the sea level rise would be zero . . . just like when the ice cubes in your iced tea completely melt. No water rises over the top of your glass.
Above: The Arctic as of August 11, 2023. Now, the daily July average ... (actually, the 1981-2010 median) ... of Arctic Ocean ice-melt is 27,000 to 33,606 square miles. The daily Arctic ice loss for July 2023 was 36,000 square miles. Now, that's not the End of the World. Yet, [1] politicians seeking to bring money into their districts, [2] grant-seeking scientists, [3] audible activists, and [4] media personnel hyper-exaggerated this recent 6-months-of-daylight in the Arctic, making it sound like the End of the World.
In review: At the end of August 2023, the Arctic Sea Ice Extent was 2.15 million square miles. That's 19 Arizonas ... or 28 South Dakotas ... or 41 Louisianas ... or even 172 Marylands, when laid side by side, like jigsaw puzzle pieces.
It's no longer a matter of proving the Michael Manns & Al Gores of the era to be wrong. It's a matter of procuring False Claims Act filings in federal civil actions, as well as grand larceny theft-by-deception indictments in federal criminal actions. These people have been inciting violence which is now evidenced by the recent "blessings given" by a climate activist to any of today's youths who will commit terrorism in the name of the climate agenda which basically comprises shutting down society . . . shutting down humanity.
And of course, keep in mind that Al Gore NEVER won a Nobel Prize in Physics (science.) Only the Peace Prize. Meanwhile, the Nobel Prize that Michael Mann claims to have co-won was also NOT the Nobel Prize in Physics (science.) And Mann is not a nice Mann. Peace is not his most viable asset. Disturbing others tremendously is.
Michael Mann should win the Anti-Peace Prize. After all, he is inciting congressional financial irresponsibility and he is inciting violence. He tries to make people feel desperate and to believe that co2 is actually going to make the world come to an end. Well, co2 below 150 ppm will result in the extinction of all species ... starting with plant-life.
At present, according to Hawaii, we are at the 420 ppm range. The Ordovician Ice Age, by the way, occuring when the co2 level was 4,000 ppm ... over nine times higher than today. And the explosion of life throughout the oceans of the Earth occurred during the Cambrian Period, when the atmospheric co2 count was 7,000 ppm. So, there was 7,000 v. 4,000 v. 420.
The opposite of what Al Gore and the Doomsday Sayers claimed about the effects of high co2 occurred. They predicted the disintergration of shell fish. Well, shell fish flourished during the time of the highest count of atmospheric co2 in Planet Earth's atmosphere. Plus, an ice age occurred during a time when the co2 count was NINE times higher than today. You have been taught easily provable falsehoods.
Plus, it would only be proper to revoke from CNN its FCC license, for lying as a matter of habit. After all, its newscasts are propaganda pieces. They are infomercials. Those "reports" are basically "in kind" donations to certain candidates of a certain political party. After all, they are free campaign ads, telling everyone how evil the political opponents are, while stating how just and moral are the politicians benefitting by CNN's completely bogus propaganda pieces.
Procuring the highest extent of punishment allowed by civilized society upon climate con artists engulfed in a racket is needed. These con artists have gone beyond the Sound Barriers of Obscenity. They will be coming for your tax money ... your natural gas stove and your natural gas furnace ... and let us not forgot your grocery merchandise in your refrigerator.


