|
| In adiabatic heating scenarios, the clouds stay on one side of the mountain range. |
a1a}
That which is called the result of "global warming" is actually the
result of Adiabatic Heating which occurs on the the Leeward Side of
mountain ranges. This is because, as clouds rise
up the Windward Side of a mountain range, they
release moisture during the ascent. This is known as the process of
Orographic Lifting.
a1b} This lifting of a cloud mass accompanies the
release of "orographic rain" as the clouds' ascent continues. By the time the same
air mass reaches the top, all that is left is a cold & dry parcel of
air which descends the mountain range and compresses upon its descent, thereby sending forth dry & heated air. The creates deserts, such as California's Death Valley.
b}
The dry air parcels which descend mountain tops are called ::: ~Foehn
Winds, ~Chinook Winds, ~Santa Ana Winds, & ~Down-sloping Winds.
As a dry air parcel descends a mountaintop, it encounters higher &
heavier pressured air which easily exists at the surface of the Earth.
As a result, the down-sloping air compresses and shrinks in size. This
causes the molecules within it to collide and vibrate more aggressively,
resulting in a sudden rise in temperature.
c1a}
Proof that this dryness is the result of Adiabatic Warming, and NOT
co2-driven Global Warming, exists in the fact that, when you are out
West, you notice that the clouds in the sky never cross over the
mountain tops. The clouds stay on one side.
c1b}
Incidentally, I'm the son of a native Wyoming gal. In fact, I have
literally been at the southernmost tip of the Rocky Mountains, in New
Mexico. I witnessed it personally. I was there.
At
this point it would suffice to state that the vast majority of Climate
Change activists need to do something called, "go outside," and not
merely to the park. People who worked in the outdoors hour after hour
and year after year have a more clear understanding of weather behavior,
simply by means of decades of experience. Back to the matter hand:
c2}
Examples of deserts created by Adiabatic Heating also inlcude the Red Desert
of Wyoming, in the center south of the State. Plus, the center of
Oregon has a desert located east of the Cascades and south of the Blue
Mountains. The Leeward Side of California is desert land
extraordinaire, and it was that condition long before 21st Century co2
levels increased. Etc go the examples.
c3}
Plus, the super large deserts of the Earth are all on the 30th parallel
(north & south) wherever the desert was not the result of Leeward
Adiabatic Warming. 30th Parallel deserts were caused by very large
"convection cells."
Example
===> The Sahara Desert is the size of the USA, and 6,000 years ago
the Sahara was a lush forest/jungle, with cave wall drawings that looked
like the ones in France. This time span is known as the African Humid
Period. There were no gasoline engines to turn the Sahara into a
desert. It was a major convection cell at the 30th Parallel that caused
it. The super large convection cell still exists. It's presently called the Hadley Cell of the Northern Hemisphere.
When viewing Globes or maps, do not forget the 23.5 degree tilt (aka obliquity) of the Earth.
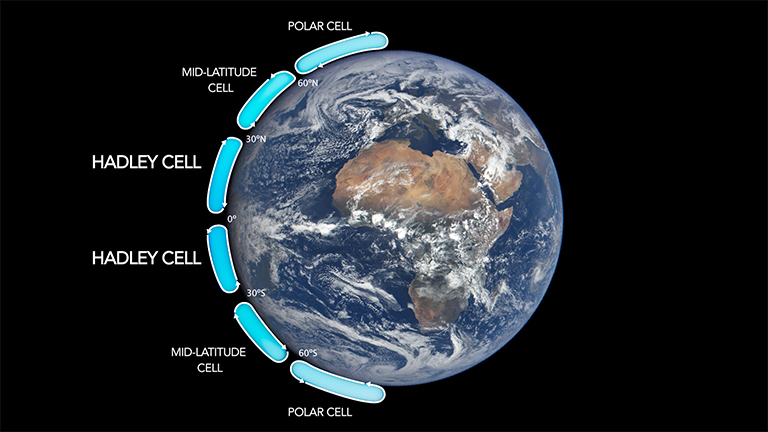 |
The geometry of the vast Sahara region and the northern hemispheric Hadley Cell.
|
And
then there is the alternating of directional ocean flow between El Nino
& La Nina ocean oscillations, at the Equator. This is when ocean
water does NOT travel like a rotating gyroscope, but rather, the
current-flow travels west to east to eventually west again, etc. The El
Nino & La Nino equatorial currents travel between Longitudes 120E
& 80W, and it has had a huge effect on American and Australian
weather.
An
El Nino event is one that starts during late December and endures for
approximately four years (from 2 - 7 yrs, actually). It was named after
the Christ Child, and it is associated with heat in the American
Continent. La Nina is the eventual counteraction of those equatorial
ocean currents, and it is associated with colder than usual temperatures
on the American Continent. The Year 1998 was an El Nino Year. It was
associated with a warm American Winter which frightened everyone who had
no experience in atmospheric science. Yet, it was pleasurable. It was
the Winter of little shivering.
The El Nino Southern Oscillation is abbreviated ENSO.
At
this point, it is important to note that, throughout the rest of the
Earth, the ocean surfaces are composed of massive GYRES which rotate
like gigantic gyroscopes. This is why ocean waves crash into the
shoreline at an angle, instead of doing so in a straight line. This
angular wave motion is one of many proofs that the Earth is round, and
it involves something known as the Coriolis Effect which you can look-up at your convenience.
The Coriolis Effect also involves something known as Eckman Transport
which can refute one of Al Gore's paranoiac claims about climate doom
in the northern part of the Atlantic Ocean. Gore and his team claimed
that fresh-water ice from Greenland will progressively melt into the
Atlantic, thereby lessening the ocean's salt content, and thereby
causing the ocean to stop circulating and to cause an Ice Age in
England. Well, if such a melting scenario were possible, it would only
result in suppression of ocean down-welling and upwelling. In order to
get the oceans to stop moving, you need to stop the rotation of the
Earth and you need to stop the formation of wind.
Incidentally,
if you want to identify a climate fraud, simply ask that person this:
"What is the definition of wind?" The fraud won't know the answer.
Wind is high pressure air traveling toward low pressure air ... denser
air making a route to empty itself into air with less compacted air
parcels. It's high pressure gravitating toward low pressure. You can
even effectively define wind as high pressure air chasing low pressure
air. The concept is understood as such.
Upwelling
involves the providing of nutrients to sea life which abides in the
Euphotic Zone. Concerning this, nature apparently has within it
compensatory features throughout the Earth. Nature apparently has a
Plan B, when upwelling is mitigated or halted. This is because a
certain food source unexpectedly super-multipled as of recently, and
such a thing will prevent any environmental oceanic crisis caused by the
blocking of upwelling. It's called coccolithophore phytoplankton. In
fact, there is an area in the Gulf of Mexico which used to be called the
Dead Zone, due to the negligent draining of residual industrial
fertilizer there, via the Mississippi River. It's back to life now, and
a major presence there is the coccolithophore phytoplankton.
Concerning the effort to understand ocean down-welling, it is needed to look-up Pycnocline.
This
discourse also omits mention of Sublimation and Deposition.
Sublimation is when ice turns into vapor without going through the
melted liquid stage. Deposition is when vapor suddenly turns into
ice.
Two
points to make about sublimation, before we move on: A sign that
sublimation has occurred is that the ice is jagged. When ice is
partially jagged and only partially smoothed-out, that's the result of
partial sublimation, needless to say.
The
greatest example of sublimation is at the top of the Himalaya
Mountains. The greatest example of partial sublimation is seen on the
walls of calving ice. Contrary to mainstream media's explanation
thereof, calving ice is NOT the result of melting ice. Melting ice
simply recedes. It does not perform a grand dive into the ocean.
Calving is the result of an increase of snow toward the center of a
landmass, pushing out the snow at the shorelines. Yes, calving is the
sign of increased snow, while calving ice walls are partially jagged and
partially smoothed-out.
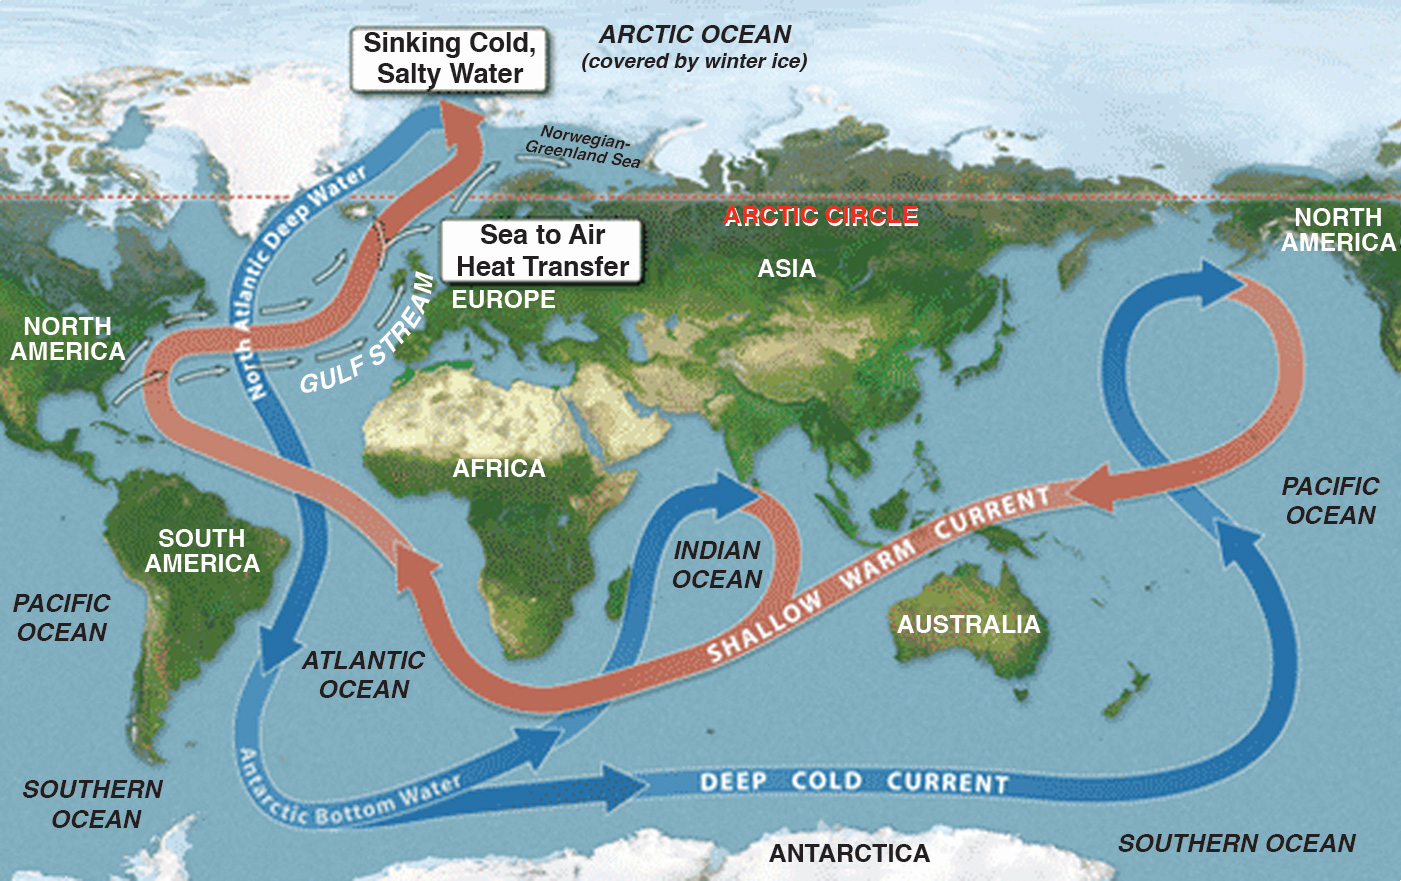
Concerning the Thermohaline Circulation which is not to be confused with the Thermocline
An
activist giving a speech might simultaneously show a world map
projection marked with a colorful band/line traveling through the Indian
and Atlantic Oceans. It looks like a ribbon. This can deceive the
untrained public into assuming that the water motion symbolized by the
ribbon is located at the surface of the Atlantic and Indian Oceans.
Well, the previously mentioned gigantic OCEAN GYRES are what exist at
the surface of the oceans. In fact, the massive gyre in the American
side of the Atlantic ocean is called the Sargasso Sea. Al Gore is not a
good teacher, in his withholding too many facts.
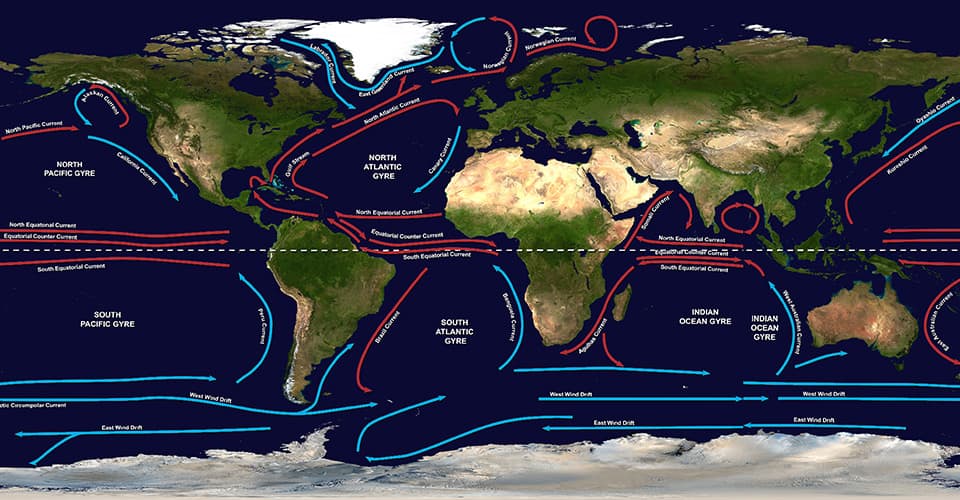 |
From the United States National Ocean Service --- (the NOS)
|
Being
that ocean gyres are important in understanding how much of a fraud the
Al Gore people have been, one needs to understand the Coriolis Effect.
This involves the rotation and tilt of the Earth (aka the Earth's
"obliquity"). Firstly, the Earth presently tilts at 23.5 degree slant.
Secondly, the Earth is revolving around the sun at 66,660 miles per
hour. At the Equator it rotates around itself at 1,037 miles per hour.
Moreover, the Earth's Rotation Speed at various latitudes go as
follows, in miles per hour (mph) :::
10 degrees: 1021mph 20 deg: 975mph 30 deg: 898mph 40 deg: 795mph
50 degrees: 667mph 60 deg: 519mph 70 deg: 355mph 80 deg: 180mph
~~~~~~~~~~~~~~~~~~~~~~~~~~~~~~~~~~~~~~~~~~~~~~~~~
Now,
keep in mind also that the warmest latitude on Earth is NOT always the
Equator. The warmest latitude is the Summertime Tropic, at 23.5
degrees, if a Summertime is in progress, as opposed to an Autumn or
Springtime.
Spring vs Autumn CO2 Levels
Speaking
of Springtime, Al Gore stated in his first science fiction movie that,
during Springtime, co2 is abundant, and during autumn's harvest season,
co2 levels in the atmosphere are low. The truth is that the difference
between the Springtime level of co2 and the Autumn level is no more than
2%. It's merely a 2% difference. Again, Gore was a terrible teacher.
Heat's Entrance & Exit Rates at the Earth's Various Latitudes
It
would also have helped for someone to have admitted that, 24 hours a
day, 7 days a week, the following occurs ===> From the 40th parallel
of both hemispheres to the poles of both hemispheres, more heat exits
Planet Earth's atmosphere into outer space than enters Earth's
atmosphere from outer space. The Earth's only viable source of heat is
the Sun, and the Earth's storehouse of heat mostly exists from Latitude
40 degrees N to Latitude 40 degrees S ... or visa-versa.
Two
more things, regarding this ::: 1} The Earth is FARTHEST from the Sun
during the Northern Hemisphere's Summer and the Southern Hemisphere's
Winter. 2} The Earth spins from West to East.
Their Failed Doomsday Predictions & Hypocrisy
The
Global Warmists failed in ALL of their doomsday predictions, mostly
made circa 1988. All of the predicted climate doom was supposed to have
been complete by 2018-2020. In fact, during this present time span,
when the media obsessively barks out "Climate Change," Antarctica
recently had it coldest day in recorded history, so recorded by
satellite technology ::: a MINUS 135.7.
Furthermore,
in 2021, the same Antarctica had its coldest six-month period on
record. Even the prejudiced & slanted CNN reported that fact. BTW,
this Antarctic six month period is more commonly known as WINTER.
Also in 2021,from Feb 7 to Feb 20, 9,027 cold temperature records in America were either tied or broken. That's a
sure sign that the phenomenon of NOT-Global-Warming is occurring
throughout the Earth. The temperature gets evened-out in such
scenarios.
Let us review a samples of failed Climate Change predictions :::
~The
Maldives were predicted to be underwater by 2018. In 2022, the
Maldives are alive and well, with financially affluent human life
there.
~
The glaciers of Glacier National park were supposed to be gone by 2020.
Actually, there were originally predicted to have been gone by 1948.
They are still there, and a lot of snowplowing goes on at Glacier
National in April, May, and even June, to make the tourist roads
clear.
~And
of course, the Arctic Ocean's sea ice didn't completely or even almost
melt away in any Summer since the 1988, or in any Summer since 1388.
However, in 1904 was the sailing of the Northwest Passage, slightly
north of Alaska and the such.
The
least amount of sea ice in the Arctic Ocean was during the Summer of
2012. The remaining ice there was still 1.32 million square miles in
size. In fact, to travel over the Arctic Ocean's 2012 Summertime sea
ice sheet was equivalent to driving from Fargo North Dakota to San Diego
California, as well as driving from the Southern border of New Mexico
to the northern border of Montana. That is a lot of road travel. That
is a lot of Summertime ice. Etc go the examples of failed doomsday
prophecies.
There turned out to be a great irony in the Climate Doomsayers having selected of the
Year 2020 as the predicted year of completed melting. It goes as follows: In the
month of May 2020, North American towns & cities underwent 233 record low
temperatures vs a mere 18 record highs for the same month.
See and hear: 233 record lows in month of May 2020
In
fact: Antarctica's massive Ross Ice Shelf (the size of Spain) was
found to be crystalizing at its bottom, instead of melting in any degree
thereof. This was discovered by New Zealand scientists, and it was a decisive discovery:
See: The Crystalizing of the Ross Shelf
Incidentally,
the Arctic Ocean is the exact same size as is the Antarctic Continent;
5.5 million sq miles. One more thing ::: The largest and driest desert
on Planet Earth is not the Sahara. It's Antarctica.
BTW, Barack Obama
purchased an oceanside mansion located at Massachusetts' Martha's
Vineyard. The president who claimed that ocean levels would tragically
rise is literally at an ocean's shoreline, living in luxury. And Obama
cannot claim that he solved any co2-driven Global Warming problem,
because co2 levels rose throughout Obama's presidency and throughout
every year after his presidency. None the less, during the final years
of his tenure, co2 emissions in America did decline. But, it had no
worldwide effect. CO2 emissions in the United States also declined
during the tenure of President Donald Trump.
In sequence, Hypocrite Extraordinaire, John Kerry,
purchased an $11.75 million beachfront mansion which is also in
Martha's Vineyard. It's within walking distance of the ocean
shoreline. In fact, Kerry owns 18 acres of land there. The logical
surmise is that Mr. I'm-Leaving-on-a-Jet-Plane apparently has no belief that the oceans will rise and cause 18 acres of beachfront property to be submerged.
In 2020, Bill and Melinda Gates
spent $43 million on an oceanfront mansion in Del Mar California, doing
so the year prior to them parting company and going their separate ways
as much as is possible for billionaires in charge of a charity
organization. Yet, Bill Gates repeatedly warns of sea level rise and
the eventual submerging of shoreline property. He spent $43 million on
shoreline property.
In the 1970s, there were warnings of Global Cooling and an oncoming Ice Age.
The
Climate Doomsday Forecasts of the 1970s involved the conjecture that a
mini ice age might be returning. The '70s involved the "decline"
mentioned in the infamous Climategate emails of 2009. Very simply, it
got really cold back then, and this was only 120 years after the last
mini ice age ended. Refer to newspaper and magazine archives, to prove
that articles were being written on the decline of temperatures
throughout the 1960s & 1970s. I was there, as a young child and
then as a teenager. It was cold in the Wintertime. It was really cold.
Then
came the Global Warming Scare, on June 23, 1988, with James Hansen in
front of the US Senate Committee on Energy & Natural Resources. The
kick-off of Climate Doomsday was being announced by Hansen, such as in
his prediction that the Maldives would be underwater within 30 years (by
2018). Of course, that never happened in any degree.
Moreover,
Hansen ... and others ... have taken raw climate data and changed it,
and in having done so, they ever so coincidentally fitted the "newly
amended" climate record to their co2 warming assertions. They adjusted
the numbers to fit the story line. Doing the numerical changes was
called "homogenization" by those changing the temperatures. Others
called it fraud. Speaking of government employees committing fraud,
watch the following:
See: NOAA Gold Medalist accuses NOAA of deliberate temperature record keeping fraud
All
in all, none of Hansen's predictions have come true. Now, in a 2007
deposition, with Hansen being an expert witness in the case, he
"averred" (claimed) that most of the Greenland Ice Sheet will have
melted by 2107, and that the sea level rise will have amounted to 23
feet. No such melting at the rate predicted is occurring yet. At
present, the Greenland Ice Sheet is at a range of 6,600 to 9,800 feet
high.
 |
The Earth's climate has been a cyclical roller coaster ride throughout its history.
|
If
you want evidence that today's scientists are lying about the 21st
Century being the hottest and the one most visited by weather disasters,
go to the newspapers archives of 1871, 1878, 1896, 1901, 1906, 1911,
1921, 1922, 1934, 1936, 1954, etc. In fact, go to the 1970s archives,
where an oncoming ice age was the predicted event. You will find that
climate catastrophes were much more intense and more frequent in the
past 80-150 years than they are today. The blame for the climate
disasters was originally Solar activity, or the lack thereof. That
which was blamed for those weather disasters of the 1970s was ====>
Global COOLING.
None the less, if you want to learn about true atmospheric science, purchase a private pilot training course's textbook on Weather Theory.
Hockey Stick Time
If
you are a youth who was enrolled in the American public school system,
you were probably shown Michael Mann's "Hockey Stick Graph," without
being shown any data to back up his claim of a sudden rise in global
temperatures. Well, he allegedly mixed apples with oranges in the following way ===>
He allegedly
first used tree ring data which actually tells the amount of moisture
in the atmosphere at the time surveyed, and NOT the temperature, per
se. None the less, those tree rings did indicate a decline in moisture
(and presumably temps) from approximately 1960 to 1974. So, Mann allegedly stopped using the tree ring data at 1960 and allegedly
substituted it with thermometer data, doing so without justifying any
"benchmark" of the tree ring data to any thermometer scale. To make a
long story short, the 2009 East Anglia Climategate Emails mentioned
Michael "hiding the decline." Specifically, the decline of temperatures
between approximately or exactly 1960 and 1974 is what was hidden.
First see: The late Michael Crichton on Michael Mann's Hockey Stick Graph
This
paragraph involves the illustration located five paragraphs away: A
number of tree ring scores/tallies were available to Mann. Predictably
enough, he ALLEGEDLY ignored all of them EXCEPT the one with a
pronounced incline, when he was morally obligated to submit as fact the
average of all of the tree ring samples combined. Look at the tree ring
sample YAD061. It looks like a ski slope in comparison to the nine
other ones. That is what he ALLEGEDLY used for his very exaggerated
hockey stick graph, in addition to him using other pieces of proxy data.
Now,
in the background of Mann's hockey stick graph is the jagged "bar of
uncertainty" or "error bar." That's a line that represents what the
correct temperatures might possibly be, in lesser statistical
probability thereof. Well, if you look at the top of Mann's jagged
Error Bar at the left-hand side, you are looking at the Medieval Warm
Period. And if you look at the bottom center-right of the jagged "error
bar," you will see the Mini-Ice-Age of 1350 to 1850. Mann included
both climate periods. He simply hid them in the background, while
denying their existence in his speeches. An image of the hockey stick
graph is not included herein. False graphs & erroneous charts are
not permitted to be posted here.
In
definitive terms, is it a complete FALSEHOOD to claim that the
temperatures of the last 1,000 years were mostly stable. It's an equal
falsehood to claim that the climate of the last 1,000 years was mostly
mild and unvaried throughout that time span. There were intensely
turbulent times, and there were distinctively different climate phases
throughout the past 1,000 years. Climate is and has been a roller
coaster ride. Incidentally, the coldest part of the Mini Ice Age was
between 1645 and 1710. Sunspot activity was at its lowest, back then.
In
recent years, Michael "Hockey Sticks" Mann filed a lawsuit against a
retired Canadian meteorology professor who was once a Royal Air Force
pilot. The aging Canadian man said that Michael Mann belonged in a
prison, so Mann sued the retired professor for defamation, in a Canadian
court.
Eventually,
Mann sought to have the lawsuit dismissed. In order to agree to the
dismissal of the lawsuit, the Canadian defendant promised to let the
lawsuit end, on the condition that Mann show him the data that resulted
in the hockey stick graph's drastic upward curve. Mann never revealed
the data to the Canadian gentleman. None the less, how much apparent or
pernicious fraud was committed by Mann when he was allegedly using the
other alleged proxies for his hockey stick graph?
Anyway, observe Sample YAD061 below, and know that Mann allegedly
used 112 "proxies" in all, for his hockey stick graph. Incidentally, a
proxy is replacement evidence for natural phenomenon. The prime
example is the tree rings which are used to determine temperature at a
certain time in history. 
The Al Gore Science Fiction Movie #1
Concerning
the co2 & temperature graph that Al Gore showed the audience at the
beginning of his first movie, he neglected to say that a rise in
atmospheric heat will cause an added amount of co2 to be released into
the atmosphere via oceanic evaporation. In fact, it's a well
established scientific teaching that the water vapor above the oceans is
latent heat.
Now,
a prime example of this phenomenon, where the rise in co2 follows the
rise in heat is in a recent research finding about the end of the last
Major Ice Age (aka "the last glaciation.") It was found that the
heating at the end of the last Ice Age actually began at the bottom of
the oceans, with the heat rising to the ocean surfaces. The time it
took for the heat to rise to the top of the oceans was 1,300 years,
according to the paper's authors/researchers. Then, and only then did
co2 levels begin to rise. Therefore, in the natural history of the
Earth's most recent 650,000 years (or "time units"), temperatures always
rose first, and then the co2 levels followed. The changes in co2
levels throughout that time were not at all pronounced, compared prior
eons of time. They were relatively small changes.
See: Univ of Southern Cal: CO2 did not end last Ice Age
A British Court Had Its Say About Gore's First Science Fiction Movie
In
that first Gore movie, there were 9 assertions contested to be
falsehoods in a British court. The British court ended up adjudging
that the Al Gore movie could not be presented or advertised as
educational material in England. One of the assertions was that a rise
in co2 levels caused Lake Chad to dry out. Super fraudulent was that
assertion. Observe ===>
Dispelling the Lie that Al Gore Told About Lake Chad, in His First Science Fiction Movie
Lake
Chad is located directly below the massive Sahara Desert. Thus, Lake
Chad has very little ground water or water shed "tributaries." The
Sahara doesn't provide much rain, either. Furthermore, Lake Chad is a
shallow lake, and its water capacity is much smaller than Lakes
Tanganyika and Lake Victoria. Observe:
Lake
Chad's water volume capacity is 17 cu mi ... vs Lake Tanganyika's
4,500 cu mi capacity ... vs Lake Victoria's 660 cu mi capacity. This
means that Lake Tanganyika's water capacity is 264 times greater than
Lake Chad. Lake Victoria's water holding capacity is 38 times more than
is Lake Chad.
Moreover,
it was only the northern lobe of Lake Chad which dried-out in intervals
of time throughout the 1970s and 1980s; not the entire lake. Do
you see what a liar Al Gore has been, while he was amassing
approximately $250-350 million into his own bank accounts and/or financial portfolio?
One
more point about Gore's first science fiction movie is this ::: It
involves Gore's claim that atmospheric co2 first rose, followed by
temperatures. Well, if that is the case, then what caused those co2
levels to rise, in the first place? There were no coal plants, no
factories, and no combustible engines. Hello? Anybody home? To claim
what Gore claimed is equivalent to claiming that a steering moves the
driver's hands.
More on Gore
In
his second movie, Al Gore claimed that his prophecy about (Lower)
Manhattan being submerged under water came true. He showed a video clip
of the very temporary storm surge of a certain tropical storm. After
the storm surge ended, no Manhattan concrete was underwater. Go to NYC
today and see for yourself, if whether or not sea level rise has
encroached itself on Lower Manhattan's roads and sidewalks.
Deception through the Help of the Media
Now,
Hockey Stick Graph Maker, Michael Mann, told a newscaster that today's
co2 levels must be cut in half within ten years. Well, if that's done,
the Earth's atmospheric co2 level will even be lower than it was when
cavemen (or cavewomen) were giving art exhibitions at their cave
walls.
Caveman
co2 levels were at 260 ppm. By the Year 1800 or so, the co2 level was
at 280 ppm. Mann is prescribing a level of 209 ppm. In as much, this
indicates (in my opinion) that Mann is deliberately marketing fear, in
order to get all the more taxpayer dollars & NGO grant dollars into
his bank accounts and financial portfolio. It's called Theft by
Deception. This is what the US Federal False Claims Act was enacted to
undo. And upon me stating this, I advise you to keep in mind the Times vs Sullivan First Amendment Case, where it was adjudicated that a private citizen may publish his opinions of a public figure.
If
atmospheric co2 levels drop below 150 ppm, no photosynthesis could
transpire, and plant life dies. Plus, we have a heightened population
today, meaning that we need greater crop yields. Thus, we need more
plant food. In as much, CO2 is the plant food needed in higher levels
today. So, what is Mann thinking? All in all, if you want to go green,
you must increase co2 levels.
Incidentally,
the billions of taxpayer dollars that were unleashed were unleashed
under the title, Climate Change Adaptation and Climate Change Research.
Going by memory, $112 BILLION taxpayer dollars per year were spent on
so-called Climate Change Adaption & Research, during the final two
years of the Obama administration. Moreover ====>
In
the Climategate Emails of 2009, it was discovered why the title "Global
Warming" was changed to "Climate Change." This is because there had
been NO Global Temperature increase in ten years. Being that there was
no global warming, the scientists had to change the name of their
project, in order to deceive you and everyone else all the more.
As
a fact, if there is no increase of temperature in the Middle of the
Troposphere, there is no Global Warming. There was zero increase of
such temperatures from 1999 until 2016. Somewhere within the same
general time span, the United States went 12 consecutive years without a
major hurricane making landfall on any of its shores. Thus, the
opposite of Al Gore's hurricane predictions resulted.
 |
The majority of water content in every ocean exists at 39 degrees Fahrenheit.
|
As
far as goes the atmospheres on Venus and Mars being almost entirely
composed of co2, it simply proves that there is no life on those
planets. Life dines on co2.
The
most important thing to do at present is to go through newspaper
archives of the past 80 to 150 years, and locate reports on the heat
waves, fires, record rains, floods, hurricanes and other natural
disasters which occurred during that time. It was a time when co2
levels were distinctively lower than today. Locate and read the
November 1922 edition of Monthly Weather Review, wherever you can
find it. All of the aforementioned becomes the evidence which proves
Climate Change activism to be a fraud. It's all a money grab for
taxpayer dollars ... and NGO dollars.
Next
go through 1970s newspaper and magazine articles that spoke of a coming
mini-ice age. Yes, even though co2 levels had risen, the 1960s &
1970s were times of a lot of painfully cold weather. Thus, the 1960s
& 1970s proved invalid and fraudulent the claim of Al Gore, John
Kerry, & company
Arctic
Ice volume reached it height in 1979. This is why Global Warmists omit
the ice volume facts of the 1970s, even though there was satellite
technology dating back to approximately 1974 or even sooner. They
simply begin their charting in 1979, the year of the highest amount of
ice, so that the succeeding years will be made it look as if the world
is now melting away like never before.
They omit the 1970s Arctic Ice Volume statistics as much as they omit the 1920s & 1930s forest fire stats If
they let you know that ice volume rose while co2 rose, then the Al Gore
CO2 Warming Model of Science is defunct, invalidated, and found to be
historically false.
In
addition, you will find the stumps of rooted trees near the Arctic
Ocean. Moreover, Iron Age skis were found under permafrost that had
melted. This means that there was a time when there was no permafrost
there. Climate is cyclical.
So,
go to the newspaper & magazine archives. You will discover how
much you are being deceived on a major, expensive, and immoral scale.
To
you Climate Doomsayer computer modelers out there, in order for you to
have a clear insight of climate, you need to do something called, "Go
outside."