March 25, 2025

Atmospheric Methane is less than 2 parts per million, and the microbes Bill Gates wants you to eat make the methane via co-enzyme M.

 Quick Note:  Being that there is an era known as the Antique Little Ice Age and a different one called, the "Little Ice Age," a novice could get confused between the two distinctly different eras of Earth history.  Therefore, at the Blue Marble Album, the Little Ice Age has been called the Mini Ice Age.  Well, if there are to come anymore posts on Atmospheric Science here, the "Little Ice Age" will be referred to as the Renaissance & Baroque Era Ice Age ... or something similar, solely for the sake of differentiation.  In addition, the 124 year period of sheer cold, known as the Antique Little Ice Age will be referred to as the Justinian Era Ice Age or the 536AD Ice Age.  This will also be done for the sake of differentiation.  Okay then, my fellow seekers of Truth, let us proceed.

The Methane (CH4) Scare is the Most Absurd of the Doomsday Climate Claims

Methane only exists in the Earth's Troposphere at 1.909 parts per million; 0.00019% of the atmosphere.  Therefore, methane is NOT a factor in Global Warming in any capacity, even though a methane molecule has 28 times more IR heat retaining capacity than does a co2 molecule, and even though its presence in the Troposphere doubled in the past 122 years or so.  There is simply not enough methane in the atmosphere for you to worry.  

Now, between the Year 2000 and 2007, the level of atmospheric methane stabilized. Then came an increase.  Even at that, the increases of recent years --- or in any year --- were only in the parts-per-BILLION echelon.  None the less, the year of the most ppb methane emissions, ironically enough, was the year of commerce shutdown ... the year of industrial layoffs ... the year of quarantine ... the Year 2020.  How did that happen?  Even at that, it was only a minute increase.

Ironically, methane comprises 70% or more of the composition of natural gas which is a clean burning fuel.  Methane has a 92% efficiency rate, while coal's is 32%.   Yet, clean burning natural gas has been demonized.

Methane's danger is proximate to (close to) coal miners, ironically enough.  There keeps coming reports that methane emissions from coal mines have been higher than previously assumed. That's a conversation for another time, as is also the by-product of coal, namely fly ash --- aka flue ash.

Now, methane is a paraffin hydrocarbon, aka an Alkane.  So, what is the irony to targeting methane as a carrier of "carbon footprints?"

ANS:  Paraffins contain LESS than 5 carbon atoms per molecule.  Benzene is 6 carbons in a closed chain.  This makes a methane molecule gaseous at room temperature.  This also makes such a molecule "immiscible with water."   This means that it won't mix with water and make a new substance.  This also means that methane will not meander in ocean water for decades, etc.  Therefore, if you hear another nerdy, dorky, dweebo scientist claim that methane is hiding in the oceans, ignore him and move on.

This than-less-5-carbon-atom feature explains why the methane which does emerge from the oceans in relatively minute amounts emerges predominately from the oceans' shallow coastal waters.  Concerning this:

There is the matter of clathrate deposits within the sea floor, 300+ feet buried within it, but at the ocean floors close to coastlines.  These actually are crystallized forms of methane mixed with water ... but under the ocean --- and not in the ocean water.  They're described as "cage-like" structures that house methane.   

The identifying mark of these embedded deposits are mounds at the sea floor.   So, is there a connection between the clathrate deposits and the methane that does emit from the oceans' coastal areas?  Or is this merely a coincidence.  

There is no readily identifiable source of coastal methane that does rise from the ocean, in small quantities thereof.  The question of science today is, "From where does the coastal methane come?"  Science does NOT have all the answers ... or even half the answers ... to anything.  Science is run by very imperfect humans who do not have x-ray vision.

Now, the assumption is that, if these methane deposits get released, a lot of methane will jet into the atmosphere.   However, these methane molecules are literally caged, and in a solid form.  If they want to rise from the ocean's surface, they need to call United Airlines or American Airlines.  None the less, uncaged (gaseous) methane will not mix with water.  It will simply jet out of the water, if unearthed from the ocean floor.

Methane Sources

Methane is made by microbes, via methyl-coenzyme M which acts upon methyl group molecules.  A methyl group molecule has three hydrogen atoms bonded to one carbon atom.  A fourth hydrogen atom is needed to construct methane.  

Well, methyl-coenzyme M bunches the three hydrogen atoms onto the spot of the enzyme where a nickle atom is located.  Nickle then bonds with sulfur and it sends the methyl group off without a needed electron.  The methyl group instinctively and immediately snatches a fourth hydrogen atom (much like a magician pulling a rabbit out of a hat.)  Thus, methane is made.

Bill Gates wants you to stop consuming meat and poultry, because, according to him, such a thing causes tremendous elevations of methane in the atmosphere.  So, he literally want you to eat microbe sandwiches.  He even displayed these microbe sandwiches on camera, for a news team.  

The great irony is that methane is made from microbes.  Bill Gates basically wants you to eat methane-making machines.  The guy is Gross-out City, and is lacking in sequential logic ... literally.

BTW, CNN lied when it claimed that methane is 84 times more potent in capturing IR light than is co2.   Methane is 28 times more potent than co2.  The Global Warming people are pathological liars who lie about everything.   They twist & exaggerate.

Concerning N2O, aka Nitrous Oxide, formerly known as Laughing Gas, it's 330 times more potent than co2 in IR light capturing capacity.  But, it only exists in the atmosphere at 1 part per THREE MILLION.  So, no problemo there.  

The unfiltered burning of coal would be the catastrophic problem, not because of co2, but because of actual toxins released into the air.  CO2 is your friend.  Mercury is NOT, when it enters your respiratory tract.  Mercury is in coal.  

Filtration is an absolute must, concerning coal.  So, leave co2 alone and worry about airborne coal vapor ... and even airborne fly ash when it's not filtered during the coal burning process.  

All in all, it's not Americans who need endless propaganda on the environment.  It's China and India who do.  America has the EPA and state regulatory commissions.  America mass-marketed the catalytic converter, etc.  

Of course, have fun going to China, to speak on any subject.  Communism isn't based on educating the masses, you know.  Een at that, China does use hydropower to the tune of 28.5% of its energy usage.  So, there's always hope in life.  The Climate Doomsayers cause confusion, in claiming that we are all gonna die in five years, unless we give tons of money to them ... and Al Gore.

Concerning water power, and even tidal power, water is 832 times more dense than is air.  That can turn turbines.  In fact, a tidal barrage would be the most powerful hydropower.   Such a power source is limited to coastlines.

                                           See:     Intro to coastal (tidal) hydropower

                See additionally:  England's blueprint for tidal energy 

      See furthermore:  How a tidal power station works

March 24, 2025

January 2025 NOAA temperature anomaly report: MINUS 3.08 Fahrenheit.

For those entirely new to assessing climate behavior:  An anomaly is a deviation from the average.  In January of 2025, Planet Earth's surface temperatures were 3 Fahrenheit degrees below the average.  In February 2025, record cold transpired, also.  In fact, March started-off with record cold weather and general cold waves.

January's negative digit anomaly is significant, being that, during the Biden Years, humanity was being told that Planet Earth was locked in a Global "Boiling" Climate Crisis.  Thus, the past two months broke the hypnotic trance of the Biden Mouthpieces.  In fact, one individual writer called the February 2025 cold waves "history book weather."
Above:  The Y-Axis columns are based on  20 month intervals.  The time span covered here is January 2005 to January 2025.  The blue-ink graph posted at the bottom of this post covers 1940 to 1985.  So, take note of the difference in time between the graphs.  
This proves once again that there is NO run-away doomsday global boiling climate crisis "tipping point."  This means that is no positive feedback loops that endlessly encroach on Planet Earth's atmosphere, starting the "next extinction event."  

After all, the Maldives are still NOT underwater, no matter what the repeated failed prophet, Jim Hansen, claimed since 1988.  Contrary to the Hansen Doomsday Prophecy, the 2025 Maldives enjoy a thriving tourist and real estate industry, as well as a number of functioning airports.  

The West Side Hwy of NYC is not underwater, either, as Jim Hansen falsely prophesied in a 1988 senate subcommittee hearing.  In fact, some of Planet Earth's glaciers are growing in size at this very moment.  Record crop yields have been enjoyed throughout Planet Earth, throughout the 2020s.  Likewise, England did NOT turn into Siberia by 2020, and the glaciers of Glacier National Park were not "gone by 2020," either.  

The MINUS 3.08 degree Fahrenheit avg temp anomaly for January 2025 is decisive news.  It shows that the Biden-Era "Climate Crisis" People were nothing more than Climate Grifters.   There is an outrageously large amount of taxpayer dollars they owe to the American taxpayers.

Even when the outdoor CO2 level was notably lower than today ... such as in 1922 ... the media reported on global warming and melting Arctic ice.  That was over 100 years ago.  Every type of weather you can list has happened previously, over and over again and again.  Therefore, there is no never-before-seen weather.  

Yes, over 100 years ago, the press/media was stating that the world was undergoing Global Warming.  It was the same story as today, without the end-of-the-world hysterics.  At the time, Global Warming was seen as something that made the climate more livable.  After all, shivering is painful.  Observe:

As soon as Biden leaves office, we entered into an era of History Book Weather that undid the effect of every global boiling doomsday prediction told to us like scary campfire stories.

In review, the record cold & snow of January & February 2025 was a pivotal event, in showing that there is no "global boiling," "tipping point," positive feedback, climate crisis at hand.  This was also the case:

1] during the record breaking Winter cold of 2020-2021 (specifically during February 7th to the 20th, when there were 9,027 daily cold records tied or set).  This was also the case, 2] during the Winter of 2019,   3] as well as the Winter of 2015,  4] the Winter of 2014, and most especially  5] the Winter of 2009-2010.  Record cold & epic cold was transpiring all along ... in cyclical intervals of time ... throughout the time span regarded as a "global warming tipping point crisis."  See for yourself:


As far as goes March 2025, see:

  
In re: the graph above:  That particular graph is of surface temperatures and their deviation from average surface temps.  Roy Spencer & John Christy, in Alabama, both monitor the Lower Tropospheric Temperature, via the Aqua Satellite and the Advanced Microwave Sounding Unit.  

Roy & John recently reported that the temperature rise in the lower Troposphere has been 0.25 degrees Fahrenheit per decade.  They also reported that the temperature rate is NOT accelerating.  

Moreover, the decisive test for "global warming" or "global cooling" is the middle of the Troposphere.  Very simply, if there is no temperature rise in the middle of the Troposphere, then there is no global warming.

A copy of the NOAA graph above is also posted at the bottom of this post, at a larger size, for those who are too stubborn or too brainwashed to understand.  It's simple.  During the Biden Years, Americans were told a parade of lies.  This includes lies about climate and weather history.

The mature question which is:  What actually drives the temperatures?  

ANS:  It's not atmospheric CO2 which does so.  This is because 0.043% of the atmosphere ... with a radiative forcing of no more than 3.7 watts per meter squared ... can't drive the atmosphere.  Pressure Gradient Force drives the climate, in terms of degree of turbulence in the atmosphere.  This is why the Arctic Jet Streams meanders during Wintertime.  The further the temperature difference between the Poles and the Equator the more the turbulence ... and meandering.  Winter brings a larger difference in the temperature between the Arctic and the Equator.

Sunspot Activity not commensurate with heatwaves in history

Moreover, it also is NOT Sunspot Activity that drives the temperatures, unless there is a delayed effect from solar flares that has not yet been charted & graphed.  During some of the hottest times in the early 20th Century, there were many instances when sunspot activity was extremely low.  This included the inferno year of 1921, as well as the year regarded by NASA as the worst drought year in the past one thousand years.  That was 1934.  In conclusion, there has been heatwave weather when the sunspot activity was low.

In addition, there are times when an epic heatwave year would also host an epic cold winter.  This would include significant temperature anomalies in the negative digit range, come wintertime.  This translated into a super cold winter and super hot summer in the same one year ... or within two years.  Yet, in the record books, the winter/summer anomaly numbers evened-out to the point of making that year look non-eventful and mild.  After all, when you add a super cold winter to a super hot summer, you get zero, in the temperature anomaly department.

For example, England endured an outrageously cold February, in 1895.  In America, the temperature anomaly for Feb 1895 was MINUS 9.05 degrees Fahrenheit.  This was accompanied by Australia's epic drought which ran from Feb 1895 to 1903.  Keep in mind that February is summertime in Australia.

Then, in 1896, Northeastern America hosted Ten Days of Death, in one of a series of deadly heatwaves that visited America until the end of the 1930s.  This would be followed by the "Four Decade Temperature Decline" hidden by Michael Mann in his deceptive Hockey Stick Temperature Graph.  Yet, during that decline, in 1976, heatwave tragedy visited Europe.

Water Vapor

Moreover, 90% of all greenhouse gases, by volume, is WATER VAPOR.  So, if Planet Earth's atmosphere is carrying too  much of a level of greenhouse gases, then Water Vapor is the cause. 

In as much, have you ever read of a Climate Crisis Activist ever mention "Water Vapor" as a greenhouse gas?  The failure to include Water Vapor in the greenhouse gas list is the sign of a total fraud who must be totally ignored by novices.  These same frauds need to be investigated by law enforcement authorities for Theft by Deception, being that some of these people received outrageously large sums of taxpayer dollars, in the name of a Climate Crisis which certainly doesn't exist.  These people are Grifters.

Then there is the matter of CIRRUS CLOUDS.  They are very effective in retaining (capturing) infrared heat.  Thus, if you got rid of all the CO2 and methane on Planet Earth, you would still have a 90% supply of greenhouse houses and the added help of cirrus clouds which are elongated masses of frozen water, ever so ironically.  It's just that, if you got rid of all the CO2, all life on Earth would cease, due to the end of photosynthesis ... which is commenced by the Sun.

The Oceans

This takes us to the oceans, as the driver of atmospheric temps, unless you want to entertain the Cosmic Wave Theory which is beyond the scope of this particular post.  Even at that, there have been Chinese scientists who wrote on the effects of weather by cosmic waves.  Thus, Cosmic Waves' Alleged Effect of Weather IS a topic worth studying. 

None the less, ENSO has its validity in determining temperatures, as in El Nino and La Nina.  The North Atlantic Oscillation was shown to have its validity, too.  

As far as goes the oceanic CO2 level, a certain individual, at the behest of the Biden Administration, claimed that 44% of the ocean-bound CO2 monitoring devices disappeared from service, due to Covid.  This was stated in 2023.   So, it was claimed that we just don't know how much CO2 is in the ocean.  HOWEVER, the vast majority of ocean water always is 39 degrees FAHRENHEIT.  Plus, CO2 captures no heat where the is no sunlight.

None the less, CO2's presence in ocean water is where the acidification debate comes into play.   So, keep in mind that the present ocean PH is at an average of 8.1.  Neutral is 7.0.  Moreover, if the oceans warm-up, less CO2 will be able to dissolve in the oceans.  I've already written on CO2 as it applies to the ocean, and there is a search engine at the top righthand corner of this page.  

The operative word here is IF.  After all, we underwent the recent fraud of unconscionable individuals who claimed that Florida Everglade runoff water was instead ocean water, distant from the shore.  Everglade water is much hotter than ocean water.  So, the claim at the time, in 2023, was that the ocean water off of Florida reached 101F.  The truth is that the ocean's surface temperature was 86F, on that day.  The Everglade run-off water was 101F on that same day, and that's nothing new.

So, there is the matter of fraud to consider when the ocean CO2 level is mentioned.  This was the case with the Resplandy, Keeling, et al paper of 2018 which had math errors.  The paper claimed that the oceans were warming at a rate much faster than expected.  It was an Apocalyptic paper which turned out to be a mathematical fraud.  Nature Magazine and a co-author of the invalid paper admitted as much.  Yet, the co-author defended as valid the general theory behind the paper. 

Even today, the vast majority of ocean water is 39F.

Super Cooled Water in the Arctic that did NOT turn into ice

Also remember that there is Arctic water which is Super Cooled, at 29.7F.  Thus, the lessening of Arctic sea ice extent can't all be written-off as melted ice.  And and and the Greenland Freshwater Run-off accusation of melted ice being released into the salty Atlantic Ocean has an invalidating feature to it.  

The Greenland Freshwater Runoff accusation looses its power in the fact that a number of major rivers unleash millions of gallons of fresh water per second into the salty Atlantic Ocean.  The amount of Greenland runoff water doesn't compare to the flow of the Mississippi, the St. Lawrence, the Congo, the Orinoco, and the Amazon ... combined.  So, where is the desalinization of the Atlantic in those places?  That influx of fresh Mississippi River water into the Gulf of Mexico/America did not cause the Gulf Stream to slow-down. 

By the law, President Donald Trump needs to change the name of the gulf to at least The Gulf of Atlantic America.  You know, there is a Gulf of California, too.  I stood on its shoreline.  America is huge in size.  One needs to define American geography & oceanography with more precision & certitude.

At this point, observe the following facts which prove that Planet Earth has NOT been in a warming-only scenario:

1} Antarctica had its COLDEST WINTER in recorded history, in 2021.  This occurred after the CO2 level had been steadily rising for the past 80 years, starting with the mass industrialization projects of WWII.  

2a} The largest amount of Antarctic Sea Ice Extent formed in 2014 or 2015.  This occurred 73 years after the start of the steady rise in atmospheric CO2.  

2bi} Moreover, it was in 2015 when New Zealand scientists found that the bottom of the massive Ross Ice Shelf was crystalized and NOT melting.  (Smoothness would denote melting.  Jaggedness denotes the opposite of melting.) 

2bii} At the time, this Ross Discovery was extremely unexpected, due to the resurgence of the "Global Warming" & "Climate Change" propaganda.  In 2009, that propaganda was invalidated after the publication of the 2009 Climategate Emails which proved that the "Global Warming" Movement was a grifter scam, done by those in search of massive funding from governments and/or NGOs.

3} The worst/coldest winter in 37 years occurred in 2014, also.

4} In December of 2023, the Russian towns of Delyankir, Oymyakon, and Yakutia underwent temperatures colder than -70F.  In the same December, Munich underwent -18C (0.4F) temps and approximately 15 inches of snow in one unit of time.

5} Record high crop harvests occurred all throughout the 2020s.  Yet, we were told that we were all going to be locked in crop failures and worldwide famine, due to the rise in CO2.  Excuse me, but CO2 is what makes crop yields plentiful.

6} Keep in mind that the Maldives still did not go underwater.  It still has several airports in operation.  This includes international airports.

7} Also keep in mind that the West Side Highway, in NYC, is still not underwater, as was predicted by James Hansen 36 years ago, in 1988, during a senate subcommittee hearing.

8a} On February 21, 2004, the US Edition of the Guardian reported that the Pentagon told President George Bush II that "Britain will be Siberian in less than twenty years."  

8b} The Same Guardian edition stated that:  "A secret report, suppressed by US defence chiefs and obtained by the Observer warns that major European cities will be sunk beneath rising seas, as Britain is plunged into a Siberian climate by 2020."   It's now 2025, and none of this predicted doomsday scenario has happened.

8c}  That claim was based on the belief that melted summertime ice would flow off of Greenland into the Northern Atlantic, and slow down the Gulf current ... due to desalinization of the ocean & due to the inability of salt-free water to sink into the ocean's depth.   

8d}  Well, keep in mind that the hypocrisy of this claim consists in the fact that, during every second of ever hour of every day, MILLIONS of gallons of fresh, salt-free, river water rush into the Atlantic Ocean.   

9} From the Winter of 2009-2010 and onward, there certainly were intervals of record-breaking cold.  This included the record cold temperatures of January & February 2025 in America & Northern Asia.  

10} During the Southern Hemisphere's SUMMER MONTH of February, in 2025, New South Wales Australia, Victoria Australia, and Tasmania experienced subzero temperatures, CELSIUS.  This would translate into freezing temperatures, Fahrenheit, in the middle of the SUMMER OF 2025.

Once again, this involves the Australian & Tasmanian summertime, and such weather is known as a Summer Polar Outbreak.  It occurred in 2025, while the Northern Hemisphere was enduring all types of record breaking cold and snow.  See for yourself:


(Note: In the news article is the photo of a car with snow on it.  A date is written on the windshield: 16/2/25.  Australians place the day of the month first, and then the month second, in their numerical notation.  Thus, the note on the snowy windshield is 16th of February, 2025.  That's summertime in Australian.) 

11} Even Japan had record breaking snowfall in February of 2025.   See for yourself:


The Sudden & Extreme fall of the avg temp indicates no positive feedback mechanism for CO2

Scientists know that there is not enough CO2 in the sky to trigger global warming.  They hope to find a "positive feedback mechanism" triggered by the presently small amount of CO2 that would create an unending "loop" which would then result in unending temperature rise.  Well, January 2025 proved that there is no such positive feedback mechanism which would possibly cause the endless rise of temps.  The sudden drop in temperature showed that there is no unending gear ratchetting the temperature upward.  

It's the Urban Heat Island Effect

At the surface level of Planet Earth, you have asphalt which retains heat very successfully, upon its own power.  It does NOT need CO2 to do this.  In fact, sand ... beach sand ... also retains IR heat successfully well, on its own.  Such a thing is the opposite of "albedo."  

Albedo is the ability to reflect sunlight and its heat back into outer space.  The color white has a high level of albedo, in terms of percentage of sunlight deflected.  100% albedo is a mirror perfectly aligned against incoming & oncoming sunlight.

There already were a number of years where the average temperature anomaly was quite low, thereby already proving that there is no positive feedback mechanism triggered by a slight amount of atmospheric CO2.   

Most of these end-of-the-world climate crisis assertions were and are pieces of propaganda, designed to deceive the US Congress into shelling out outrageously large sums of taxpayer dollars to these scientists who failed to get the CO2 level to decline, despite billions of dollars already given to them ... and despite many years to do so.  However, American & European industry did achieve a decline in CO2 emissions, within their prospective nations.  The coal-fired power plants of China & India are causing the increase in atmospheric CO2.

The atmospheric CO2 level of Earth reached its record height ... for any time in the history of mankind ... under Biden and Harris, in May of 2024.  This occurred despite Biden's draconian measures designed to lower the CO2 count which already is quite low, comparatively speaking.  

None the less, today's rise in atmospheric CO2 is being caused by all of the recently built coal-fired power plants placed into operation in India & China.  In all recent "climate agreements," China was designated as "exempt" from having to participate.  Yet, the CO2 Level of today is NOT apocalyptic, anyway.  CO2 only occupies 0.043% of the sky outside.  In fact, 99.5% of the Earth's atmosphere is occupied by 1] Water Vapor,  2] Nitrogen,  3] Oxygen, and 4] Argon.   So think:  99.500% vs 00.043%.  Huge difference.

Now for the worldwide temperature DECLINE hidden by Michael Mann with his math trick

Take note that during 1941 to 1985, the average YEARLY temperature anomaly did NOT rise above ZERO degrees Fahrenheit.  Therefore, it did NOT rise to positive digits, for 45 years.  The ZERO MARK on the X axis of this graph is the double horizontal line somewhat close to the middle of the graph's grid lines.  Simply look for the double line going sideways.  That's the ZERO MARK.  All temperature anomalies from 1941 to 1985 are either less than ... or equal to ...  ZERO.

Of course, there were a minority of months which had a positive temperature anomalies throughout this time.  The prime example is July of 1980, when Dallas was completing its record of 42 consecutive days of 100+ Fahrenheit weather.

None the less, below is:  your "decline," ladies and gentleman.  It's the one that was hidden by Michael Mann, as was mentioned in the 2009 Climategate Emails.  It was regarded as Mike's Nature Trick, in Nov 12, 1999, by Phil Jones.  This was in reference to the Nature Magazine paper of Mann and other contributors.  It was published in 1999. 

Phil Jones was in charge of the East Anglia Climate Research Unit.  The trick to which he referred consisted in Michael Mann cutting off the Briffa Reconstruction graph line at 1961.  Mann then used thermostat readings, for 1961 and onward.

If I can get around to posting a sunspot activity graph of the United States gov, I'll do so.  But, the bottom line is that high sunspot activity does not co-exist with high heatwaves, unless there's a delayed mechanism that hasn't been charted, yet.  None the less, there is an 11 Year Sunspot Cycle, and sometimes, temperatures and weather seems to parallel the weather eleven years prior ... sometimes.

Now remember, the chart above depicts the Years 1940 to 1985. 
The chart below depicts the years 2005 to start of 2025. 

                **********************************************************************

              Above:  USCRN stands for U.S. Climate Reference Network.

March 23, 2025

Numerous weather events of decades & centuries prior were more heated & deadly, and this was when the outdoor CO2 level was much lower than it is today.

We begin ... you & I ... with the February 2025 surface temperature anomaly report from the United States Climate Reference Network.  The USCRN comprises 114 weather stations.  So, without further ado, let's cut to the chase:

Below:  Now remember, an anomaly is the departure from the average.  In February 2025, the United States had a surface temperature that was 0.36 degrees Fahrenheit BELOW AVERAGE.  In the prior month, the anomaly was MINUS 3.08F.
As a reminder, and for your Peace of Mind, the January 2025 temperature anomaly report is posted directly below.  This is because it sounds too good to be true, and you could use a break from all of the scaremongering done by the mainstream media.  Upon looking at the Jan 2025 report, you will now know that I ain't a lying.

This brings us to a question:  Where is all of this hyper-theatrical, scary campfire story, End-of-the-World-and-we're-all-gonna-die "Global Boiling" that the UN told humanity was transpiring rapidly?  

ANS:  It was all a sales pitch ... a mean-spirited gimmick ... to get more United States taxpayer dollars into the hands of greed-stricken people.  In fact, the greed-stricken ones who bully others for power see the vast population of American citizens as . . . "the Little People."   

There is something pathological in these people's minds, in that they are not fazed or concerned about the United States' 36 TRILLION dollar national debt.  These people simply want money period, mindless of the consequences of a massive debt upon a continent-sized nation.  

In their minds, you are there to serve them.  And remember, auditing of sorts ... in the Dept of Government Efficiency ... has been underway, and it was discovered that tax dollars did get appropriated into the hands of Non-Governmental Organizations, as if these NGOs were government agencies.  

We now adjourn to 1932 America --- 93 years ago, when CO2 was low

The Year 1816 was the Year Without a Summer ... in Eastern America and all of Europe ... due to the Mt Tambora eruption.  In 1932, the Northeast of the United States experienced a year without a winter.   All in all, there was far more of a "Global Warming Climate Crisis" back then, in the early 20th Century ... and in the mid & late 19th Century ... than there has been within any packet of time of the 21st Century.   After all, the entire American Civil War was fought during a drought that actually began four years before the war even started.

In addition, the 1300s, 1416 & 1417, 1452 & 1453, the 1500s, and the 1600s had notable weather disasters, too.  In fact, on Saint Lucy's Feast Day, in mid-December of 1287, the coastline of the Netherlands was rearranged mercilessly.  Even German coastal areas were adversely affected.  Then, in November of 1421, the North Sea had a turbulent encore with the Dutch coastline.

Incidentally, the irony of 1416 & 1417 is that one year was a year of intense flooding, while the other year was the year of drought.  There were many other disastrous years, also. 

And of course,  the tragic St. Lucy event occurred when the CO2 level was very very low;  at 282 ppm.  That's 147 ppm LOWER than today.  Thus, you would be an avowed liar to claim that the St Lucy Day Flood and/or the November 1421 flood were caused by CO2 or methane.  This is because 1] the disasters happened towards the start of Winter, 2] there wasn't enough CO2 to effect air masses due to its low level, and 3] 90% of all greenhouse gases is WATER VAPOR, anyway.   

The bottom line is that Al Gore lied when he said that a rise in CO2 was going to cause a rise in the number and intensity of natural disasters.  The behavior of Pressure Gradient Forcing is what triggers or not triggers turbulence and the ensuing natural disasters that visit Planet Earth.

The Natural Disasters were worse in decades & centuries past ... not today.

The first half of the 20th Century had far more forest fire acreage burnt, mostly spanning from 1927 to 1943.  Floods ended worlds in Asia, even in the 19th Century.  The heatwaves were epic in the early 1910s, early 1920s, and mid 1930s.   Plus, extreme glacier melt in the Swiss Alps did keep making the newspapers in the early 20th Century.

And then came sea storms.  The most deadly hurricane of the Atlantic Basin occurred in 1780.  This prompted the French Navy to sail north toward Yorktown Virginia, during the Hurricane season of 1781.  The result was that a failing new nation got a second chance to become its own sovereignty.  The French preferred to fight the expert English and their General Cornwallis than the winds of the Atlantic Tropics, during Cape Verdi Season.

In comparison to decades and centuries past, there is no Climate Crisis today, because there is no one-sided, habitual trend toward any singular type of weather, be it either:  1] heatwave-only & drought-only weather,  or  2] cold weather only.

In the 21st Century, there has been a see-saw ride where notable hot weather would eventually alternate with record cold weather.  Of course, the media would hide or make little of any cold weather event.  In fact, the early 1990s saw the cold and record snow, while 1998 saw blossoms in February.  

The past 10, 20, and 30 years were NOT a matter of heated weather only ... or a drought-only climate ... or predominate cold weather.  In the 21st Century there has thus far been Diversity in Climate, within Cyclical Intervals of Time.   

I already line-itemized the record cold events of the past two decades.  This included a 13-day time span in 2021, when over 9,000 cold/low records were either tied or broken.  This also included a number of Antarctic records, in August & September of the same year.  In fact, the Winter of 2021 was the coldest one in Antarctic history. 

*******************

Let us take a look at some of the many historic receipts, otherwise known as historic pieces of evidence, and also known as the printed record. 

This particular post will cover two decisive events, before it covers the 1925 summertime heatwave & the March 18th, 1925 Tri-State Tornado:  1} The Winter of 1932 and 2} the Great Mississippi River Flood of 1927.    The 1925 tornado remains the most deadly & destructive tornado in American history.

The point to doing this is to show ... yet again ... that historic weather disasters occurred during times of low CO2 levels.  This shows that Al Gore was completely wrong when he claimed that the rise in CO2 would cause more natural disasters such, as hurricanes, to strike with more intensity.  And of course, the opposite of the Category 6 hurricane transpired.   There turned out to be more short-duration cyclones, along with cyclones too weak to be categorized as hurricanes.  Such things are called tropical storms.

Numerous photo-copies of newspaper articles are already posted at the Blue Marble Album.  So too are charts and graphs, as well as statistical tables.  If you don't want to read the text of any post here, then at least look at the charts, tables, and graphs here.  And if you don't want to read the historic newspaper articles posted here in photo-copy form, then at least look at the headlines and sub-headlines of them, as well as the dates of each one's publication.

In 1932, the CO2 level was 308 ppm.  That's 121 ppm LOWER than it is today.  Moreover, 90% of all Greenhouse Gases ... by volume ... is WATER VAPOR and not CO2.  The fact that exceptional warming occurred in 1932, 1934, 1936, and even in 1896, 1905, 1911, 1921, etc shows that the Al Gore CO2 Climate Driver Theory is a fraud.  You can't deny this without being an avowed liar.
 Below is another newspaper article on the exceptionally mild Winter of 1932 which literally placed the Winter Olympics "on hold."
     **************************************************************************

Below:  As far back as 1932, it was reported that, for the previous 25 years (1907-1932), the United States had "increasingly warmer winters."  Therefore, all of the present mainstream media hype about "global warming" today is nothing new, at all.  Such "global warming news reporting" occurred over ninety and one hundred years ago.  In fact, natural disasters of distant decades and distant centuries were worse than the majority of events in the past dozen years.  

Between 2012 and 2025, there have been many record cold weather events, including the coldest Antarctic Winter in recorded history.  Yet, the media made it look as if only heated weather events have been occurring.  The media also made it look as if the recent natural disasters never happened before.

In as much, during the 2016 Democrat Party National Convention, Sigourney Weaver LIED to humanity, when she said, "This we have never seen before."  Oh, mankind sure as Hell has seen it before, Sigourney, and at a much worse intensity, and tragically so.  

This includes sea storms, droughts, heatwaves, forest fires, dust storms, pestilence, crop failure & famine, flooding, landslides, tornadoes, cold spells, blizzards, glacier growth, glacier melting, and let us not forget plagues ... epidemics ... pandemics ... the end of world after world on Planet Earth.  

Ending the use of natural gas stoves and gasoline automobiles will NOT end the atmospheric turbulence & natural disasters which resulted in so much suffering throughout the centuries ... especially centuries of low CO2 levels.

Of course, Sigourney was just an actress, and actresses play make-believe.  Well, in 2016, Sigourney definitely was playing make-believe in front of America.   It's now the Year 2025.  We're tired of make-believe.  We want reality, instead.


                 *********************************************************************

1927:  Year of a great flood, when outdoor CO2 was 305 ppm ... 124 ppm LESS THAN TODAY.


In the 1927 sub-headline above, Columbus refers to Columbus Kentucky.
                                                                                     
In 1927, the CO2 level was a very low 305 ppm.  That's 124 ppm LOWER THAN TODAY.
  The lesson here is to quit listening to Al Gore, Michael Mann, Jim Hansen, Attenborough and their Congressional backers such as the very dishonest SHELDON WHITEHOUSE.  Spending your life as one of their many Useful Idiots is not a very fulfilling life.
           ***********************************************************************

            Also in 1927 was the reporting of ... Glacier Melt ... all when the CO2 level was very low.


********************************************************************
 
We now adjourn to the Heatwave of 1925, so that you may gain insight on how we are not in any type of never-before-witnessed "climate crisis."  Contrary to that which Sigourney Weaver said in 2016, all of "THIS" we have seen before, and at greater degrees of intensity.


*************************************************************************
    
  Below:  It's only the first half of the 1925 newspaper article.  The second half of it immediately                            follows.  And of course, both halves of the report are posted pursuant to 17 USC 107.                                                     


                                            *************************************

Below:  This is the second half of the June 8, 1925 Nelson Evening Mail edition, at Page 5

***********************************************************************

The most destructive tornado in American history occurred in 1925, when the CO2 level was low.

Humanity was constantly being told that natural disasters are getting more frequent & more intense, in the hyper-theatrical sound bytes of Joe Biden, Al Gore, and the Secretary General of the UN, as well as others.  Well, if this is true, then answer this question:

Why was the most destructive TORNADO in history one that formed 100 years ago, on March 18, 1925?  If we are presently in a Climate Crisis, then the most deadly tornado, most deadly hurricane, and most severe drought would have happened within the past ten to fifteen years.   But, these disasters transpired 91, 100, and 245 years ago, thereby proving Al Gore and Michael Mann to be liars ... or at the least ... incompetent.  In fact, as was already reported in this Blue Marble Album, the longest Southwestern America drought was found to have occurred in the late 13th Century.  You have to quit listening to Al Gore, CNN, the UN, MSNBC, etc.

One important note about tornado formation, in this era when the media keeps squawking "global warming" and similar bumper sticker slogans:  For a tornado to form there absolutely needs to be a COLD DOWNDRAFT.  This is why meteorologists mention, "Tornado Season."  Thus, global warming doesn't cause tornadoes.  Two winds which are positioned to combine with each other and construct a vortex do.  

The first tornado recorded in America occurred in 1643, in Essex County Massachusetts.  Tornadoes were also recorded in 1671, 1680, 1761, 1787, etc.  None the less, not all tornadoes that occurred before 1950 were placed in the record books.  Only significant ones were counted.  None the less, the worst Tornado Outbreak in America occurred in  April of 1974.  It produced 148 tornados and reached 13 states, along with having reached Ontario Canada.  

And of course, in response to Sigourney Weaver stating, " 'this' we have never seen before,"  when it comes to tornadoes, we have seen it before, thousands of times.  Among the worse tornado outbreaks, there also was one on Palm Sunday 1965, one in 1917, and the one in 1962, when 188 tornadoes touched-down in 25 American States.  Extreme weather events were not limited to the 21st Century only.  It has always been wrong to claim so. 

A quick review on the formation of tornadoes

Ultimately speaking, the ingredients which causes a tornado to emerge in ferocity is  CONVECTIVE AVAILABLE POTENTIAL ENERGY.  This arrives in the form of thunderstorms, after high dry air becomes a downdraft and mixes with warm air that uplifts.  

In fact, that which is needed to occur upon the thunderstorms that turn into tornadoes is 1] Wind shear,  2] Lift,  3] the Baroclinic Instability which creates the turbulence,  4] Moisture which is actual presence of liquid water, as opposed to gaseous water vapor.  BTW,  the pre-storm liquid water is always in trace amounts.

Moreover, without wind shear, the resulting low "Storm Relative Helicity" (twisting potential) will not create a mesocyclone.  But, you can get ferocious thunderstorms.  You might also get shorted-lived "airmass" thunderstorms, also.  

One more thing, during the Biden Years, certain scientists starting using the phrase, "atmospheric river."  That phrase actually began at MIT in the 1990s.  The phrase has a way of scaring novices in atmospheric science.  Yet, it refers to a narrow band of water vapor.  An atmospheric river is bordered by differing fronts called frontal zones, and it forms over ocean water.  The most famous one is the Pineapple Express.  Now, a river of vapor doesn't sound too dangerous, once you know what the true definition of atmospheric river is.

As far as goes scientists' attempt to report the weather in hyper-theatrical degrees, know that things in that sky have been the same ... between intervals of time ... for centuries.   Thus, a typical cloud today weighs as much as clouds did 3,000 years old.  

A white fluffy cloud looks quite harmless.  But, it could seem to be something terrifying by adding one simple fact in a news report.  The average, ordinary, everyday, run-of-the-mill cloud in the sky weighs approximately one million pounds.  It sounds dangerous.  But, it's the same type of cloud you have been seeing since childhood.  And when a cloud descends to the Earth's surface, it's called fog.   Fog can't hit you in the head hard enough to give you a concussion.  Fog has the strength of chiffon.   Only fear fog when driving a vehicle. 

And of course, scientists try to make the weather sound scary ... as if things are now occurring which never happened previously ... in order to trick the US Congress into shelling-out outrageously large sums of Congressional funding to these hyper-theatrical scientists.  It has all been a swindle done by grifters.

Powerful Tornado Outbreaks in quick review
.
Now, the most powerful tornado in known history formed in Smithville, Mississippi, on April 27th of 2011.  It was part of a Super Cell which included 70 tornadoes in all.   Then there was the Great Plains Tornado Outbreak of early May 1999.  That was when multiple super cell thunderstorms created 70 tornadoes which made marks on Oklahoma, Texas, and Kansas.  However, the March 1925 Tornado was the most costly one upon human life.  It was the most deadly of them all.

Below:  The Tri-State Tornado of March 18, 1925 started in Missouri, crossed through Southern Illinois, and even entered Indiana.  And keep in mind that this was when the outdoor CO2 level was low.


Officially speaking, the Death Toll turned out to be 695 people.  The suddenness of a tornado is its most terrifying feature.  In America, it has been common to have over one thousand ... even over 1,200 & 1,700 ... tornadoes each year.  This translates into over ten thousand tornadoes in America per decade, ever since thorough & high-tech detection & record-keeping has been established.
For more info on the March 1925 Tri-State Tornado:


March 22, 2025

Review of Springtime 2023: The American West's Water Levels

New Mexico, during one of my long distance road trips.
Note:  The current Spring 2023 lake level tables for California, Nevada, Utah, Oregon, Colorado, Arizona, New Mexico, & Texas appear at very end of this post.  If you are short on time ... or if you have trouble reading (which is understandable) ... then skip down to the tables, aka charts, so that you can sigh with some measure of relief.

Hello there, boys & gargoyles.  Welcome to Pat the Wonder Rat's School for Figuring Stuff Real Good ... or Really Well ... as in "Let's make this real."  Let's find out the truth, once and for all, about the topic at hand:  

It's another one of those Chicken Little topics.  This topic involves the claim that the American West is presently undergoing its worse drought in the past 1,200 years.  In fact, it's attached to the claim that, in 2022, a five mile stretch of the Rio Grande River dried-up.  

At the outset, this allegation is contradicted by the fact that NASA had already declared the Year 1934 as having been the worst drought year in the past 1,000 years.  And that Rio Grande River report was easily proven to have been a complete lie, and evidence showing the Big Rio Lie is here, at this site.


Preview:  It's very elementary, Watson.  If there were a 20 year drought in the American West, the entire West would have become an array of ghost towns by now, with little more than tumbleweeds remaining.  

Liars have a way of failing to match observed reality while telling their lies.  After all, during the time span when the former Wild Wild West was supposed to be having its worst drought in the past 1,200 years,  [1] Texas' population grew 20.68% and  [2] Nevada's population grew by 19.45%.   Meanwhile, [3] Utah lead the nation in population growth, to the tune of 23.88%.  This pertains to the US Census Years of 2009 to 2019.  

A  memento of my time out West ... in the former Wild Wild West.
Funny how the End of the World keeps getting postponed, decade after decade

It was the Year 2006 when Al Gore made his bold hurricane prediction, along with his sea level rise prediction.  (A) Since then, a grand total of one and only one Category 5 hurricane made landfall upon the continental United States.  It was Hurricane Michael, in 2018; twelve years after Gore made his Category 6 hurricane prediction.   (B) Since 2006, eight Category 5 hurricanes developed in the Atlantic Basin, and that's an average of one Cat 5 hurricane every two years.  (C) As far as goes Category 5 hurricanes making landfall upon the continental United States in the past 100 years, the number is ONLY FOUR --- (i) The 1935 Labor Day Hurricane, (ii) Hurricane Camille in 1969, (iii) Hurricane Andrew in 1992, and (iv) Hurricane Michael in 2018.  

(D) As far as goes all Category 5 hurricanes that developed in the Atlantic Basin in the past 100 years, the number is 39.  This amounts to one Cat 5 hurricane every two-and-a-half years.  

These are NOT end-of-the-world numbers, especially when making comparisons to the past seven centuries.  Florida's history of approximately or exactly 180 cyclones since 1523 will be the example for you to gloss-over, skim-through, or even peruse like Sherlock Holmes, if you desire.

                  See: https://detailedpedia.com/wiki-List_of_Florida_hurricanes_(pre-1900)

          Also see: https://en.wikipedia.org/wiki/List_of_Florida_hurricanes_(pre-1900)

These are the tracks of each Florida Cyclone, from 1851 to 1899 ... and only from 185 to 1899.  In that time span, atmospheric co2 was 285 ppm to 295 ppm.  That amounts to 125 ppm to 135 ppm of co2 LOWER than today's atmospheric amount.  According to Al Gore & Michael Mann, those cyclones and cyclones dating back to 1523 should not have occurred so frequently.   
And for the record, the most recent stat on sea level rise is that it rose 9.96 inches, from the Year 1890 to the Year 2021.  That amounts to one inch every 13 years.   

From 1970 to 2021, sea level rose 8.8 mm -- 3.46 inches.  However, a non-government entity who will remain nameless out of politeness claims that the sea level rise was much higher.  The claim was that sea level rose 3.6 inches since 1993, instead of 3.5 inches since 1970.  

During the "Biden Years," it is now being claimed that, all of a sudden, sea level rise will occur at a rate of one inch every 6 1/2 years.  Being that this is not intended to be a political post, nothing more will be stated here.   However, the following may enlighten you.  It deals with the fact that Joe Biden had TWO brain surgeries due to aneurysms, in 1988.  No further comment on this will be made.

See: https://www.latimes.com/archives/la-xpm-1988-02-14-mn-42679-story.html

Also: https://apnews.com/article/e35733e8b2c96e0f46608c4773700292

None the less . . .

This brings us to a question:  Whom are we to believe about conflicting sea level reports and predictions?  ANS:  The ones who have been living on the coastlines for the past 20 and 30 years.  They'll tell you if there is an encroaching sea level rise that will wreck civilization or not.

(E) And of course, the continental United States went 12 consecutive years without being visited by any major hurricane.  This occurred between Hurricane Wilma and Hurricane Harvey.  The years spanned from 2005 to 2017.  The irony is that the longest absence of major hurricanes in the history of  America began the very year Al Gore predicted that an onslaught of Category 6 hurricanes would smash into American regions such as  . . . all of Florida.   

BTW, in 2022, Hurricane Ian arrived as a Cat 4 hurricane ... and not as a Cat 5.  

(F) In sequence, neither the Maldives nor Lower Manhattan went underwater, as was predicted to US senators in June of 1988.  All in all, the disasters predicted by Al Gore .. and Jim Hansen ... did NOT materialize.  Gore basically got the Nobel Prize for being a False Prophet, all the while making himself outrageously rich.

As a quick observation, if these predicted  calamities are finally going to come true now, then the hundreds of billions of US taxpayer dollars paid to scientists (to prevent climate disaster) was a complete waste of money, hundreds of billions of times over.  All of the UN climate conferences have been a waste of time and money, also.  This is because co2 rose from 360 ppm (in 1995) to 421 ppm (in early 2023).  

A 61 ppm rise in a full 22 years proves the climate conferences to be worthless as to their stated goals.  And the fact that there were far more turbulent weather events decades prior and centuries prior proves blatantly false the Al Gore Theory of Climate & Surface Temperatures.  A rise in CO2 does not accompany more turbulent and more frequent weather disasters, especially during the 12 years between Hurricane Wilma and Hurricane Harvey.

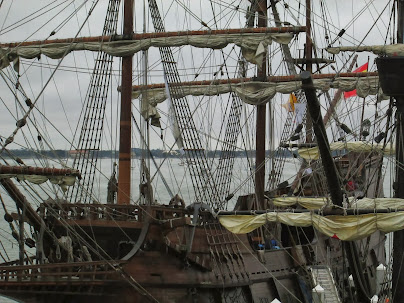
During the days when this type of ship ruled the seas, there were many weather disasters.  This meant that the winds & pressure systems on the high seas ruled the ships, instead.

Nothing New Today & Nothing More Severe than in Former Centuries

The great falsehood of the climate doomsayers is the claim that severe weather events only began with the invention of the internal combustion engine.  For example, both David Attenborough & Michael Mann claimed that the climate and all weather conditions were stable and calm for one thousand years prior to the 20th Century.  Disgraced NY Governor Cuomo said similar.  The truth is that weather events were more turbulent in centuries past, due to one scientific mechanism which appears in textbooks under the title, Pressure Gradient Force.

And of course, Sigourney Weaver became Hillary Clinton's surrogate liar in 2016, by claiming on national TV that, "This we have never seen before" ... concerning severe weather.  No Sigourney.  You were wrong.  It has ALL been done before.  

The truth is that history is filled with multiple weather disasters, even when the atmospheric co2 count was only 65% (two-thirds)  of what it is today (in 1610)   And for the record, the co2 count during caveman days was 61% of what it is today. 

There has not been any adverse climate trend or severe weather event today that was any worse than any weather event or climate trend of the 1500s, 1600s, 1700s, 1800s, and 1900s.  Throughout those centuries, there were horrendous weather disasters & life-changing weather trends which were far more turbulent than the vast majority of today's events.  In fact, there were life-destroying trends back then.  This included the December 1287 flood which killed 50,000 to 80,000 people and altered the coast of the Netherlands.  

The weather of the past 700 years included heat waves, droughts, crop failures, severe winds, cold snaps, blizzards, ice stacking, glacier growth, glacier melt, severe floods, epic Rocky Mountain forest fires, and sea storms that annihilated a couple military fleets, as well as numerous individual ships separated from their fleets ... along with ships that launched & traveled alone.  

Even if you go back a thousand years, you will find disasters such as the Great Coastal Flood of 1099 which killed approximately 100,000 Europeans in the British Isles & in the Netherlands.  The weather disasters included the 1315-1322 Great Famine of Central Europe which killed over 7 million people.  

The weather disasters of the past 700 years also included the 11 month-long Tudor Drought of 1540, along with the Great Storm of 1674 near St Augustine Florida, the oldest established city in the United States.  Then came the July 1743 China Heat Wave that reached 112F and killed approximately 11,400 people.  The disasters also included the ultra-devastating Yellow River Flood of 1887 which killed 930,000 people.  All in all, the weather events that today's climate doomsayers amplify are chump change in comparison to what came before us, throughout past centuries, with exceptions such as 1969's Hurricane Camille.

The pre-modern weather disasters included the Newfoundland Grand Banks Hurricane of 1775 which took 4,000+ lives.  Also in line was the 1776 Pointe-a-Pitre Hurricane which sunk 60% of the French and Dutch ships caught in its winds, as well as killing 22,000 people.  Six thousand of those fatalities were on Guadeloupe when the hurricane arrived.  

The Great Hurricane of 1780 followed suit, taking also 22,000 lives in the Caribbean.   In the Pacific was the JULY TYPHOON OF 1780 which was estimated to have killed 100,000, in the Philippines.  Typhoons would also hit the Philippines in 1782, 1783, 1792, 1793, 1795, 1797, 1802, 1803, 1804, 1809, 1810, 1812, 1819, 1820, 1824, and 1825.  Also in 1780 came New England's Dark Day, recorded by George Washington and others as having been on May 19.  

 There was the Miramichi Fires of October 1825, in New Brunswick, incinerating 2.5 to 5 million acres of forest, while killing approximately 200 to 300 humans.  This was when the co2 count was 284 ppm and during a month when things were supposed to be cool and moist.  If this happened today, the Bill-Gates-funded media would have blared it through trumpets, claiming it to be the sign of the End of the World.  Well, the world didn't end in 1825.

Later came the two most encompassing fires of them all, namely the Peshtigo Fire of 1871 (in Wisconsin) and the Great Michigan Fire, also in 1871.  The two fires charred 4 MILLION acres of Midwestern America.  Then came the Year 1881 which brought a true Yellow Day fire in Michigan, and it was followed by the Big Burn of 1910, effecting Idaho and Western Montana. 

Pre-modern weather events included the 1886 Great Fire of Calgary, in ALBERTA CANADA ... and the 1886 Great Vancouver Fire, also in CANADA ... along with the relatively nearby Great Fire of Spokane and the Great Fire of Seattle, as well as the Great Ellensburg Fire (also in Washington State), all occurring in 1889.  This was followed by the Great Fire of 1919, also in ALBERTA CANADA, as well as in Saskatchewan.  That fire incinerated 5 million acres of forestland.

Moreover, this all occurred when the co2 level was 295 to 303 ppm; 117 to 125 ppm LOWER than today.  Therefore, there is nothing new or apocalyptic about the 2023 Alberta Fires, other than it served as a reminder that neglected, "downed," and lifeless timber dries out, thereby becoming effective kindling.  Those were all tragic fires, throughout the centuries.  Today's fires are not more superior than fires of centuries past.  In fact, when comparing the aforecited fires to the historic Great Chicago Fire, the Great Chicago Fire doesn't even compare slightly.

Ice Jam Floods of the Renaissance & Elizabethan Era

And of course, there was the matter of "ice jam floods," during the Little Ice Age.  These consisted in wedges & blocks of ice lodged in waterways, causing water to backup.  These consisted in natural dams made out of ice ... and NOT caused by the burning of fossil fuels.

Incidentally, the Little Ice Age began with the arrival of the Wolf Minimum in 1284, and it ended with the arrival of the warm rain which incubated the very mobile water mold, Phytophthora infestans, in 1845.  The Year 1845 was the start of the Great Potato Famine  ... in Belgium & the Netherlands.  The water mold quickly spread to elsewhere, including Ireland.   None the less, in 1284, the atmospheric co2 count was 282, and in 1845, the co2 count was 284.  Yet, tremendously damaging natural disasters occurred during that time and long before it.  

The weather disasters during the Little Ice Age were many, and a few of them even included birds falling out of the sky, during sudden weather changes.  The raining of birds is not at all suspiciously non-believable, being that, in the 20th and 21st Centuries, it has rained small silvery fish, small frogs, and crayfish.  As a specific example, in 1873, it rained frogs in Kansas City.

In scouring through the chronicles, almanacs, captains' logs, and newspapers, you can add to the weather equation the wind-swept decimation of Kublai Khan's first invasion fleet of 1274 and the massive splintering of his second invasion fleet, in 1281.  Also add the Spanish Armada disaster of 1588.  This all happened when co2 levels were 120 to 160 ppm LOWER than today.  PPM stands for parts per million, incidentally.

As you can see, mankind survived very turbulent centuries, as well as having survived the horrendous 6th Century, with the Year 536 being the most traumatic of them all.  All in all, the most devastating of weather disasters did NOT come about by the burning of fossil fuels, especially when such burning was accompanied by modern filtration systems and catalytic converters.  The most disastrous climate disasters were the result of ===> volcanic activity which resulted in disastrous cooling trends.  

The disastrous result was due to sulfur dioxide blasting out of a volcano, into the atmosphere, causing sunlight to be reflected back into outer-space.  This is known as "albedo."  This is also known as the "aerosol effect."  And of course, no crop grows on glaciers or on frost or during frozen temperature intervals.  

What actually does cause deadly "turbulent weather?"

The reason why a mini ice age will result in more turbulent weather than a warming period is because of Pressure Gradient Force.  Very simply, the closer the temperature that exists between the Poles and the Equator, the more stable the atmosphere.  The greater the temperature difference between the Equator and the Poles, the more turbulent will be the atmosphere.  

During global warming phases, the temperatures between the Poles and the Equator become closer to each other.  After all, it's during Wintertime when the Polar Jet Stream meanders; not during Summertime.  In fact, in order for any tornado to form, a cold front literally has to "drop in."  Tornadoes are the opposite of global warming events.

All in all, remember the introductory law of Pressure Gradient Force, and even look-up "baroclinic instability," as well as "barotropic instability."  Add Eckman Transport to the reading list.  Eckman Transport addresses the oceans' angular staircase motion throughout layers of ocean water.  You need to learn these specific elements of atmospheric science & oceanography, in order to avoid being the useful idiot of Al Gore, Michael Mann, David Attenborough, the Third World Reps of the UN, and other individuals who have set their income goals upon American taxpayer grants and donation money from people who know nothing about atmospheric science. 

Australia Today.  Okay then, show me the Michael Mann Climate Crisis here.  Looks like he has been lying all along, and living without a conscience.

In direct contrast to the various End of the World Reports that never resulted in the End of the World, the following has recently occurred:

[1a] the Great Barrier Reef of Australia recently enjoyed replenishment.  [1b] Australia received its inland rains & ski lodge snow, as well.   [2]  The dams of the American West predominately enjoyed all of the ingredients that successfully replenish water levels there. 

[3a] Antarctica had its coldest recorded Winter in 2021, [3b] as well as having had its largest sea ice extent in 2015.  

[3c] In fact, it was found that, between 2009 and 2019, sixteen of the 34 ice shelves of Antarctica were growing enough to produce a net ice mass balance gain of positive 661 Gigatons.  It was found that East Antarctica's ice shelves let Antarctica grow another 5,305 square kilometers in ice, despite the 18 ice shelves in the West of Antarctica and on its peninsula which were retreating.  This translates into aggregate ice shelf growth of 2,048 square miles.   Basically, the climate doomsayers were lying to the world about Antarctica, hiding the fact that it was gaining ice mass, all along.

See: (European Geosciences Union, Volume 17 / issue 5 / TC, 17, 2059-2072, 2023 / May 16, 2023.) 

[Andreasen, J. R., Hogg, A. E., and Selley, H. L.: Change in Antarctic ice shelf area from 2009 to 2019, The Cryosphere, 17, 2059–2072, https://doi.org/10.5194/tc-17-2059-2023, 2023.]

Important   ====>   https://tc.copernicus.org/articles/17/2059/2023/?mc_cid=7a3485fd02

BTW, Antarctica's peninsula is outside of the Antarctic Circle.  In fact, it's closer to Argentina than it is to the South Pole.  This is understandable when you take into account the reality that Antarctica is 5.5 MILLION square miles wide.  It's the exact same size as the Arctic Ocean, on the other side of Planet Earth.  This brings the rationally minded person to a question:  Why is the South Pole all ice-covered terrain, while the North Pole is all ice-covered water the exact same size as Antarctica?

[4] Concerning the other side of Planet Earth, even in Western Greenland, the Jacobshavn Glacier was found to be regrowing, in 2017, 2018, and 2019, at last count.  [5] Also up north is England whose landmass experienced record low temperatures in 2023, despite the July 2022 claim that England was now going to be experiencing only dry record heat and fires all over the place.  

[6] Meanwhile, a multiplicity of nations enjoyed record crop yields recently.   [7] And you now have a new weather occurrence, as of 2023, and it is completely opposite of that which was predicted by Michael Mann, Jim Hansen, Al Gore, John Kerry, Bill Gates, David Attenborough, and a number of others who recently came into lots of American taxpayer dollars, ever so coincidentally =====>

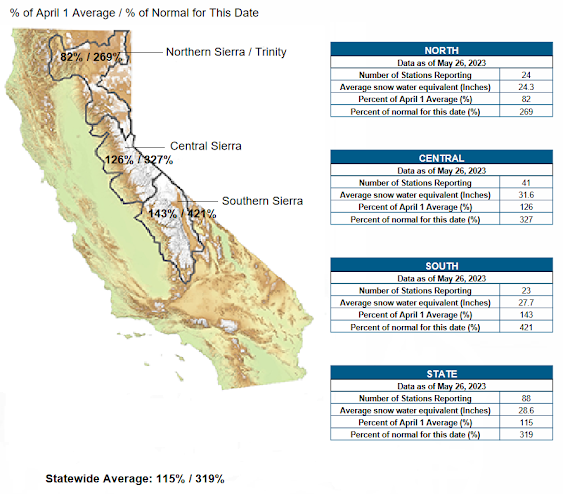
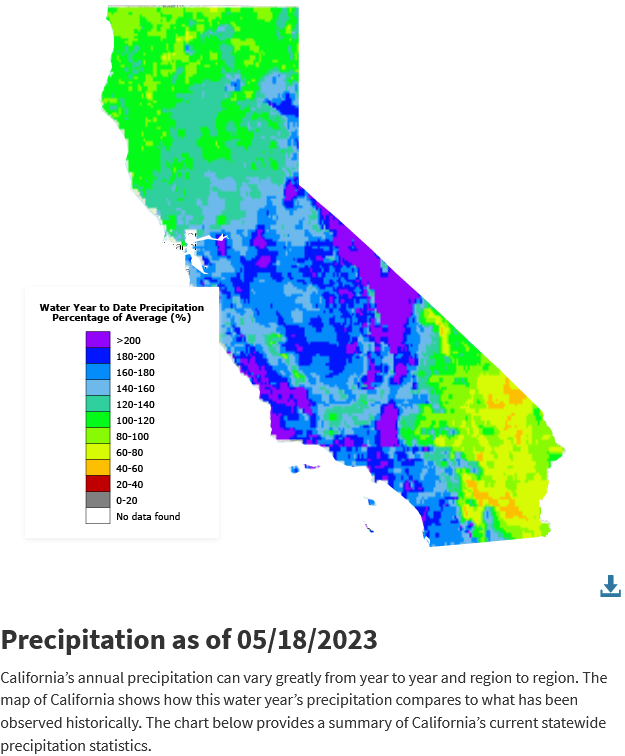
421% of the normal for May.  319% & 327%, as well, thereby summing the equation up to a plentiful water supply ... and NOT a 20 year-long drought.  This summarily invalidates all of the climate doomsayer assertions, especially those from the ever so arrogant mouth of the present governor of California who blamed co2 on his absence of foresight.

Okay now.  We've been told that the American West has been enduring its worst drought in 1,200 years.  Well, the truth is that the worst drought there transpired between 1276 and 1299 C.E.  (Common Era.)  In fact, between 1903 to 1918 (when atmospheric co2 was very low) Arica Chile did NOT receive a drop of rain.  And NASA officially stated that the worse drought year in the past one thousand years was 1934.  This and other related topics were already addressed at the Blue Marble Album.

We have also been told that there is a Western American drought that has been ongoing for 20+ consecutive years, despite the Monsoon seasons that regularly visited the American West and which actually came from the Gulf of Mexico ... and NOT from the Pacific Ocean, during any La Nina weather system.  

In as much, wherever there are monsoons, there are NO droughts.  And what is a monsoon?  It's a sea breeze on a continental scale ... on a massive scale.  Even England has a Monsoon season.  It's called, the Return of the Westerlies. This explains the British male stereotype.  It was that of a man wearing a black derby hat, while carrying an umbrella with him everywhere he goes in England.

In re: The present dishonesty of the climate doomsayers, despite 35 years of failed doomsday predictions by which they should have admitted being in error long ago: 

Let's continue with the issue of the climate "experts" stating that the American West is trapped in a long-term drought.  Directly below is another official State of California conveyance, as of May 2023.  Ladies & Gentlemen ... Boys & Gargoyles ... this is the OPPOSITE of a long-term drought or a long-term "climate crisis."  This is the state of the State of California less than one calendar year after it was proclaimed that Planet Earth was in a catastrophic heat, drought, and city fire mode, as well as a forest fire mode.

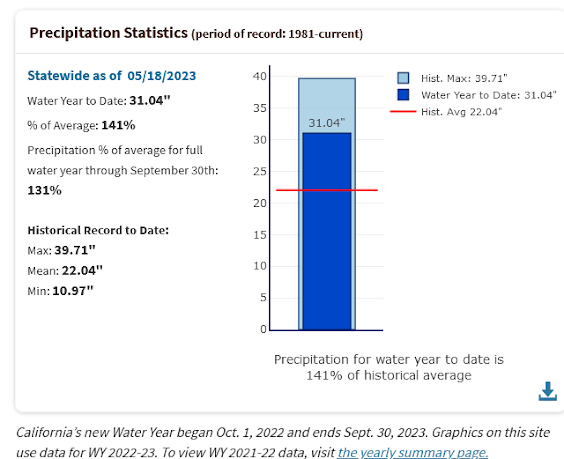
You need to understand that politicians seek to deceive, while activists seek to intimidate.  Below is an official government illustration, aka chart, aka supplement to an official government report that certain politicians and activists do not want you to view.  The map up top focuses on specific locales.  This one covers all of California.

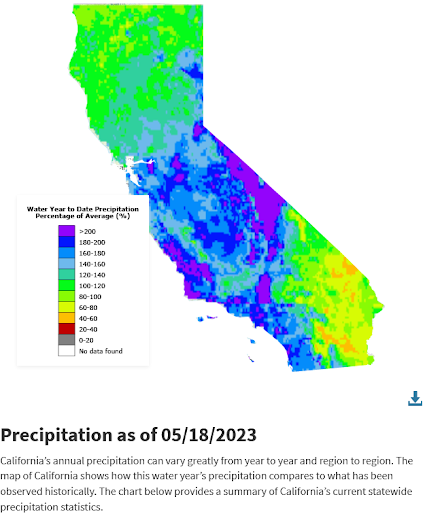
This is one of the many pieces of evidence ... spanning a 35 year period ... which shows that Michael Mann & Al Gore, as well as Jim Hansen, are NON-factual in their doomsday prophecies.


Despite the contrary reality, the hyper-theatrics of the climate doom scientists were megaphoned by the commercial media, Democracy Today, the U.N., and the state-funded National Public Radio.  Such propaganda would rationalize the $370 BILLION U.S. taxpayer outlay for the climate doomsayers.  There was also an outlay of $424 BILLION, during the final two years of the Obama administration.  So, I'll go look at the pertinent official statistics ... yet again ... and assess this doomsday drought assertion of the Michael Mann Hockey Sticklers, the John Kerry Frequent Fliers, & the Al Gore Carbon Taxers.  

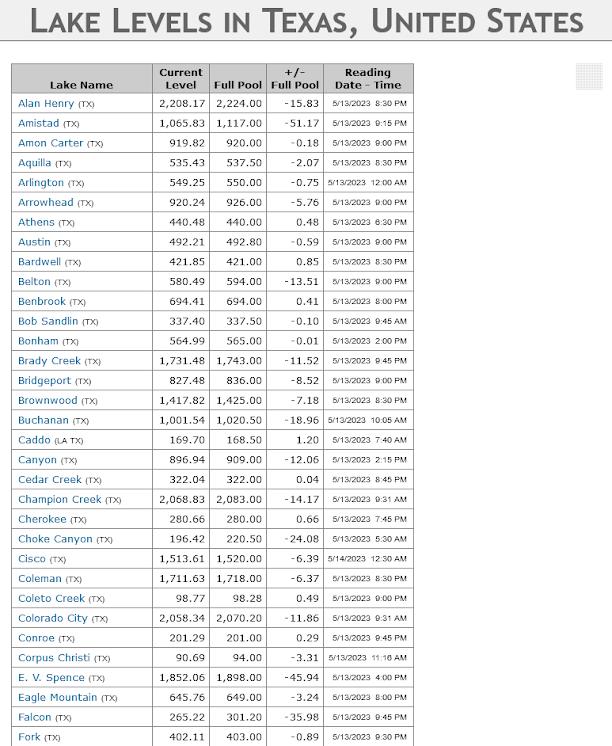
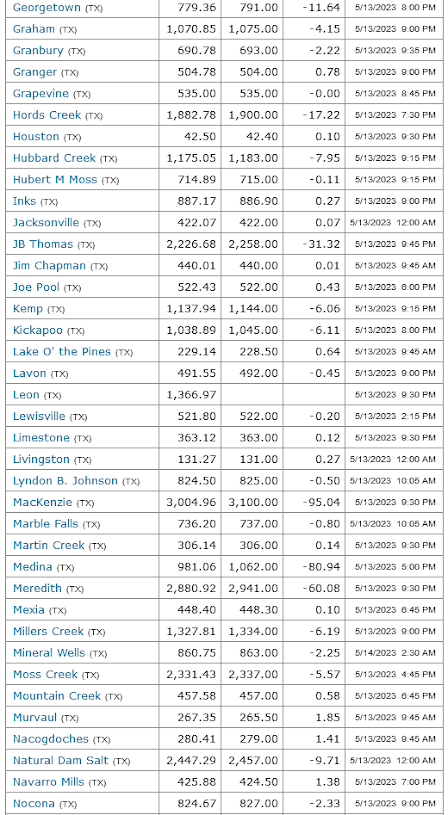
If those doomsday assertions are correct, then the water levels of all the dams and tributary lakes (also reservoirs) in the American West will be near their "dead pool" levels.  And if this is the case, we have to immediately move tens of millions of people out of California, Nevada, Utah, Oregon, Arizona, New Mexico, Colorado, and Texas, as well as the Red Desert of Wyoming.  

For those unaware, "dead pool" is the water level at which a reservoir or basin or tributary lake can no longer flow downstream.  It's technically known as Minimum Power Pool Elevation.  In addition, when it comes to a water level enabling turbine power generating, "INACTIVE POOL," becomes a serious concern.  Inactive Pool is the minimum water level elevation for generating electrical power.

As an added educational note: When you see the phrase, "tributary lake" or "tributary river," think of a moving body of water "contributing its water" to another river or lake.

I shall return in a few hours, after checking out Western lake & dam water levels.   Tic/tic ... tic/tic ... tic/tic/tic.  Tic again. Tic some more.  Ticarooski. 

Okay, I'm all back and everything from doing all of that fact checking stuff, to see if there really is a drought in the American West by which the World needs to be saved by that muscular model of manliness, Michael hockey-sticks Mann, and that electricity-sparing wise budgeteer, Al carbon-credit Gore.  The conclusion is  ====>

Someone needs to grow up.  Or someone else needs to file a number of False Claims Act lawsuits, where "treble damages" are exacted upon the fraudulent receiver of federal dollars.  Treble damages mean "three times the liability price tag, exacted upon the wrong-doer."  A wrong-doer is known as a tort-feasor, in American law.   

All in all, you do NOT need to fear the doom-ridden 1988 predictions of the former director of NASA's NYC branch, Jim Hansen, in his 35 year old predictions which never came true.  After all, the Maldives did NOT go underwater, lower Manhattan did not go underwater, and the Arctic's closest event to an ice-free August was in 2012, when 1.32 MILLION square miles of ice remained on top of the Arctic Ocean during the hottest time of the year.  That is the size of India plus another 0.8 million square miles.  (India is 1.24 million sq mi.)

Covering the perimeter of that distance of ice was equivalent to flying 1,148 miles east to west and then 1,148 miles north to south.  That's close to flying from Boston to Milwaukee, and then from Milwaukee to Houston, followed by flying from Houston to Miami, and then from Miami back up to Boston again.  That sheet of Arctic ice was 6 times LARGER than the size of France, and it was the lowest amount of Summertime Arctic ice in modern history.  Yet, it was a lot of remaining ice.

Moreover, the UN recently lied when stating that worldwide fatalities due to weather disasters are on the rise.  The opposite is true.  Observe:
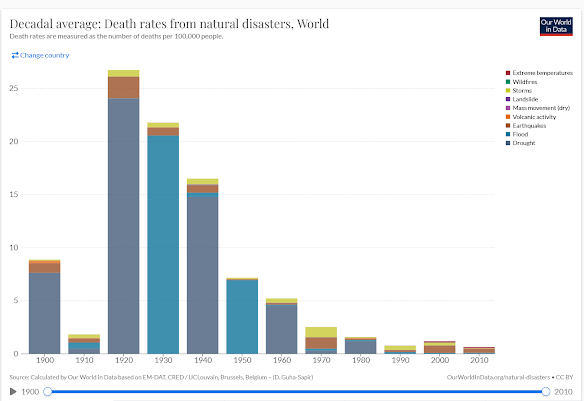
Looks like a Choir of Liars were singing to Greta T., deceiving her into believing opposite of the facts.

In the sample graph below ... of 2019 ... take note that the least frequent cause of death were "natural disasters."  IF and ONLY IF the climate doomsayer claims were true, the number of deaths caused by natural disasters would have had skyrocketed decades prior.  However, that type of cause of death is still at the bottom of the statistical list.  

This is yet another piece of evidence proving that the hysterics presented by Al Gore, Michael Mann, the third-world-country reps at the UN, Jim Hansen, Bill Nye, and several others are outright fraudulent.  Deaths by cause of Natural Disasters have ridiculously low numbers compared to all of the other causes of death.  Heart disease is the #1 cause, as in 18,560,000 vs 6,076 natural disaster deaths.  Look for yourself.  In like fashion, cancer surpassed "natural disasters" to the tune of 10,080,000 to 6,076.


It was very falsely reported that 5 million people die each year die from heat.  The reality is not even close, no matter which data set you use.  Example: In the chart above, the statistical claim is that 48,000 people died from heat and cold exposure, in the Year 2019 ... not 5 million.  According to USA TODAY, two million people died from "extreme temperatures" since 1970.  This averages-out to 40,000 deaths a year in a 50+ year period, where heat deaths and cold deaths were counted together.  However ...

There was another statistical presentation which claimed that, in 2019 alone, there were 356,000 heat-related deaths.  However, the same paper stated a statistic which lessened the impact of the 356,000 heat-related deaths.  There was the statistical allegation that 1,300,000 deaths of the same year were due to freezing.  This is not believable.  The allegation that 356,000 people died from heat, in 2019, is also not believable.  So, which data set are we to believe?

The Reason why "Global Warming" was changed to "Climate Change"

An undeniable scientific fact ... as undeniable as Medieval Viking artifacts being found in formerly warm Southern Greenland ... is that there was NO GLOBAL WARMING FROM 1999 TO 2016.  Thus, in order to retain the psychological terrorism on the under-educated human population of teenagers and pre-teen schoolchildren, the climate activists needed to delete the phrase, "global warming," and replace with something that sounded frightening.  As is proven in the very revealing Climategate Emails, the replacement phrase of "climate change" was conjured.  

This is a foolishly selected phrase, because climate can also change for the better.  That phrase was actually replaced by "Extreme Weather Events."  And, when one scours through the history sources such as chronicles, nothing is more extreme today than in centuries past, when it comes to weather events.

The important point in mentioning the aforementioned paragraph is that you can instantly detect a fraudulent academic paper, IF and ONLY IF the claim is that there was "global warming" for the first 15 years of the 21st Century.  For example, one very worthless paper claimed that mankind endured global warming from the Year 2000 to the Year 2018, and it resulted in 5 million heat-related deaths per year.

Once again, science officially identified the Years 1999 to 2016 to be years of NO GLOBAL WARMING.  And more importantly, there is nowhere in worldwide statistics & in the record-keeping world that a number exists even close to five million people dying of heat per year.  The highest statistical number was 356,000, and the lowest statistical number was 40,000.

You need to understand that climate doomsayers outright lie about the facts.  And of course, the number 1 piece of evidence proving these doomsayers to be liars are the newspaper editions of the 1870s, 1890s, 1900s, 1910s, 1920s, and 1930s, when it comes to heat ... and the editions of the 1940s, 1960s, and 1970s concerning the temperature decline which was correctly reported in the Briffa temperature graph, but which was fraudulently omitted from Michael Mann's blatantly fraudulent hockey stick graph.  Then comes almanacs, chronicles, captains' logs, and even monastery receipts.  Those receipts proved that grapes were being successful grown in Northern England and Denmark, during the Medieval centuries.

Briffa Included the Temperature Decline of the 1960s and 1970s

Mention of the Briffa graph was already addressed at the Blue Marble Album, and there is a search box at the top right-hand corner of the Blue Marble website.

The doomsayers' claim of a Western US drought worse than anything in the past 1,200 years

The West has been known to get yearly Monsoons as recently as last year (2022).  If there presently is the worst drought in 1,200 years, then Arizona, New Mexico, Nevada, California, and Utah would have become ghost town states, by now.  Texas would be the land of the great climate exodus, with Texas "climate refugees" endlessly rolling into Louisiana.  Yet, the population of Texas has grown, along with those of Nevada and Utah.

Such a drought would have been front page news, with graphic photography that can fill a museum.  We've had no such iconic American drought photos since 1936, except for some California fire photos & videos which reminded us that neglected fallen-trees become dried kindling that does a much better job than do blue-tip matches, when it comes to starting and perpetuating a massive fire.

The government employees, grantees, and contractors who make these "alarming climate calamity" predictions get LOTS OF TAXPAYER DOLLARS, if and only if they claim that things are terrible and that the world's going to end soon without the American taxpayer shelling-out billions more (to the exact same scientists who failed to decrease co2 in the past 22 years), to save the planet.

Conversely, those same people get no taxpayer money at all, if they say that the climate is under control ... and that there is no climate crisis today any worse than there was in the 1500s or in the 1700s or in the 1900s.  So, they cry out the most profitable phrase of them all, namely "Climate Wolf!"  

In the alternate, they cry-out, "The sky is falling, from all that co2 up there" --- all one-half of one percent of it in the Troposphere (0.042%)... and much less than 0.042% in the Stratosphere.  As a result, an entire generation of useful idiots joined the political movement of the enriched doomsayer scientists and the heavily enriched non-scientist activists.  

That generation will be expected to pay-off the overwhelming American national debt of $32,000,000,000,000 ... thanks to the 108th U.S. Congress all the way to the 117th U.S. Congress, and all of the long-term politicians who inhabited the U.S. Congress from 2003 to 2022.  The youth of today will have to pay the bill for all of the unjust enrichment that scientists and activists enjoyed, under the claim that we are in a climate crisis.

Australia & America:  A climate world apart, due to the Coriolis Effect

Concerning Michael Mann's audacity in stating that both the American West and Australia are going to very soon create mass sums of climate refugees, let's review:   Firstly, he and Hansen and even Gore stated similar things years prior, and this has not happened.

Secondly, due to the existence of  ENSO (already mentioned multiple times at the Blue Marble Album and elsewhere), the weather of Australia and Western America has "an inverse relationship."  So too is this the case with Indonesia and America.  That is to say, the opposite happens in Australia to that which happens in the American West.  Indonesia, too.  Those two general geographic territories are not on the same page.  After all, look at a globe or a world map.  The only way in which these two different and very distant parts of Planet Earth can have the same weather is if and only if Planet Earth suddenly becomes flat.

The reality is that, from 1895 to the Year 2010, an average of 14% of America endured a D2 drought (severe) and/or a D3 drought (extreme), constantly.  Of course, co2 levels were quite low from the 1890s to the 1920s to the wartime 40s and even during the Vietnam-era 1960s.  In fact, even in 1965, when the Beatles made world  history, the co2 count was 100 parts-per-million LOWER than it is today.  Even when the co2 count was below 300 ppm, the American West hosted long-term droughts, in the plural, long before the arrival of the European explorers. 

This indicates that somewhere in the continent of America there are always drought conditions.  This includes today.  As for the Spring of 2023, where would the drought be, if not in the former Wild Wild West?  ANS:  For mid to late May 2023, try Kansas and Oklahoma, as well as the Tampa Bay area, ironically enough.  Florida was supposed to have gotten a thousand year storm in April.  Yet, the West Coast of that State is in need of rainfall in May ... of the same year.  True thousand year storms aren't so narrow in scope.

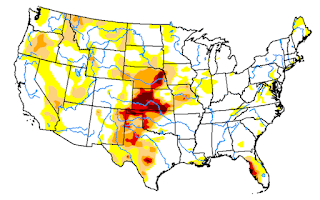
USA, May 2023.  Look at the "Bread Basket of America" and remember the 14% observation.

Okay then, back to the claim that the American West has been under a dreadful drought for decades.  Well, if this is the case, then the water levels of all the dams and/or tributary lakes and/or reservoirs in the West will be drained down to their dead pool levels.  The reality is that no such thing is even closely occurring out West, despite the increase in a water-consuming population there, dating back to the opening of Lake Mead and the Hoover Dam.  Look for yourself.  BTW, there is an article (discourse or post or writing) on Lake Mead at the Blue Marble Album.  This is why it isn't mentioned in this post.  And of course, the Blue Marble Album still has a search box at its top right-hand side.

State by State Analysis

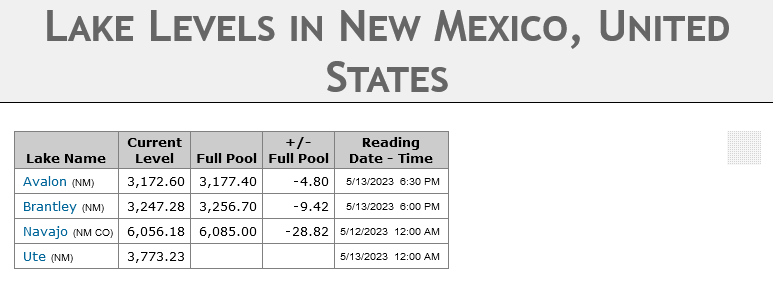
Firstly, New Mexico was mentioned by name as being a sovereign state severely afflicted by drought. Well, its four major dams are almost topped-off.  Where's the drought there?

Note:  The Navajo Dam is on the San Juan RIVER.  That river is a tributary river to the famous Colorado River.  Plus, the Ute Dam is on the Canadian River, in Logan, N.M. That river is a major tributary river to the Arkansas River.  The Ute Dam was constructed in 1963.

 
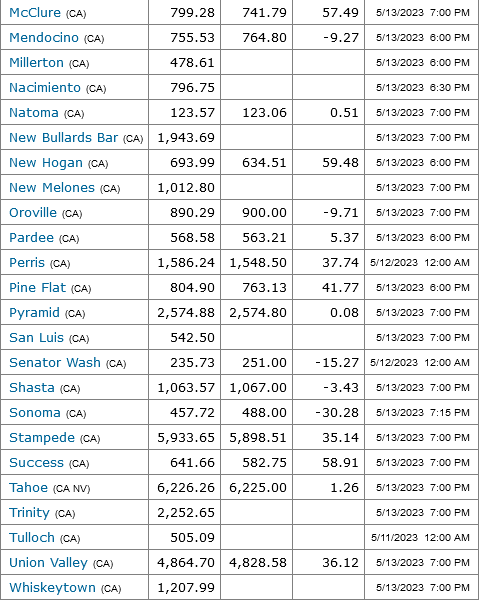
Let's see the sovereign state of California which is said to be in the death-throes of drought. It looks like you have a greater chance of drowning in California than dying of dehydration there.

 
Utah was also reported as being severely water-deprived more than usual.  False report.

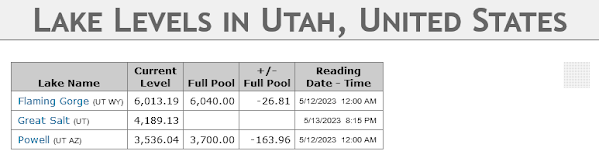
Arizona was said to be in really really desperate conditions:

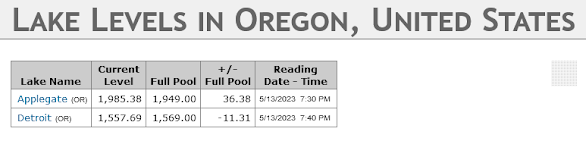
And next, Oregon. Drought?  What drought?

Texas was said to be one big dried-out desert.  Well, if there were no water there, there wouldn't be people there, either.  It appears that there's a lot of water in dry dry Texas.  Let's see for ourselves:

Colorado was mentioned too, in all of the doomsday reporting.  Let's see how doomsdayish Colorado looks in the Springtime of 2023. 
Do you get the message, yet?  Or have you been so severely brainwashed by commercial TV, the American Public School System, Michael Mann, Jim Hansen, John Kerry, & Al Gore that you are incapable of thinking your own free thoughts?   Do you miss your own personal opinion, or do you bind yourself to whatever your fifth grade teacher told you to do for the rest of your life, in the name of  your carbon blueprint, for the sake of an atmosphere which is already 99.9734% carbon-free?
  
Also for the record, the most recent End of the World prediction ...
 
... before the 2030 end-of-the-world prediction ... before the 2020 Glacier National Park failed prediction ... before the failed Maldives-sinking-in-the-ocean prediction for 2018 ... before the failed Ice-free Arctic prediction assigned for the Year 2014 ... 
 
... there was a doomsday prediction for the Year 2000, and it came from the U.N. in 1989.  Observe:  "... official says entire nations could be wiped off the Face of the Earth by rising sea levels if the global warming trend is not reversed by the Year 2000."  That prediction was yet another FALSE PROPHECY.  And the false prophesying continues. 

The world is always coming to an end, when it comes to money-grabbing activists and unemployed scientists.   The truth is that you have more of a chance of dying during a Nuclear Winter than during a phrase of Global Warming.  Such phases have come in cycles, mostly due to multi-decadal ocean oscillations and perhaps due to sunspot activity.  The opposite thereof was the case between the Years 1645 and 1710, when sunspot activity was often on vacation, and when ice festivals on the Thames River were an easily accommodated Winter tradition.

This trend of climate doomsayer theft-by-deception has been ongoing for over THIRTY-FIVE YEARS.  Some of us are old enough to have remembered the original bull crap.  Others are not old enough to have remembered, and they ended up making worldwide jackasses out of themselves on national & international TV.
 
Well, at least the CO2 police assigned the predicted doom-events to be even-numbered years ending in zero.  This includes the Next End of the World (having been assigned the Year 2030) and the Former End of "Entire Nations" (having been assigned to the Year 2000), as well as the Extinction of Glacier National Park's several glaciers (predicted to be gone by 2020.)  By the way, are those pesky things still up there?