The following was written in 2022. But, it is far more pertinent today, in light of the continuing hoax which claims the world to be in a Climate Crisis. There are over 60 climate-related discourses here, to prove the sky-is-falling claim to be an insult to a reasonable person's intelligence. And they are supported with numerous pieces of evidence which, predictably enough, is known as "Evidentiary Support."
In as much, if you don't at least look through the numerous pieces of evidence here, then you have zero right to speak on the subject. Mentioning one biomarker ... one statistic taken out of context ... is the sign of someone easily persuaded and therefore easily duped. Of course, the rise in CO2 is the sole marker cited in doomsday diatribes. Yet, the amount still is a mere trace amount in the atmosphere which is 78% Nitrogen, 21% Oxygen, 9% Argon, and a mere 0.044% of CO2 which has three vibrational modes, one of which renders CO2 incapable of capturing Infrared Light.
Ironically enough, like a typical dictator, Al Gore refused to entertain conversations and debates about his doomsday climate claims. This is because he knows that he will lose the debate ... the cross-examination. In the words of Jackie Gleason (super famous TV host of the 1960s) "And away we go."
🌐🌐🌐🌐🌐🌐🌐🌐🌐🌐🌐🌐
Let us begin with the various fire & incident frequency charts provided to the public by the London Fire Brigade. Concerning Greater London's size, it encompasses an area of 610 square miles.
Keep in mind that, during July of 2022, the media kept stating that the rise in atmospheric co2 was finally causing an out-of-control rise in Greater London fires. Well, the opposite is true.
From the Year 2004 to the Year 2022, the annual number of London Area fires were cut in half, in comparison to the fire numbers ranging from 1969 to 2004. In fact, each individual year ... from 2004 to 2022 ... was 1/3 of what it was in 1976.
Moreover, the year prior (2021) was the year of the least number of fires in the record-keeping history of Greater London. Meanwhile, the Year 2022 had the fourth least number of fires in the Greater London area ... since the beginning of record-keeping there. In fact, while the atmospheric co2 level was rising throughout the years 2004 to 2022, the number of Greater London fires continuously decreased. Therefore, an elevation of co2 will NOT cause your city or town to dry-out & burn-up. See for yourself.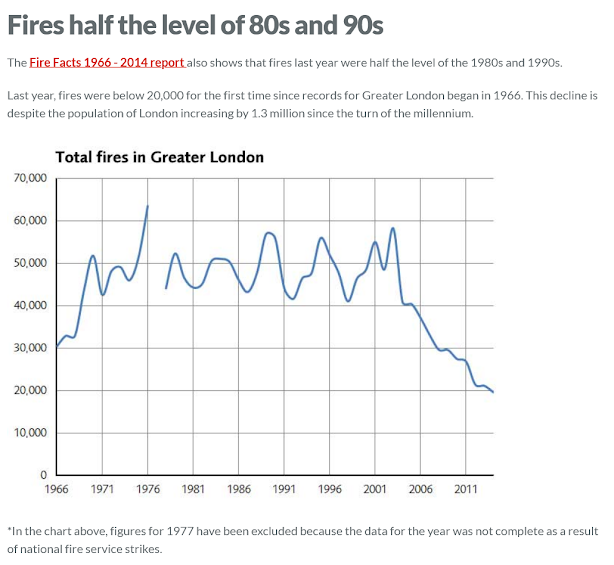
In July of 2022, the media
claimed that atmospheric co2 finally reached a tipping point. In July of 2022, the same media began the countdown to the End of the World ... proverbially speaking. On the 19th of that month, the London Area thermometers went above 100F. In London, the official reading was 102F. In a town located 11 miles west of London, the reading was 104F, for two hours only.
The claim
was that co2 was
saturating the atmosphere so badly that it was now causing London to
dry-out and burn out-of-control. The newscasters claimed that, on July 19th, the London Fire Brigade had its "most incidents" since the bombing of London, in WWII.
The same media said that the London Area had the most fires in any one day, on July 19, 2022. The truth is that July 19, 2022 wasn't anywhere close to that. In comparison to any WWII air raid, the July 19th incidents was less than chump change. Compared to the daily average of fires in 1976, the number of fires on July 19th was 52 fires LESS.
Compared to the daily average of Greater London fires in 1970, 1975, 1979, 1983, 1984, 1989, 1990, 1994, 1995, 2000, 2001, 2003 and a few other years, the number of July 19th fires were 24 to 38 LESS. At the very least, there were approximately 2,500 Greater London days that had more fires than did July 19th day. Reporting July 19th as the worst day since a world war was like lighting a candle with one matchstick and claiming it to be a 5-alarm fire.
In the entire Year of 2022, there were 19,297 fires in the 607 sq mile area known as Greater London. In 1976, there were over 60,000 fires in the exact same area. In 1989, 1990, 1995, and 2003 there were over 55,000 fires EACH YEAR, in the exact same Greater London region. More important is the fact that, in every year from 1969 to 2005, there were at least 40,000 fires. That amounts to 37 consecutive years when the yearly fire count was at least TWO TIMES MORE than it was in 2022. This also amounts to an average of 164 fires per day during 1976 versus an average of 53 fires per day in 2022.
Now, July 19 was an average day in terms of "incidents." The daily average for 2022 was 343 incidents per day. In 2022, 47% of all Greater London incidents were false alarms; 59,415 of them.
On July 19, 2022, there were 362 incidents. On that same day, there were 142 false alarms. There were 112 fires on that day, and that number has an ironic twist to it. This is because the daily averge of fires from 1970 to 2004 were at least 109. Thus, July 19, 2022 was an average day, when looking at the big picture.
A complete London Fire Brigade Incident Record for July 19 can be found directly below, via 7 photo-copies. You can do the statistics yourself.
https://www.bluemarblealbum.com/2024/05/July2022-official-greater-london-fire-stats.html
Let's review this correctly, without any sleight of hand con artistry:
Between 1970 and 2004, the 610 square mile region known as Greater London had between 109 to 164 fires PER DAY. This translates into 60,000+ fires per year and 40,000 fires per year. Then, in the Year 2009, yearly London fires decreased below 30,000. Then, in 2014, yearly fires decreased to 20,000 per year. So, between 2015 and 2022, Greater London had an average of between 41 to 55 DAILY fires. Thus, it was an unconscionable lie to have stated that Greater London's climate had gotten out of control. The opposite was true.
The number of London fires were literally cut in half, while co2 increased significantly in the atmosphere. Thus, a courtroom lawyer could actually tell a jury that the rise in co2 caused a decrease in London fires. Yet, the truth is that co2 remains at such a small atmospheric level that it can't affect the air, either for good or for bad. The only greenhouse gas which holds influence is water vapor. In fact, Cirrus clouds retain infrared light more effectively than does co2.
The atmosphere is humongous. Acres of plants, trees, weeds, and blades of grass are all tiny, in comparison. CO2 drives the biosphere; not the atmosphere. The other greenhouse gases ... other than water vapor ... are too small in quantity to drive any air mass greater than a laboratory experiment chamber.
Ther article below is "truncated." It's only part of the whole. The entire article can be found by clicking here:
Back to 2022
The pronounced decrease
in Greater London fires occurred while the population of the area
increased by 1,300,000 people. Now, an increase in population brings
with it an increased probability of fires. However, despite the
simultaneous increase in the London Area population and in the
atmospheric CO2 level, Greater London achieved an eighteen-year-long
streak of consistently decreased fire event numbers. Thus, CO2 is not
as powerful as the media claims it to be, in killing-off society. The
asininity of demonizing CO2 is that, without CO2, life on Earth ceases.
After all, CO2 is the activator of photosynthesis.

At
this point, keep in mind that the media in July of 2022 showed houses
or small buildings on fire, as if CO2 caused spontaneous combustion
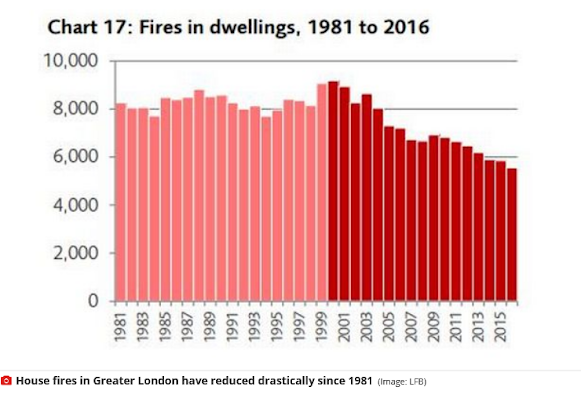
throughout London. "Chart #17" below is from the London Fire Brigade,
and it mentions that "House fires in Greater London have reduced drastically since 1981."
This decrease occurred while co2 levels were rising and while the
population of Greater London was rising by an additional 1.3 million
people.
This
proves that in no way did the constant rise of atmospheric co2 cause an
increase in Greater London fires. Thus, the 2022 London news reports
were all scams. It was one big false alarm. In as much, let's view
additional evidentiary support provided by the London Fire Brigade:
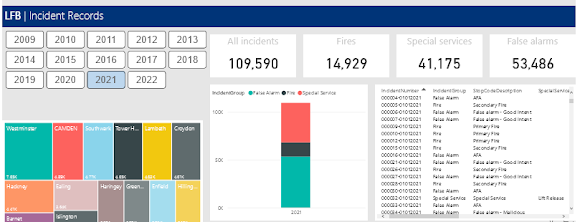
Above:
The stats of 2021. That's last year. Last year was the year of the
LEAST NUMBER OF FIRES in the London Area, in all of London's recorded
history. In as much, 14,929 is much less than 40,000.
Most
important is that the co2 level of 2021 was the exact same co2 level of
2022, minus an insignificant one and a half parts per million. The
exact same co2 level gave the 610 square mile London Vicinity its LOWEST
AMOUNT of fires-per-year, ever since record keeping began. Thus, we
have 100,000% proof that the co2 level of 2022 did NOT cause London to
catch on fire, as the media very falsely claimed, to its future legal
detriment.
Above
are the stats for the Year 2020. This is the year with the second
LOWEST number of fires. 17,409 is also much less than 40,000.
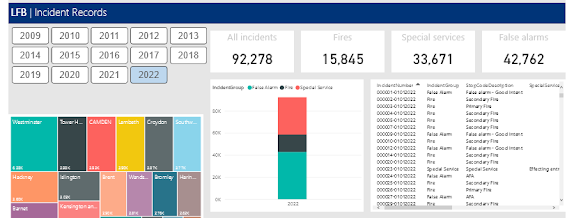
Directly
below are the stats for the Year 2022, as of October of that year. The
Year 2022 will be one of the lowest incident & fire years on
record. In fact, it thus far is the year with the least number of
incidents, depending on the November & December stats. But as far
as goes its final tally for fires, that is projected to be about 18,000
to 19,000, if this chart (posted in November) includes the October fire
statistics. If the chart below only includes the stats up to September,
then the projected sum total is 20,000 to 21,000 for the year. This
also is much less than the typical 40,000+ yearly fires that occurred
between 1968 and 2004.
 |
| This was "as of September 2022." |
 |
| This was 2022 in its entirely; the fourth lowest number of fires in its record-keeping history. Take note that there were 59,415 false alarms in the same year. |
Below
is the Year 2009. It's posted here to show you that other years had many more
fires than did the Year 2022, in addition to what the 2014 London Fire
Brigade graph showed. The 29,591 fires of 2009 are much more than the
14,929 fires of 2021 and the 19,297 fires of 2022.
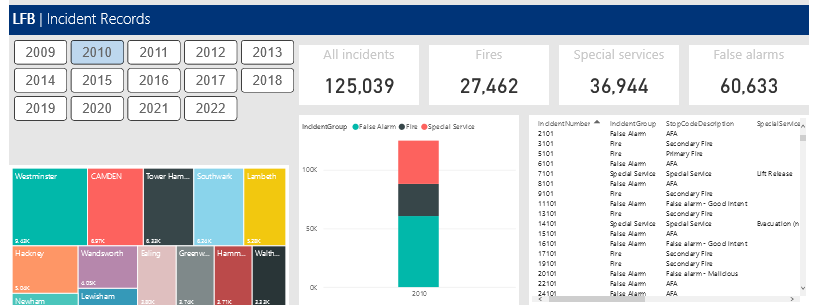
Below
is the Year 2010, posted to show the same. The 27,462 fires of 2010
are a whole lot more than the 14,929 fires of 2021 ... and the 19,297 fires of 2022. Thus, there was no
co2 saturation burning-up Greater London. It was all a lie.
And
of course, in order to show that there is no cherry picking going-on
here, the Year 2011 is included. Its fire numbers are also much higher
than those of 2022, as well as 2021. Thus, 2022 was NOT the tipping
point in any capacity. It was merely another year where the media once
again lied to the public.
Many
other years had averaged many more calls (incidents) per day than 2022
... and 2011. In fact, the Year 2009 had an average of 370 "incidents"
(fire calls) per day. After all, it had 134,379 incidents. There has
always been a high number of fire-calls ("incidents") in Greater London,
in any one day. There were 350 "incidents" throughout Greater London, in 2022. The average daily incidents for the entire year of 2022 was 348. That was typically average ... not a record-breaking day.
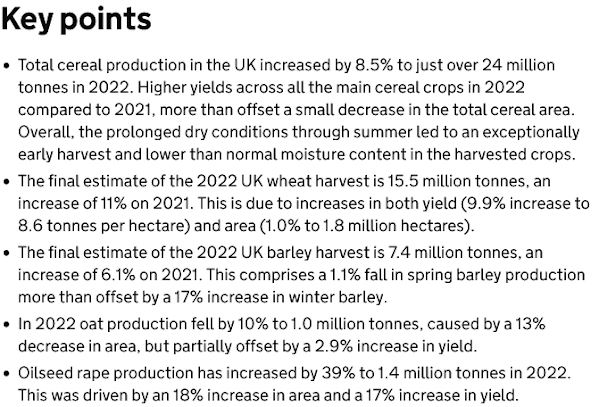
UK's 2022 crop yields also prove the London-is-burning-due-to-co2 alarm to be a false one.
Now, when you see a fire occurring near green grass and green
leafage, the fire is not fueled by dried-out grass and leafage.
Moreover, being that the media claimed England to have been the victim
of drought and heatwaves in the Summer of 2022, one would logically
conclude that the 2022 harvests of the UK would be dismal crop failures. Well, they
turned out to be very healthy crop yields, thereby showing the July 2022 media members to be a cabal of sophomoric liars. Observe:
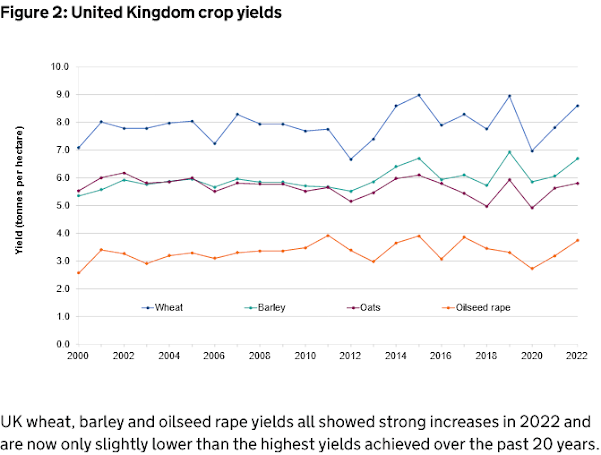 |
No downhill sliding board here. Steady crop yield pattern, with increases, since the Year 2000.
|
In
2022, the UK enjoyed an 8 1/2% increase in cereal grains. It was simply that there
was an approximate 1% less and a 1 1/2 % less moisture content in the
harvested grains than average. So, where is the great co2 disaster in Britain, during 2022. The agricultural industry didn't see one, at all.
None the less, wheat was up 11% and barley was up
6%. The UK's main oilseed harvest was up by 39%, but the crop yield
increase was only 17%, being that the UK used more farmland for planting its main oilseed crop.
In fact, the UK used 13% less farmland for oats, and the oats yield for
2022 was surmised (estimated) to be 10% less than last year. Technically, this translates into a humble 3% increase for UK oat farmers, per acre.
Conclusion: There is no man-made-co2 driven climate catastrophe occurring in Greater London.
Concerning the commercial media networks' claim that mankind has to
aggressively rid the atmosphere of the industrial "carbon footprint,"
you need to understand the following facts: The atmosphere is made of
[1] 78% carbon-free Nitrogen, [2] 21% carbon-free Oxygen, [3] 0.93%
carbon-free Argon. Thus, the Earth's atmosphere is already at least
99.93% carbon-free.
Know that the concentration of co2 in the atmosphere is so low that,
for every 2,398 molecules in the sky, only one of them is co2. One more time: Outside in the sky, there is 1 and only 1 co2 molecule for every 2,398 molecules out there. Round it off to 1 co2 molecule for every 2,400 molecules in the atmosphere.
China, India, & Indonesia are the present concerns: Not London.
The
only valid present concern is whether the construction of multiple
Chinese, Indian, & Indonesia coal power plants will result in the
aggressive rise in atmospheric co2, or will there be carbon capture
technology provided with each new coal plant. An aggressive rate of rise changes the picture, moderately for the present --- but significantly for the distance future, as in the next century.
At present, there's not an immediate hysteric
concern. No scientist publicly claimed that the world is coming to an end, due to "greenhouse gases" in twelves or in 112 years. However, the recent history of Beijing does not give
humanity much trust in the ruling political political of today's China,
not to mention the ruling parties of India & Indonesia. So, we cringe, wondering what
will become of the atmosphere in the decades to come.
This is why
hoaxes like the London one have to be ejected from society's concerns.
China, India, & Indonesia are what count. Not London and not
healthy Australia ... and not the American Southwest which got its share of monsoon rains in recent years. Moreover, there is the issue with Mercury and Sulfur Dioxide when it comes to coal use. That must be addressed more so. BTW, refusing to go to high school in Sweden isn't going to help, at all.
Qualifying Note: The Sulfur Hexaflouride issue is the other important concern at present. That one can still be proverbially nipped at the bud, though. However, you don't jag around with something like Sulfur Hexaflouride. You cut to the chase and get the task done. The task is finding its substitute. It's all too tempting for industry not to do so.
We proceed to 1901, 121 years before the July 2022 day placed under amplified attention by the media. July 19, 2022 was presented as the unprecedented beginning of the End of the World. The media claimed that it was a day unprecedented in the history of England. They lied. The truth is the climate is CYCLICAL --- unless something. In as much, the Year 2022 was little more than the Year of the Great Deja Vu ... of 1922. Enough newspaper photocopies on that year are already posted at thr Blue Mrble Album. We'll go back further, to 1901, so that you can see that "this" has all been seen and experienced before, time after time.
Let's sail over to Italy, to see how it was doing in August of 1901.
It is often stated that "history repeats itself." Well, that is the
historically proven case, concerning Climate History. And remember, in 1901 the co2 level was a mere 296
parts per million. The co2 count was 121 ppm LESS than today. It was 29% LOWER than today. Yet,
sweltering heat & much more dry drought-inducing heat occurred and reoccurred
throughout the first four decades of the 20th Century than today. This was when the co2
level was much lower than today.
In 2014, NASA declared that
the worst drought year in the past 1,000 years was 1934. The co2 level at he time was 309 ppm. That's 108 ppm LOWER than today. Yet, according to
the Al Gore theory, 2020, 2021, and 2022 should have been the worst
drought years. Well, contrary to what the media claimed, Arizona & Nevada have been getting yearly monsoon rains. This neglect of reporting the truth is the result of media's managers
wanting to deceive you into thinking that we are trapped in a deadly circle of Dante's Inferno. The truth is that we are doing nothing more than repeating history in a
cyclical fashion.
In caveman days, the co2 level was 260
ppm. And during recent heated eras, such as the Roman Warm Period & the Medieval Warm Period, co2 was
only 280 ppm. Today, atmospheric co2 is 421 ppm, and today's heat is quit only a repeat performance of the past. The two 1901 articles above are a small sample of the hundreds of
pieces of documentary evidence which show that a rise in temperature is not
dependent upon a rise in co2. Rather, according to ice core analysis, a
rise in temperature historically came first, resulting in added evaporation of ocean
water and the simultaneous emission of additional co2 into the
atmosphere.
Climate is a pattern --- not a week-long event or even a
month-long event. July
18th & 19th were the the result of a dry air mass from Northern
Africa. And yes, there were a couple weeks of no rain --- in July,
when such a thing is likely to happen. However, after July 19th,
everything instantly went back to normal. The "back-to-normal" part is
the climate.
To call July 2022 "unprecedented" makes
knowledgeable people roll their eyes and say, "Give me a break, and cut
it out with the theatrics." After all, there was such a thing as the Great Fire of London in 1666, along with ~the Great Fire of Tooley Street, 1861, ~the Burning of the Parliament, aka the Palace of Westminster (which was a complex of buildings), 1834, ~the Whitehall Palace Fire, 1698, ~the London Bridge Area Fire, 1633, the first London Bridge Fire, 1135, ~the Southwark Fire of 1212, ~the Great Fire of 1087, ~the Great Fire of Aldgate which burned all the way to Ludgate and which included St. Paul's Cathedral, 961, ~the Fire of 120 AD, when the Romans ruled.
And
of course, there were the fires caused by Boudicca's rage. Those were
not atmospheric science issues. In fact, the Great Fire of 120 AD could
have been an act of war, as well. None the less, calling the July 2022
London fires unprecedented invalidates a journalist, as much as does
calling July 2022 a co2 cataclysm. After all, the rise in co2 for the last 19 years was accompanied by a major decrease in London fires.
Now, Planet Earth has had atmospheric co2
at levels 9 times and even 16 times HIGHER than today. In fact, during
the
height of atmospheric co2, the
Cambrian Explosion occurred, resulting in the emergence of multi-celled
sea life. And later in history, when atmospheric co2 was 9 times higher
than today, the
Ordovician Ice Age was in progress. This assertion, of course, is all a
matter of "ice-core
proxy evidence," inter alia. --- (Inter alia means, "and other
things.") Incidentally, the "inter alia" included the stoma-count of
fossilized leaves. Stoma are openings in the leaves, where co2 is
absorbed.
Anyway, London had two back-to-back heat days, one week apart. The
first week comprised two 87 degree Fahrenheit days. One week later,
there was a 99 degree Fahrenheit day, followed by a 103 degree
Fahrenheit day. After the 103 Fahrenheit day of July 19, the temps
immediately went back to normal. But, the propaganda machines had a
field day with Britain's sole 100+ Fahrenheit day. Oh, it was
Armageddon 3.0, the Apocalypse 4.0, and the End of the World, squared
& cubed.
Needless to say, it was everybody's fault, for riding in
motor vehicles and keeping warm in the Wintertime, as well as using
evil evil air conditioners in the Summertime.
Below is the
London Temperature Calendar, for July 2022. Here's the London that was
presented by the media as an overly heated inferno. Show me where this super
oppressive, long-term, human-body-killing heat is, in the London Summer
of 2022. Yes, there are a couple of weeks of temperature anomalies, in London. But, there was nothing that resulted in the death phrases "may have caused" and "likely to have caused." This was followed by a ridiculous number Paris experienced in 1976 & 2003.
And of course, there was so much misinformative hype about Paris in July of 2022 that it insults the intelligence. Those news articles use the phrases, "likely to have caused" and "may have caused" a certain number of deaths that equaled the deaths suffered by Britain, during the first day of the Battle of the Somme. None the less, deadly heatwaves, deadly droughts, deadly storms, deadly floods, deadly pestilence, deadly algae blooms, hurricanes, blizzards, cold snaps, Yellow Sky days, ice stacking, glacier growths, glacier meltdowns, etc, etc, etc. It all happened throughout the past 700 years.
The sophomorically trained and sophomorically educated journalists look for that one tipping point moment. Climate is an habitual trend ... NOT a one-day, two-day or even two-week event. Here, see the temperatures of July 2022 yourself.
In Celsius:
In Fahrenheit:


