March 22, 2025

Review of Springtime 2023: The American West's Water Levels

New Mexico, during one of my long distance road trips.
Note:  The current Spring 2023 lake level tables for California, Nevada, Utah, Oregon, Colorado, Arizona, New Mexico, & Texas appear at very end of this post.  If you are short on time ... or if you have trouble reading (which is understandable) ... then skip down to the tables, aka charts, so that you can sigh with some measure of relief.

Hello there, boys & gargoyles.  Welcome to Pat the Wonder Rat's School for Figuring Stuff Real Good ... or Really Well ... as in "Let's make this real."  Let's find out the truth, once and for all, about the topic at hand:  

It's another one of those Chicken Little topics.  This topic involves the claim that the American West is presently undergoing its worse drought in the past 1,200 years.  In fact, it's attached to the claim that, in 2022, a five mile stretch of the Rio Grande River dried-up.  

At the outset, this allegation is contradicted by the fact that NASA had already declared the Year 1934 as having been the worst drought year in the past 1,000 years.  And that Rio Grande River report was easily proven to have been a complete lie, and evidence showing the Big Rio Lie is here, at this site.


Preview:  It's very elementary, Watson.  If there were a 20 year drought in the American West, the entire West would have become an array of ghost towns by now, with little more than tumbleweeds remaining.  

Liars have a way of failing to match observed reality while telling their lies.  After all, during the time span when the former Wild Wild West was supposed to be having its worst drought in the past 1,200 years,  [1] Texas' population grew 20.68% and  [2] Nevada's population grew by 19.45%.   Meanwhile, [3] Utah lead the nation in population growth, to the tune of 23.88%.  This pertains to the US Census Years of 2009 to 2019.  

A  memento of my time out West ... in the former Wild Wild West.
Funny how the End of the World keeps getting postponed, decade after decade

It was the Year 2006 when Al Gore made his bold hurricane prediction, along with his sea level rise prediction.  (A) Since then, a grand total of one and only one Category 5 hurricane made landfall upon the continental United States.  It was Hurricane Michael, in 2018; twelve years after Gore made his Category 6 hurricane prediction.   (B) Since 2006, eight Category 5 hurricanes developed in the Atlantic Basin, and that's an average of one Cat 5 hurricane every two years.  (C) As far as goes Category 5 hurricanes making landfall upon the continental United States in the past 100 years, the number is ONLY FOUR --- (i) The 1935 Labor Day Hurricane, (ii) Hurricane Camille in 1969, (iii) Hurricane Andrew in 1992, and (iv) Hurricane Michael in 2018.  

(D) As far as goes all Category 5 hurricanes that developed in the Atlantic Basin in the past 100 years, the number is 39.  This amounts to one Cat 5 hurricane every two-and-a-half years.  

These are NOT end-of-the-world numbers, especially when making comparisons to the past seven centuries.  Florida's history of approximately or exactly 180 cyclones since 1523 will be the example for you to gloss-over, skim-through, or even peruse like Sherlock Holmes, if you desire.

                  See: https://detailedpedia.com/wiki-List_of_Florida_hurricanes_(pre-1900)

          Also see: https://en.wikipedia.org/wiki/List_of_Florida_hurricanes_(pre-1900)

These are the tracks of each Florida Cyclone, from 1851 to 1899 ... and only from 185 to 1899.  In that time span, atmospheric co2 was 285 ppm to 295 ppm.  That amounts to 125 ppm to 135 ppm of co2 LOWER than today's atmospheric amount.  According to Al Gore & Michael Mann, those cyclones and cyclones dating back to 1523 should not have occurred so frequently.   
And for the record, the most recent stat on sea level rise is that it rose 9.96 inches, from the Year 1890 to the Year 2021.  That amounts to one inch every 13 years.   

From 1970 to 2021, sea level rose 8.8 mm -- 3.46 inches.  However, a non-government entity who will remain nameless out of politeness claims that the sea level rise was much higher.  The claim was that sea level rose 3.6 inches since 1993, instead of 3.5 inches since 1970.  

During the "Biden Years," it is now being claimed that, all of a sudden, sea level rise will occur at a rate of one inch every 6 1/2 years.  Being that this is not intended to be a political post, nothing more will be stated here.   However, the following may enlighten you.  It deals with the fact that Joe Biden had TWO brain surgeries due to aneurysms, in 1988.  No further comment on this will be made.

See: https://www.latimes.com/archives/la-xpm-1988-02-14-mn-42679-story.html

Also: https://apnews.com/article/e35733e8b2c96e0f46608c4773700292

None the less . . .

This brings us to a question:  Whom are we to believe about conflicting sea level reports and predictions?  ANS:  The ones who have been living on the coastlines for the past 20 and 30 years.  They'll tell you if there is an encroaching sea level rise that will wreck civilization or not.

(E) And of course, the continental United States went 12 consecutive years without being visited by any major hurricane.  This occurred between Hurricane Wilma and Hurricane Harvey.  The years spanned from 2005 to 2017.  The irony is that the longest absence of major hurricanes in the history of  America began the very year Al Gore predicted that an onslaught of Category 6 hurricanes would smash into American regions such as  . . . all of Florida.   

BTW, in 2022, Hurricane Ian arrived as a Cat 4 hurricane ... and not as a Cat 5.  

(F) In sequence, neither the Maldives nor Lower Manhattan went underwater, as was predicted to US senators in June of 1988.  All in all, the disasters predicted by Al Gore .. and Jim Hansen ... did NOT materialize.  Gore basically got the Nobel Prize for being a False Prophet, all the while making himself outrageously rich.

As a quick observation, if these predicted  calamities are finally going to come true now, then the hundreds of billions of US taxpayer dollars paid to scientists (to prevent climate disaster) was a complete waste of money, hundreds of billions of times over.  All of the UN climate conferences have been a waste of time and money, also.  This is because co2 rose from 360 ppm (in 1995) to 421 ppm (in early 2023).  

A 61 ppm rise in a full 22 years proves the climate conferences to be worthless as to their stated goals.  And the fact that there were far more turbulent weather events decades prior and centuries prior proves blatantly false the Al Gore Theory of Climate & Surface Temperatures.  A rise in CO2 does not accompany more turbulent and more frequent weather disasters, especially during the 12 years between Hurricane Wilma and Hurricane Harvey.

During the days when this type of ship ruled the seas, there were many weather disasters.  This meant that the winds & pressure systems on the high seas ruled the ships, instead.

Nothing New Today & Nothing More Severe than in Former Centuries

The great falsehood of the climate doomsayers is the claim that severe weather events only began with the invention of the internal combustion engine.  For example, both David Attenborough & Michael Mann claimed that the climate and all weather conditions were stable and calm for one thousand years prior to the 20th Century.  Disgraced NY Governor Cuomo said similar.  The truth is that weather events were more turbulent in centuries past, due to one scientific mechanism which appears in textbooks under the title, Pressure Gradient Force.

And of course, Sigourney Weaver became Hillary Clinton's surrogate liar in 2016, by claiming on national TV that, "This we have never seen before" ... concerning severe weather.  No Sigourney.  You were wrong.  It has ALL been done before.  

The truth is that history is filled with multiple weather disasters, even when the atmospheric co2 count was only 65% (two-thirds)  of what it is today (in 1610)   And for the record, the co2 count during caveman days was 61% of what it is today. 

There has not been any adverse climate trend or severe weather event today that was any worse than any weather event or climate trend of the 1500s, 1600s, 1700s, 1800s, and 1900s.  Throughout those centuries, there were horrendous weather disasters & life-changing weather trends which were far more turbulent than the vast majority of today's events.  In fact, there were life-destroying trends back then.  This included the December 1287 flood which killed 50,000 to 80,000 people and altered the coast of the Netherlands.  

The weather of the past 700 years included heat waves, droughts, crop failures, severe winds, cold snaps, blizzards, ice stacking, glacier growth, glacier melt, severe floods, epic Rocky Mountain forest fires, and sea storms that annihilated a couple military fleets, as well as numerous individual ships separated from their fleets ... along with ships that launched & traveled alone.  

Even if you go back a thousand years, you will find disasters such as the Great Coastal Flood of 1099 which killed approximately 100,000 Europeans in the British Isles & in the Netherlands.  The weather disasters included the 1315-1322 Great Famine of Central Europe which killed over 7 million people.  

The weather disasters of the past 700 years also included the 11 month-long Tudor Drought of 1540, along with the Great Storm of 1674 near St Augustine Florida, the oldest established city in the United States.  Then came the July 1743 China Heat Wave that reached 112F and killed approximately 11,400 people.  The disasters also included the ultra-devastating Yellow River Flood of 1887 which killed 930,000 people.  All in all, the weather events that today's climate doomsayers amplify are chump change in comparison to what came before us, throughout past centuries, with exceptions such as 1969's Hurricane Camille.

The pre-modern weather disasters included the Newfoundland Grand Banks Hurricane of 1775 which took 4,000+ lives.  Also in line was the 1776 Pointe-a-Pitre Hurricane which sunk 60% of the French and Dutch ships caught in its winds, as well as killing 22,000 people.  Six thousand of those fatalities were on Guadeloupe when the hurricane arrived.  

The Great Hurricane of 1780 followed suit, taking also 22,000 lives in the Caribbean.   In the Pacific was the JULY TYPHOON OF 1780 which was estimated to have killed 100,000, in the Philippines.  Typhoons would also hit the Philippines in 1782, 1783, 1792, 1793, 1795, 1797, 1802, 1803, 1804, 1809, 1810, 1812, 1819, 1820, 1824, and 1825.  Also in 1780 came New England's Dark Day, recorded by George Washington and others as having been on May 19.  

 There was the Miramichi Fires of October 1825, in New Brunswick, incinerating 2.5 to 5 million acres of forest, while killing approximately 200 to 300 humans.  This was when the co2 count was 284 ppm and during a month when things were supposed to be cool and moist.  If this happened today, the Bill-Gates-funded media would have blared it through trumpets, claiming it to be the sign of the End of the World.  Well, the world didn't end in 1825.

Later came the two most encompassing fires of them all, namely the Peshtigo Fire of 1871 (in Wisconsin) and the Great Michigan Fire, also in 1871.  The two fires charred 4 MILLION acres of Midwestern America.  Then came the Year 1881 which brought a true Yellow Day fire in Michigan, and it was followed by the Big Burn of 1910, effecting Idaho and Western Montana. 

Pre-modern weather events included the 1886 Great Fire of Calgary, in ALBERTA CANADA ... and the 1886 Great Vancouver Fire, also in CANADA ... along with the relatively nearby Great Fire of Spokane and the Great Fire of Seattle, as well as the Great Ellensburg Fire (also in Washington State), all occurring in 1889.  This was followed by the Great Fire of 1919, also in ALBERTA CANADA, as well as in Saskatchewan.  That fire incinerated 5 million acres of forestland.

Moreover, this all occurred when the co2 level was 295 to 303 ppm; 117 to 125 ppm LOWER than today.  Therefore, there is nothing new or apocalyptic about the 2023 Alberta Fires, other than it served as a reminder that neglected, "downed," and lifeless timber dries out, thereby becoming effective kindling.  Those were all tragic fires, throughout the centuries.  Today's fires are not more superior than fires of centuries past.  In fact, when comparing the aforecited fires to the historic Great Chicago Fire, the Great Chicago Fire doesn't even compare slightly.

Ice Jam Floods of the Renaissance & Elizabethan Era

And of course, there was the matter of "ice jam floods," during the Little Ice Age.  These consisted in wedges & blocks of ice lodged in waterways, causing water to backup.  These consisted in natural dams made out of ice ... and NOT caused by the burning of fossil fuels.

Incidentally, the Little Ice Age began with the arrival of the Wolf Minimum in 1284, and it ended with the arrival of the warm rain which incubated the very mobile water mold, Phytophthora infestans, in 1845.  The Year 1845 was the start of the Great Potato Famine  ... in Belgium & the Netherlands.  The water mold quickly spread to elsewhere, including Ireland.   None the less, in 1284, the atmospheric co2 count was 282, and in 1845, the co2 count was 284.  Yet, tremendously damaging natural disasters occurred during that time and long before it.  

The weather disasters during the Little Ice Age were many, and a few of them even included birds falling out of the sky, during sudden weather changes.  The raining of birds is not at all suspiciously non-believable, being that, in the 20th and 21st Centuries, it has rained small silvery fish, small frogs, and crayfish.  As a specific example, in 1873, it rained frogs in Kansas City.

In scouring through the chronicles, almanacs, captains' logs, and newspapers, you can add to the weather equation the wind-swept decimation of Kublai Khan's first invasion fleet of 1274 and the massive splintering of his second invasion fleet, in 1281.  Also add the Spanish Armada disaster of 1588.  This all happened when co2 levels were 120 to 160 ppm LOWER than today.  PPM stands for parts per million, incidentally.

As you can see, mankind survived very turbulent centuries, as well as having survived the horrendous 6th Century, with the Year 536 being the most traumatic of them all.  All in all, the most devastating of weather disasters did NOT come about by the burning of fossil fuels, especially when such burning was accompanied by modern filtration systems and catalytic converters.  The most disastrous climate disasters were the result of ===> volcanic activity which resulted in disastrous cooling trends.  

The disastrous result was due to sulfur dioxide blasting out of a volcano, into the atmosphere, causing sunlight to be reflected back into outer-space.  This is known as "albedo."  This is also known as the "aerosol effect."  And of course, no crop grows on glaciers or on frost or during frozen temperature intervals.  

What actually does cause deadly "turbulent weather?"

The reason why a mini ice age will result in more turbulent weather than a warming period is because of Pressure Gradient Force.  Very simply, the closer the temperature that exists between the Poles and the Equator, the more stable the atmosphere.  The greater the temperature difference between the Equator and the Poles, the more turbulent will be the atmosphere.  

During global warming phases, the temperatures between the Poles and the Equator become closer to each other.  After all, it's during Wintertime when the Polar Jet Stream meanders; not during Summertime.  In fact, in order for any tornado to form, a cold front literally has to "drop in."  Tornadoes are the opposite of global warming events.

All in all, remember the introductory law of Pressure Gradient Force, and even look-up "baroclinic instability," as well as "barotropic instability."  Add Eckman Transport to the reading list.  Eckman Transport addresses the oceans' angular staircase motion throughout layers of ocean water.  You need to learn these specific elements of atmospheric science & oceanography, in order to avoid being the useful idiot of Al Gore, Michael Mann, David Attenborough, the Third World Reps of the UN, and other individuals who have set their income goals upon American taxpayer grants and donation money from people who know nothing about atmospheric science. 

Australia Today.  Okay then, show me the Michael Mann Climate Crisis here.  Looks like he has been lying all along, and living without a conscience.

In direct contrast to the various End of the World Reports that never resulted in the End of the World, the following has recently occurred:

[1a] the Great Barrier Reef of Australia recently enjoyed replenishment.  [1b] Australia received its inland rains & ski lodge snow, as well.   [2]  The dams of the American West predominately enjoyed all of the ingredients that successfully replenish water levels there. 

[3a] Antarctica had its coldest recorded Winter in 2021, [3b] as well as having had its largest sea ice extent in 2015.  

[3c] In fact, it was found that, between 2009 and 2019, sixteen of the 34 ice shelves of Antarctica were growing enough to produce a net ice mass balance gain of positive 661 Gigatons.  It was found that East Antarctica's ice shelves let Antarctica grow another 5,305 square kilometers in ice, despite the 18 ice shelves in the West of Antarctica and on its peninsula which were retreating.  This translates into aggregate ice shelf growth of 2,048 square miles.   Basically, the climate doomsayers were lying to the world about Antarctica, hiding the fact that it was gaining ice mass, all along.

See: (European Geosciences Union, Volume 17 / issue 5 / TC, 17, 2059-2072, 2023 / May 16, 2023.) 

[Andreasen, J. R., Hogg, A. E., and Selley, H. L.: Change in Antarctic ice shelf area from 2009 to 2019, The Cryosphere, 17, 2059–2072, https://doi.org/10.5194/tc-17-2059-2023, 2023.]

Important   ====>   https://tc.copernicus.org/articles/17/2059/2023/?mc_cid=7a3485fd02

BTW, Antarctica's peninsula is outside of the Antarctic Circle.  In fact, it's closer to Argentina than it is to the South Pole.  This is understandable when you take into account the reality that Antarctica is 5.5 MILLION square miles wide.  It's the exact same size as the Arctic Ocean, on the other side of Planet Earth.  This brings the rationally minded person to a question:  Why is the South Pole all ice-covered terrain, while the North Pole is all ice-covered water the exact same size as Antarctica?

[4] Concerning the other side of Planet Earth, even in Western Greenland, the Jacobshavn Glacier was found to be regrowing, in 2017, 2018, and 2019, at last count.  [5] Also up north is England whose landmass experienced record low temperatures in 2023, despite the July 2022 claim that England was now going to be experiencing only dry record heat and fires all over the place.  

[6] Meanwhile, a multiplicity of nations enjoyed record crop yields recently.   [7] And you now have a new weather occurrence, as of 2023, and it is completely opposite of that which was predicted by Michael Mann, Jim Hansen, Al Gore, John Kerry, Bill Gates, David Attenborough, and a number of others who recently came into lots of American taxpayer dollars, ever so coincidentally =====>

421% of the normal for May.  319% & 327%, as well, thereby summing the equation up to a plentiful water supply ... and NOT a 20 year-long drought.  This summarily invalidates all of the climate doomsayer assertions, especially those from the ever so arrogant mouth of the present governor of California who blamed co2 on his absence of foresight.

Okay now.  We've been told that the American West has been enduring its worst drought in 1,200 years.  Well, the truth is that the worst drought there transpired between 1276 and 1299 C.E.  (Common Era.)  In fact, between 1903 to 1918 (when atmospheric co2 was very low) Arica Chile did NOT receive a drop of rain.  And NASA officially stated that the worse drought year in the past one thousand years was 1934.  This and other related topics were already addressed at the Blue Marble Album.

We have also been told that there is a Western American drought that has been ongoing for 20+ consecutive years, despite the Monsoon seasons that regularly visited the American West and which actually came from the Gulf of Mexico ... and NOT from the Pacific Ocean, during any La Nina weather system.  

In as much, wherever there are monsoons, there are NO droughts.  And what is a monsoon?  It's a sea breeze on a continental scale ... on a massive scale.  Even England has a Monsoon season.  It's called, the Return of the Westerlies. This explains the British male stereotype.  It was that of a man wearing a black derby hat, while carrying an umbrella with him everywhere he goes in England.

In re: The present dishonesty of the climate doomsayers, despite 35 years of failed doomsday predictions by which they should have admitted being in error long ago: 

Let's continue with the issue of the climate "experts" stating that the American West is trapped in a long-term drought.  Directly below is another official State of California conveyance, as of May 2023.  Ladies & Gentlemen ... Boys & Gargoyles ... this is the OPPOSITE of a long-term drought or a long-term "climate crisis."  This is the state of the State of California less than one calendar year after it was proclaimed that Planet Earth was in a catastrophic heat, drought, and city fire mode, as well as a forest fire mode.

You need to understand that politicians seek to deceive, while activists seek to intimidate.  Below is an official government illustration, aka chart, aka supplement to an official government report that certain politicians and activists do not want you to view.  The map up top focuses on specific locales.  This one covers all of California.

This is one of the many pieces of evidence ... spanning a 35 year period ... which shows that Michael Mann & Al Gore, as well as Jim Hansen, are NON-factual in their doomsday prophecies.


Despite the contrary reality, the hyper-theatrics of the climate doom scientists were megaphoned by the commercial media, Democracy Today, the U.N., and the state-funded National Public Radio.  Such propaganda would rationalize the $370 BILLION U.S. taxpayer outlay for the climate doomsayers.  There was also an outlay of $424 BILLION, during the final two years of the Obama administration.  So, I'll go look at the pertinent official statistics ... yet again ... and assess this doomsday drought assertion of the Michael Mann Hockey Sticklers, the John Kerry Frequent Fliers, & the Al Gore Carbon Taxers.  

If those doomsday assertions are correct, then the water levels of all the dams and tributary lakes (also reservoirs) in the American West will be near their "dead pool" levels.  And if this is the case, we have to immediately move tens of millions of people out of California, Nevada, Utah, Oregon, Arizona, New Mexico, Colorado, and Texas, as well as the Red Desert of Wyoming.  

For those unaware, "dead pool" is the water level at which a reservoir or basin or tributary lake can no longer flow downstream.  It's technically known as Minimum Power Pool Elevation.  In addition, when it comes to a water level enabling turbine power generating, "INACTIVE POOL," becomes a serious concern.  Inactive Pool is the minimum water level elevation for generating electrical power.

As an added educational note: When you see the phrase, "tributary lake" or "tributary river," think of a moving body of water "contributing its water" to another river or lake.

I shall return in a few hours, after checking out Western lake & dam water levels.   Tic/tic ... tic/tic ... tic/tic/tic.  Tic again. Tic some more.  Ticarooski. 

Okay, I'm all back and everything from doing all of that fact checking stuff, to see if there really is a drought in the American West by which the World needs to be saved by that muscular model of manliness, Michael hockey-sticks Mann, and that electricity-sparing wise budgeteer, Al carbon-credit Gore.  The conclusion is  ====>

Someone needs to grow up.  Or someone else needs to file a number of False Claims Act lawsuits, where "treble damages" are exacted upon the fraudulent receiver of federal dollars.  Treble damages mean "three times the liability price tag, exacted upon the wrong-doer."  A wrong-doer is known as a tort-feasor, in American law.   

All in all, you do NOT need to fear the doom-ridden 1988 predictions of the former director of NASA's NYC branch, Jim Hansen, in his 35 year old predictions which never came true.  After all, the Maldives did NOT go underwater, lower Manhattan did not go underwater, and the Arctic's closest event to an ice-free August was in 2012, when 1.32 MILLION square miles of ice remained on top of the Arctic Ocean during the hottest time of the year.  That is the size of India plus another 0.8 million square miles.  (India is 1.24 million sq mi.)

Covering the perimeter of that distance of ice was equivalent to flying 1,148 miles east to west and then 1,148 miles north to south.  That's close to flying from Boston to Milwaukee, and then from Milwaukee to Houston, followed by flying from Houston to Miami, and then from Miami back up to Boston again.  That sheet of Arctic ice was 6 times LARGER than the size of France, and it was the lowest amount of Summertime Arctic ice in modern history.  Yet, it was a lot of remaining ice.

Moreover, the UN recently lied when stating that worldwide fatalities due to weather disasters are on the rise.  The opposite is true.  Observe:
Looks like a Choir of Liars were singing to Greta T., deceiving her into believing opposite of the facts.

In the sample graph below ... of 2019 ... take note that the least frequent cause of death were "natural disasters."  IF and ONLY IF the climate doomsayer claims were true, the number of deaths caused by natural disasters would have had skyrocketed decades prior.  However, that type of cause of death is still at the bottom of the statistical list.  

This is yet another piece of evidence proving that the hysterics presented by Al Gore, Michael Mann, the third-world-country reps at the UN, Jim Hansen, Bill Nye, and several others are outright fraudulent.  Deaths by cause of Natural Disasters have ridiculously low numbers compared to all of the other causes of death.  Heart disease is the #1 cause, as in 18,560,000 vs 6,076 natural disaster deaths.  Look for yourself.  In like fashion, cancer surpassed "natural disasters" to the tune of 10,080,000 to 6,076.


It was very falsely reported that 5 million people die each year die from heat.  The reality is not even close, no matter which data set you use.  Example: In the chart above, the statistical claim is that 48,000 people died from heat and cold exposure, in the Year 2019 ... not 5 million.  According to USA TODAY, two million people died from "extreme temperatures" since 1970.  This averages-out to 40,000 deaths a year in a 50+ year period, where heat deaths and cold deaths were counted together.  However ...

There was another statistical presentation which claimed that, in 2019 alone, there were 356,000 heat-related deaths.  However, the same paper stated a statistic which lessened the impact of the 356,000 heat-related deaths.  There was the statistical allegation that 1,300,000 deaths of the same year were due to freezing.  This is not believable.  The allegation that 356,000 people died from heat, in 2019, is also not believable.  So, which data set are we to believe?

The Reason why "Global Warming" was changed to "Climate Change"

An undeniable scientific fact ... as undeniable as Medieval Viking artifacts being found in formerly warm Southern Greenland ... is that there was NO GLOBAL WARMING FROM 1999 TO 2016.  Thus, in order to retain the psychological terrorism on the under-educated human population of teenagers and pre-teen schoolchildren, the climate activists needed to delete the phrase, "global warming," and replace with something that sounded frightening.  As is proven in the very revealing Climategate Emails, the replacement phrase of "climate change" was conjured.  

This is a foolishly selected phrase, because climate can also change for the better.  That phrase was actually replaced by "Extreme Weather Events."  And, when one scours through the history sources such as chronicles, nothing is more extreme today than in centuries past, when it comes to weather events.

The important point in mentioning the aforementioned paragraph is that you can instantly detect a fraudulent academic paper, IF and ONLY IF the claim is that there was "global warming" for the first 15 years of the 21st Century.  For example, one very worthless paper claimed that mankind endured global warming from the Year 2000 to the Year 2018, and it resulted in 5 million heat-related deaths per year.

Once again, science officially identified the Years 1999 to 2016 to be years of NO GLOBAL WARMING.  And more importantly, there is nowhere in worldwide statistics & in the record-keeping world that a number exists even close to five million people dying of heat per year.  The highest statistical number was 356,000, and the lowest statistical number was 40,000.

You need to understand that climate doomsayers outright lie about the facts.  And of course, the number 1 piece of evidence proving these doomsayers to be liars are the newspaper editions of the 1870s, 1890s, 1900s, 1910s, 1920s, and 1930s, when it comes to heat ... and the editions of the 1940s, 1960s, and 1970s concerning the temperature decline which was correctly reported in the Briffa temperature graph, but which was fraudulently omitted from Michael Mann's blatantly fraudulent hockey stick graph.  Then comes almanacs, chronicles, captains' logs, and even monastery receipts.  Those receipts proved that grapes were being successful grown in Northern England and Denmark, during the Medieval centuries.

Briffa Included the Temperature Decline of the 1960s and 1970s

Mention of the Briffa graph was already addressed at the Blue Marble Album, and there is a search box at the top right-hand corner of the Blue Marble website.

The doomsayers' claim of a Western US drought worse than anything in the past 1,200 years

The West has been known to get yearly Monsoons as recently as last year (2022).  If there presently is the worst drought in 1,200 years, then Arizona, New Mexico, Nevada, California, and Utah would have become ghost town states, by now.  Texas would be the land of the great climate exodus, with Texas "climate refugees" endlessly rolling into Louisiana.  Yet, the population of Texas has grown, along with those of Nevada and Utah.

Such a drought would have been front page news, with graphic photography that can fill a museum.  We've had no such iconic American drought photos since 1936, except for some California fire photos & videos which reminded us that neglected fallen-trees become dried kindling that does a much better job than do blue-tip matches, when it comes to starting and perpetuating a massive fire.

The government employees, grantees, and contractors who make these "alarming climate calamity" predictions get LOTS OF TAXPAYER DOLLARS, if and only if they claim that things are terrible and that the world's going to end soon without the American taxpayer shelling-out billions more (to the exact same scientists who failed to decrease co2 in the past 22 years), to save the planet.

Conversely, those same people get no taxpayer money at all, if they say that the climate is under control ... and that there is no climate crisis today any worse than there was in the 1500s or in the 1700s or in the 1900s.  So, they cry out the most profitable phrase of them all, namely "Climate Wolf!"  

In the alternate, they cry-out, "The sky is falling, from all that co2 up there" --- all one-half of one percent of it in the Troposphere (0.042%)... and much less than 0.042% in the Stratosphere.  As a result, an entire generation of useful idiots joined the political movement of the enriched doomsayer scientists and the heavily enriched non-scientist activists.  

That generation will be expected to pay-off the overwhelming American national debt of $32,000,000,000,000 ... thanks to the 108th U.S. Congress all the way to the 117th U.S. Congress, and all of the long-term politicians who inhabited the U.S. Congress from 2003 to 2022.  The youth of today will have to pay the bill for all of the unjust enrichment that scientists and activists enjoyed, under the claim that we are in a climate crisis.

Australia & America:  A climate world apart, due to the Coriolis Effect

Concerning Michael Mann's audacity in stating that both the American West and Australia are going to very soon create mass sums of climate refugees, let's review:   Firstly, he and Hansen and even Gore stated similar things years prior, and this has not happened.

Secondly, due to the existence of  ENSO (already mentioned multiple times at the Blue Marble Album and elsewhere), the weather of Australia and Western America has "an inverse relationship."  So too is this the case with Indonesia and America.  That is to say, the opposite happens in Australia to that which happens in the American West.  Indonesia, too.  Those two general geographic territories are not on the same page.  After all, look at a globe or a world map.  The only way in which these two different and very distant parts of Planet Earth can have the same weather is if and only if Planet Earth suddenly becomes flat.

The reality is that, from 1895 to the Year 2010, an average of 14% of America endured a D2 drought (severe) and/or a D3 drought (extreme), constantly.  Of course, co2 levels were quite low from the 1890s to the 1920s to the wartime 40s and even during the Vietnam-era 1960s.  In fact, even in 1965, when the Beatles made world  history, the co2 count was 100 parts-per-million LOWER than it is today.  Even when the co2 count was below 300 ppm, the American West hosted long-term droughts, in the plural, long before the arrival of the European explorers. 

This indicates that somewhere in the continent of America there are always drought conditions.  This includes today.  As for the Spring of 2023, where would the drought be, if not in the former Wild Wild West?  ANS:  For mid to late May 2023, try Kansas and Oklahoma, as well as the Tampa Bay area, ironically enough.  Florida was supposed to have gotten a thousand year storm in April.  Yet, the West Coast of that State is in need of rainfall in May ... of the same year.  True thousand year storms aren't so narrow in scope.

USA, May 2023.  Look at the "Bread Basket of America" and remember the 14% observation.

Okay then, back to the claim that the American West has been under a dreadful drought for decades.  Well, if this is the case, then the water levels of all the dams and/or tributary lakes and/or reservoirs in the West will be drained down to their dead pool levels.  The reality is that no such thing is even closely occurring out West, despite the increase in a water-consuming population there, dating back to the opening of Lake Mead and the Hoover Dam.  Look for yourself.  BTW, there is an article (discourse or post or writing) on Lake Mead at the Blue Marble Album.  This is why it isn't mentioned in this post.  And of course, the Blue Marble Album still has a search box at its top right-hand side.

State by State Analysis

Firstly, New Mexico was mentioned by name as being a sovereign state severely afflicted by drought. Well, its four major dams are almost topped-off.  Where's the drought there?

Note:  The Navajo Dam is on the San Juan RIVER.  That river is a tributary river to the famous Colorado River.  Plus, the Ute Dam is on the Canadian River, in Logan, N.M. That river is a major tributary river to the Arkansas River.  The Ute Dam was constructed in 1963.

 
Let's see the sovereign state of California which is said to be in the death-throes of drought. It looks like you have a greater chance of drowning in California than dying of dehydration there.

 
Utah was also reported as being severely water-deprived more than usual.  False report.

Arizona was said to be in really really desperate conditions:

And next, Oregon. Drought?  What drought?

Texas was said to be one big dried-out desert.  Well, if there were no water there, there wouldn't be people there, either.  It appears that there's a lot of water in dry dry Texas.  Let's see for ourselves:

Colorado was mentioned too, in all of the doomsday reporting.  Let's see how doomsdayish Colorado looks in the Springtime of 2023. 
Do you get the message, yet?  Or have you been so severely brainwashed by commercial TV, the American Public School System, Michael Mann, Jim Hansen, John Kerry, & Al Gore that you are incapable of thinking your own free thoughts?   Do you miss your own personal opinion, or do you bind yourself to whatever your fifth grade teacher told you to do for the rest of your life, in the name of  your carbon blueprint, for the sake of an atmosphere which is already 99.9734% carbon-free?
  
Also for the record, the most recent End of the World prediction ...
 
... before the 2030 end-of-the-world prediction ... before the 2020 Glacier National Park failed prediction ... before the failed Maldives-sinking-in-the-ocean prediction for 2018 ... before the failed Ice-free Arctic prediction assigned for the Year 2014 ... 
 
... there was a doomsday prediction for the Year 2000, and it came from the U.N. in 1989.  Observe:  "... official says entire nations could be wiped off the Face of the Earth by rising sea levels if the global warming trend is not reversed by the Year 2000."  That prediction was yet another FALSE PROPHECY.  And the false prophesying continues. 

The world is always coming to an end, when it comes to money-grabbing activists and unemployed scientists.   The truth is that you have more of a chance of dying during a Nuclear Winter than during a phrase of Global Warming.  Such phases have come in cycles, mostly due to multi-decadal ocean oscillations and perhaps due to sunspot activity.  The opposite thereof was the case between the Years 1645 and 1710, when sunspot activity was often on vacation, and when ice festivals on the Thames River were an easily accommodated Winter tradition.

This trend of climate doomsayer theft-by-deception has been ongoing for over THIRTY-FIVE YEARS.  Some of us are old enough to have remembered the original bull crap.  Others are not old enough to have remembered, and they ended up making worldwide jackasses out of themselves on national & international TV.
 
Well, at least the CO2 police assigned the predicted doom-events to be even-numbered years ending in zero.  This includes the Next End of the World (having been assigned the Year 2030) and the Former End of "Entire Nations" (having been assigned to the Year 2000), as well as the Extinction of Glacier National Park's several glaciers (predicted to be gone by 2020.)  By the way, are those pesky things still up there? 

March 21, 2025

California Grape Harvest: Exceptional Quality. India: Record high rice production. USA: Near-record corn harvest. Brazil: Record Soy Crop. Elsewhere varies.

Above:  The true power of CO2

 As of recent, you were witnessing hyper-exaggerations, false-light reporting, and sleight-of-hand deceptions from the media, throughout the summer of 2022, 2023 and 2024.  And these ever-so-coincidentally were the Biden-Harris Years.  Well, as far back as 1988, Biden was cited & sighted for being a liar.  And throughout the 2024 presidential campaign, all that Kamala Harris did was lie.  I have her many lies detailed in other posts.

Well, despite the climate doomsday diatribes of Harris-Walz, the 2024 grape harvest in California was defined as EXCEPTIONAL QUALITY.  Plus, it was reported that "Texas wine grape producers are celebrating one of the best harvests in the past five years."  No such things are possible during a climate crisis.  

The actual impossibility of 2024 was that it was impossible to hear Kamala Harris ever speak the truth about anything she said.  This has already been detailed in multiple posts, at the Blue Marble Album.  

For now, it's important to point-out the success of some of 2024's harvests, as well as pointing out the absence of any massive crop failures and deadly famine.   The End of the World, as is defined by Greta Thunberg, has been cancelled for the Year 2024.  Maybe next year, Greta.    


As far as goes Asia, India continued to enjoy record-high rice production, in 2024.  China enjoyed rice harvest increases, too.  

Meanwhile, India had a 14% decrease in sugar production.   Meanwhile, the other major sugar producer, Brazil, had a 5% decline projected for the 2024-25 season.  But, those are not end-of-the-world stats. 

It's wrong to hyper-exaggerate.  Crop disaster is when yields decline year after year after year.  The problem with modern farming is not failed crop yields.  It's too much nitrogen being used.  That is the pivotal debate at present.


Even in Europe, the 2024 grape quality was defined as excellent & high, while the harvest yield was very much less than usual.  For those familiar with farming, the 2024 European grape harvest was reminiscent of the usual harvest for Moroccan olives.

Even concerning the European Union olive harvest, with Spain being the top producer thereof, it was a healthy harvest in the most recent statistical reports.  Those reports cover 2023.  

And concerning 2023, the European Union produced ... harvested ... as many grains as in 2022, even though 2022 was a lean year.  But, if you look at the charting of the EU harvest stats, it certainly is not the End of the World.  If 2023 were anywhere near the hottest year in 2,000 years, we would have had failed crops all throughout at least one hemisphere of Planet Earth.

The wheat crops remained healthy.  Maize was on the rebound. Oats were low.  None the less, the grain harvest record for the EU, for Record High Year 2014, was at 307.9 million tonnes.  The 2023 harvest was 271 million tonnes.
England had mixed results in 2024, comprising two super excellent crop yields, one small gain in one other crop yield, and three significant crop declines.  However, the low yields of three of England's crops did not trigger a famine.  England was able to import grains.  This means that there were healthy harvests elsewhere, and in order for there to be the declaration of a Global Climate Crisis, all nations have to be harvesting low yields.  

Then comes the Southern Hemisphere, as Brazil is projected to harvest a record soy crop

Extra, extra, read all about it here.  It's projected to be 172 million tons this year ... 2025 ... while the Northern Hemisphere has its Springtime.  Brazil was originally projected to yield 166 tons, this year.  Thus, there's no long-term climate crisis in Brazil.


There have been high yields throughout Planet Earth in 2024, as well as some low yields.  After all, the world is round and its weather varies per season, per latitude, per sunspot emissions, per the state of the Equatorial ocean currents, per state of the Earth's various surfaces.

Today's inarticulate media of very low, air-headed intelligence

Today's media blames every weather event on co2.  In 1901, the people who inhabited the birthplace of the Renaissance ... namely Italy ... knew that the heat came from Sirocco Winds.  A Sirocco Wind is one that comes from the Sahara.  

Heat in the Mediterranean has been attributed to Sahara Winds throughout the centuries.  This sounds much more logical than blaming a trace gas that exists in the atmosphere at less than 1/2 of 1% and which is incapable of retaining infrared heat when it is going through a symmetric molecular dipolar vibration, concerning its two oxygen atoms.  That vibrational mode thing has already been explained here, at the Blue Marble Album.

In the Summer of 2023, you witnessed a heat anomaly summer.  But, you did NOT witness the hottest summer in the history of the world ... or of mankind ... or even of Italy.  You did NOT witness the Planet Earth's atmosphere reaching a point of no-return.  Instead, you were witnessing climate activists in search of taxpayer funding, by means of marketing fear of the End of the World.  You were witnessing networks looking for high ratings, under the belief that "fear sales."  You were witnessing politicians trying to get some of that $370 BILLION Congressional climate outlay into their districts before re-election time, in 2024. 

Average Trends are what statistically counts

BTW, average temperatures ... where the average temperatures are in the 90s and even 100s ... do NOT constitute a heat anomaly.  Thus, 111F in Baghdad is NOT an end-of-the-world climate-crisis heatwave.  It's the same old same old for Baghdad.  That range of July heat was ongoing in Baghdad, even before the invention of the automobile ...  when the most popular form of transportation there was none other than ===> the flying carpet.  And for you activists who have no sense of humor, that was the aforesaid joke.

None the less, a few hours before posting this, I was speaking to three natives of India, and once again, I was told that they are used to 100+ Fahrenheit degrees summer days.  They also feel chilly in 72F weather, when a London native would feel fine.   I was also reminded of the painful cold of the Himalayan region.

Plus, 97F in Dallas is NOT an anomalous heatwave that guarantees the end of the world, either.  The historical monthly average in July for Dallas is 97F.  And concerning Dallas in July, it's easy to see why its NFL franchise chose to hold its yearly summer camps in Oxnard California.  When I was in Oxnard, one late July week, I had to turn on the motel heater in the morning, because it was chilly there during the  a.m. hours in July.  And in order for me to get to Chilly Oxnard, I had to drive through the Mohave Desert, during a 102 degree Fahrenheit afternoon.

Now, you know that North Africa, Arabia, the majority of India, parts of China, Arizona, Texas, Rome, Granada, Seville, Madrid, and even Wichita Kansas will be hot every summer.  In fact, the historical monthly average for Wichita in July is 93F.  

None the less, it's the departure from average temperatures that counts, along with the number of cities enduring heat anomalies simultaneously ... as well as the frequency, in terms of years.  

It's a broad scale equation; not a narrowed one of strategically selected cities that absorb asphalt from every angle, causing the Urban Heat Island Effect.  In as much, there are instances of surface temperature rise that have nothing to do with co2.  It has to do with asphalt.

For now, there are people who need to see that there was NOT a widespread occurrence of record high temperature "anomalies" in July of 2023.  So, take a look at the following photocopies of official temperature reports throughout the world.  You will easily see that the claim of July 4, 2023 being the warmest day in 125,000 years is the next phase of lying propaganda from talentless writers, talentless UN reps, and talentless activists, as well as talentless thinkers.

Even 1980 was a blazing summer for Dallas, when the thermometers rose over 100F, for 42 consecutive days.  And of course, in 1977, Athens Greece reached 117F.  Meanwhile, in the year prior ... 1976 ... England saw anomaly temps and Paris underwent tragedy due to heat.  

Then comes consideration of the Medieval Warm Period, the Roman Warm Period, and the Minoan Warm Period.  Weather history points to the conclusion that Climate is Cyclical and CO2 is the bringer of life, in bringing forth photosynthesis.  Also take note that the "Climate Activists" ignore the amount of Mercury, PM2.5, Nitrogen Oxides, Ground-Level Ozone, Benzenes, Sulfur Dioxide, etc  ... which is far more important and much more technical to address. And then there is today's glut of synthetic chemicals which affects indoor life. 

Incidentally, PM2.5 is Particulate Matter smaller than 2.5 microns in diameter, and its the fine particles that kill people.  Well, ozone has killed, also.  But, good luck finding solo stats on ozone deaths.  Ozone is added to the PM2.5.  Even at that, the estimate is that ozone causes about 470,000 premature deaths per year. 

None the less, PM2.5 is a serious pollutant for beginners to study.  Fine particulates do kill.  In fact, all of you climate activists out there should transfer your studies and concerns from CO2 to PM2.5.

March 20, 2025

Oct 2023: Bumper Crops, Record Crops, "Better-than-Expected" Crops prove the Global Boiling speeches to be a pack of lies told by a pack of wolves.

MODERN England.  Truly Beautiful.  No Climate Crisis here.

Let's begin with England in October of 2023.  This is because the media claimed in July of 2022 that a climate tipping point of no-return had finally reached England, causing it to burn out-of-control.  This means that England would still be burning out-of-control today, if the media were telling the truth.  This is because the co2 count in the sky is said to be the cause of all evil on Earth, by people who make outrageously large sums of money simply by saying so, and the co2 count today is the same as it was in July of 2022.  

This would also translate into a nation such as England entering into an advanced famine stage, with failed crops all over the country ... from Coast to British Coast ...  amidst fires burning down rows of houses, as well as burning down forest after forest  Well, at last count, the Nation of England, in the Autumn of 2023, either had a near-record bumper crop harvest or had a record high crop yield of it's winemaking grapes.  Final statistics take a while to officially submit for the record keeping files.  

At the least, England did not come close to the doom and destruction that the 2022 media said it was soon to encounter.  Today's media members are nothing more than lying propagandists who incite emotional distress, riots, and other forms of violence, along with the massive waste of taxpayer dollars and those pointlessly asinine acts such as gluing oneself to priceless masterpiece paintings.

'Amazing' harvest with 'unbelievable' yields in England (Oct 3rd, 2023)

- - -

British winemakers predict a record-breaking grape harvest

- - -

A Norfolk England's Record High Grape Harvest, in 2023

- - -

World-renowned West Sussex sparkling wine producer celebrates most expansive harvest to date

- - - 

2023 West Sussex vineyard harvest nothing short of phenomenal

(There are more links below concerning the Autumn of 2023 agricultural news)

The Good Ole USA has record crop production in 2023, too

Concerning the United States farm statistics for 2023, the USDA reported that American corn production reached an all-time high of 15,234,000,000 bushels.  Soybean production increased by 25 million bushels, to the tune of 4.13 BILLION bushel this year.  This negates the reliability of the UN which claimed that the world reached a climate crisis stage that was going to include significant crop failure.  

The USDA awaits statistical confirmation of the 2023 report.  None the less, the "pending" 2023 American crop production record, if confirmed, will surpass 2016's record of 15.148 billion bushels produced.

https://www.reuters.com/markets/commodities/bumper-us-corn-harvest-sinks-prices-pushes-global-supply-surplus-2023-10-19/

- - -

https://www.dtnpf.com/agriculture/web/ag/news/article/2023/11/09/usda-releases-november-crop-wasde

- - -

https://farmpolicynews.illinois.edu/2023/11/record-u-s-corn-harvest-expected-while-ukraine-grain-exports-fall-despite-recent-improvements/

Whatever be the final numbers, the US growers predominately did the opposite of the expectations of the UN and of all the other Climate Doomsayers.   This thus far teaches us that the UN continues to lie to humanity, much like it did during the Iraqi Weapons of Mass Destruction Hoax.  The only difference between then and now is that co2 is now declared the new weapon of mass destruction ...

1] even though co2 only comprises 0.042% of the atmosphere,  ...

2] and even though co2 activates the photosynthesis which is needed for every plant, tree, and farm crop to come to life and grow,  ... 

3] and even though co2 is incapable of retaining infrared heat during one of its three vibrational modes which are also known as co2's three "dipole moments."  CO2 is NOT the infrared steel trap that propagandists made it out to be.  Water Vapor is the only decisive greenhouse gas.  It comprises 90% of all greenhouse gases, by volume.

Back to England & Farmland Demand There

Now, if the July 2022 reporters were correct in their doomsday prognoses, then no one would have wanted to be managers or owners of British farmland any longer.  Farmland in England, Scotland, and Wales would be selling at an extreme discount today.  In as much, if the Bill-Gates-Funded media outlets in England were telling the truth about the British climate in 2022, then how do you explain the following recent news release on British farmland demand by actual British agricultural reporters?

Oxford farmland sells for 45% above guide price at online auction. (October 25, 2023)

- - -

UK farmland values hit record high

- - -

Arable Farmland in England: Reaches record high avg value in first half of 2023.

And why would someone want to own British farmland, after the media told humanity that England was drying-out and catching on fire like never before?  Well, three photos ... actually statistical graphs ... are worth 3,000 words, in answering that question:

The United Kingdom's sugar beet harvest has risen at a rate similar to co2.  The crops of Russia did too.
There was a massive leap in oat crop production through the decades, where Ireland & the United Kingdom individually exceeded China, the Ukraine, the United States, Brazil, Russia, and most other nations in per-hectare oat productivity.  If there were a climate crisis in England or Ireland, this would not have occurred.  Even in the years where England had less production than the year or two prior, it still out-produced the major nations of the Earth such as Russia, China, and the U.S. --- on a per-hectare basis.
Throughout the past 62 years, the tomato crop yields of England (individually) and those of Ireland (individually) exceeded that of Italy, in per-hectare production.  Those two nations each outgrew the United States individually, too.

Now, 2022 was reported by ratings-seeker journalists as the beginning of the end ... in everything.  They announced the arrival of doom, death, and destruction for mankind, because mankind did not ban all gasoline engines, diesel engines, natural gas stoves, and cows.  Well, a doom, death, and destruction year is not accompanied by a worldwide grape harvest of 80.1 MILLION TONNES ... including the global table grape production rising at a rate of 7%.  For clarification purposes, the 80.1 million tonnes was the 2022 production . . . the year when London was said to be on fire and irrevocably doomed.

Global Grape Production in 2022 Reached the Second Highest Peak of the Last Twenty Years

- - -

Global table grape production estimate up 7% for 2022-23 ... when the media claimed that Earth's climate reached a tipping point that would result in crop failures worldwide, inter alia.

The Great London Lie of 2022

As far as go fires in 2023, the 607 square mile region known as Greater London is en route to having its least number of yearly fires ... or its second least number ... in it's record-keeping history.  This is occurring one year after the harrowing tale of London irretrievably burning out of control, due to a molecule that comprises no more than 0.042% of the Earth's atmosphere and whose radiative forcing was reported by certified scientists to be no more than 3,7 watts per meter squared.  

The Year 2021, hypocritically enough, was the year with the least number of fires.  This shows that  the July 2022 London-is-Burning reports were the works of con-artists too lazy to study history --- and too lazy to check even recent statistics.  Moreover, the Year 2021 was the year of Antarctica's coldest winter in recorded history.  

Greater London fires had long since been cut in half.  This occurred when the Year 2013 came into existence.  Thus, fire incidents had been decreasing steadily & significantly for a nine year period, spanning from 2004 to 2013.  Therefore, by the time 2014 arrived, Greater London was having an average of 100 fires LESS PER DAY than in 2004 and in previous years spanning back to the 1960s.  Yet, the media of 2022 had the audacity to claim the opposite.

The Actual Greater London Incident Report of July 19, 2022.    

- - -

The Great London-is-Burning Lie of July 19, 2022     

Also take note and absorb into your thought process the following nine-year old news report:

                     *   *   *   *   *   *   *   *   *   *   *   *   *   *   *   *   *   *   *   * 
Above:  As far back as 2014, the London Fire Brigade was bragging over the intense decrease in fires throughout its 607 square mile jurisdiction.  The year of the least amount of fires ended up being the Year 2021.  Then came the London-is-Burning Clown Show of 2022, when the exact opposite of the truth was reported.  In fact, 2023 is en route to being the new record low year.  Meanwhile,  2022 was the 4th lowest year.  This makes the July 2022 doomsday report an even bigger lie.

Of course, the 2022 media all claimed that co2 was drying-out England and California, causing fires and failed crops.  Well, CO2 exists in the air at a percentage of 4/10th of a percent.; specifically (42/100,000 or 21/50,000).   At present atmospheric co2 is at 420 ppm --- 0.042%.   That amounts to this much ======>      

The orange in the pie chart represents 1,000,000 parts of molecular matter in the atmosphere (minus the co2 amount which is 420ppm.)  The vertical white sliver represents the volume of co2 in the atmosphere.  

For those who were brainwashed by Al Gore & the Michael Mann who was NEVER the winner or co-winner of any Nobel Science Prize, here is the same statistic in a different colored pie chart.  This might help you understand the con game that has been played since 1988.  And remember, 420 ppm = 42/100,000 = 0.042%.  That's all the co2 that's in the sky. 
The blue sliver represents the amount of co2 in the atmosphere.  The gray disk represents the rest of the atmosphere.  Thus, 999,580 ppm of the molecules in the sky are NOT co2.  This means that over 99.9% of the atmosphere is already carbon-free.  You simply have to address surface level pollutants such as mercury, lead, cadmium, unfiltered fly-ash, and sulfur dioxide, as well as the glut of synthetic chemicals throughout Planet Earth.  However, lazy people will NOT do this.  

As far as concerns greenhouse gases, 90% of all greenhouse gases, by volume, is WATER VAPOR.  In order to substantially decrease greenhouses gases from the atmosphere, you need to get rid of a sizable amount of ocean water.  Where will you put it?

Concerning the temperature of Planet Earth's lower troposphere, it is true that September 2023 was the month with the highest one-month temperature anomaly in the Satellite Era.  It amounted to a positive 1.62 degree Fahrenheit difference from the usual September temps.  In fact, the summer months of 2023 were all anomalous on the high end of the temperature spectrum.  This would be in keeping with the fact that the world is simultaneously being driven by [1] El Nino & [2] one of the higher years  in the 11Yr Sunspot Cycle and/or in SC25.  

Speaking of the 11 Year Sunspot Cycle, eleven years prior was the great heat wave year of 2012, where I personally saw how narrow became the Mississippi River, by September of 2012.  The Year 2012 was the same year when I was in Tulsa at 106F ... and in Arkansas at 104F ... and in the Mojava Desert at 102F ... and in the desert heat of New Mexico and Arizona.  Shortly thereafter came the year with the highest amount of Antarctic Sea Ice Extent in recorded history, showing once again that climate is cyclical . . . like the 11 Year Sunspot CYCLE describes.

Climate activists have constantly said that the end of the world is right around the corner because of the burning of fossil fuels.  Examples: [1] The sinking of the Maldives is right around the corner, and has been so, since 1988 ...  [2] The end of the glaciers at Glacier National is right around the corner, and has been so since the early 20th Century ...  [3] Lower Manhattan will be underwater any day now ....  [4] CO2 is burning down England ... [5] Crop failure will be as common as those Category 6 hurricanes that Al Gore predicted 17 years ago.  Plus came the assured report that ===>

[6] Antarctica is undergoing an extreme once-in-a-seven-million year ice melt event, even though the amount of its sea ice extent in 2023 was larger than the landmass of Russia, meaning that Antarctic sea ice extent & the Antarctic continental ice sheet combined covered an area of 11.8 MILLION SQUARE MILES, thereby exceeding the size of the entire Antarctic Circle by 4.7 million square miles. 

Now, the essence of the "Global Warming" Doomsday Prediction, as it applies to agriculture, is per unit growth --- per capita yields --- per unit efficiency.  Translated into modern statistics, it's a matter of per-hectare-yields declining to scant amounts, due to the very co2 which brings photosynthesis to the plant world and which is used in high degree inside professional greenhouses, so that the vegetation there will grow abundantly.

As far as goes England-Scotland-Wales and wheat, both the United Kingdom & neighboring Ireland had masterful unit efficiency, along with oats, sugar beets, and even the stereotypical Italian tomato.  

Now, China & India outgrow the world in total wheat yields (aka aggregate production).  But they use much more land for planting wheat than does England.  All in all, if the Climate Doomsayers such as David Attenborough, Al Gore, Michael Mann, and Charles III were correct in their predictions, then England & Ireland would NOT have prevailed as masters of per-acre growth efficiency.

Per-hectare yields skyrocket in England, Ireland, China, and India, while atmospheric co2 increases.  This is opposite of the doomsday scenario predicted by Gore, Mann, Attenborough, Hansen, Ehrlich, and his royal highness, Charles the Adulterer.
Furthermore, keep in mind that there has been easily-provable data tampering of the historic weather  records of old which were replaced with the "amended" charts, graphs, & tables.  This was even admitted on video, by a government employee who asserted that the changing of the weather report charts & graphs of old was warranted.  HOWEVER, the "amended" charts, graphs, & tables do NOT match the numerous newspaper, almanac, & magazine news reports of the weather, concerning the time spans "amended" on the various charts & graphs.  

The Years 1921-22.  Reported as extreme heat & Arctic ice melt years in all of the newspapers, magazines, and other journals.  Declared amongst the coldest by Michael "Hockey Sticks" Mann.

The prime example is that the Years 1921 & 1922 are regarded as the coldest years since the 17th Century, on the hockey stick graph of Michael Mann.  Well, 1921 & '22 were blazingly hot years, marked by extreme Arctic melting & glacier melt.  Newspaper after newspaper & journal after journal reported on the heat of the early Twentieth Century.  Then magazines covered the extreme cold that encompassed the 1940s, the 1960s, and most of the 1970s.  So, proof that you are being deliberately deceived exists in vast volumes of newspaper & magazine archives throughhout the world.  

Another example of data tampering is that the US forest fire (wildfire) history graph now omits the Years 1926 to 1982.  It now starts at 1983, the year of the lowest amount of wildfires.  This is how dishonest & detrimental to humanity the Biden Administration is.  After all, the Biden Administration is the administration that hunted-down Roman Catholics, all the while spying on them ... literally.  The asininity of this is that Roman Catholic masses are public, and Roman Catholic colleges all have libraries with Roman Catholic literature in them.  You don't have to spy on Catholics.  You simply have to go to Catholic libraries.  

And the greatest asininity of the Biden Era FBI was the claim that Roman Catholics and Born-again Christian Southern Baptist gun owners were going to get together and shoot up America.  This is because Born-again Christians severely hate and despise everything about Catholicism --- from the Pope to the priesthood to Marian Devotion to saint canonization to Thomas Aquinas to the Sacrament of Confession to Holy Communion to those many Sacred Heart of Jesus statues to the Code of Canon Law to the buildings of Vatican City.  

If the Born-again Christians are going to go around America and start blowing things up, they will start doing so, by blowing-up the Catholic Churches they absolutely despise, all the while gunning down priests and nuns.  The FBI agents of today couldn't have been so stupid as to not have known about the centuries of "Catholic/Protestant Wars," and how the Protestant hatred of Catholicism still exists in the Southern Baptist "Born-again" residents of America.

In addition, there is a person or two who worked in science and who kept the original weather charts & climate graphs of old which show that it was much hotter in the 1930s, 1920s, 1910s, 1900s, 1890s, and 1870s than what the newer editions of the historic weather charts show.  And of course, "He who controls the past controls the future." (George Orwell, 1948 or '49)  Take note that the 1880s were purposely omitted by me.  In addition, the 1860s were drought years, as were the 1850s.  In fact, the entire America Civil War was fought during a drought.

None the less, the Al Gore Choir stated that the rise in atmospheric co2 will cause the "global warming" which will cause crop failure worldwide.  For example, the UN Sec General stated in 2023 that we are in a "global boiling phase," despite the record cold of the early months of 2023, the record snowfall in 2023, and the seemingly miraculous replenishment of numerous dam reservoirs.  So, it is reasonable to expect that the coming record cold weather phases of 2024, 2025 and 2026 will be entirely ignored as if they never occurred.  It's all a matter of False Light Hyper-Exaggeration.  An element of such a con game is called "cherry picking."  This phrase gives cherry growers a bad name.

Abundant crop yields make Al Gore, Michael Mann, & the UN Sec General look bad --- like swindlers.

All in all, con artists are not that good at hiding their con games, unless someone in power & influence becomes an accomplice in hiding the true records that have been altered.  As Voltaire and others in history stated, "If you tell a lie for a long-enough period of time, it will be construed as the truth."  And of course, since 1988 ... and even for a brief period in 1983 ... we have been repetitively told the global warming talking points which are askew from the actual textbook literature, as well as being at variance with the original weather graphs & temperature charts of old ... as well as being contrary to the newspaper reports of old which reported on the horrendous heat of 1896, 1901, 1905, 1911, 1913, 1921, 1922, 1931, 1934, and 1936 which transpired when co2 levels were much lower than today.

During the 2023 "Chicken Little" speeches of politicians and news network commentators, the 2023 crop yields were NOT reflecting the predicted doom.  And of course, according to the climate hysteria networks, all agriculture should have been parched & withered, at least up to the 54th Parallel in Europe, the 48th Parallel in America, and the 44th Parallel in Asia.  Yet, crop success is par for the course this year for the most-part.  

Of course, southwest Mississippi, Louisiana & central southeastern Texas were enduring severe drought conditions, even in September of 2023.  Likewise, Missouri was hit by drought conditions in 2023, also.  In fact, Virginia, Wisconsin, Minnesota, and Illinois each had a decrease in what still turned out to be plentiful crop yields, as none of those states had more than a 9% decrease in corn harvest yields.  Even drought-ridden Louisiana had a corn crop gain of 2.9% in 2023.  Likwise, drought-ridden Mississippi had a 10.3% gain in its corn harvest in 2023.

On the opposite side of the accountants' ledger is the 2023 corn yield increases in certain American states which included percentage numbers ranging from a positive 41.5% to +36.8% to +20.5% to +18% to +16.4%, etc.  The high yielding states included Texas, Oklahoma, Mississippi, Alabama, Tennessee, Kentucky, both of the Carolinas, and even New York State.  Moreover, Kansas was in the drought mode early.  But, it rebounded to the point of its 2023 corn harvest yielding 6% more than it did in 2022.

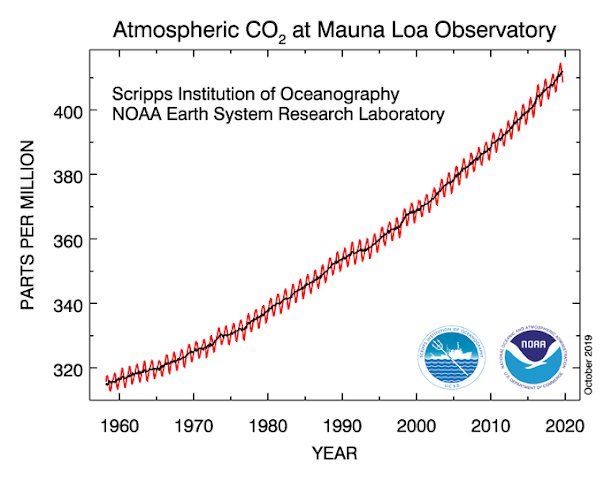
The graph above also shows that each one of the "climate conferences" throughout recent decades was a failure and a waste of time.  Despite the obsession with reducing from the atmosphere the trace amount of co2 which does exist there, the co2 level continued to rise as if there were never any climate conferences.  All of that grand-standing & fanfare resulted in nothing, except for Al Gore and others getting rich while giving nothing back to society, in return for their gains of wealth.
Other nations have had the same 45 degree upward slope of increase since 1960, for the exact  same crop.  The rise in corn production has been parallel to the rise in the atmospheric co2 level.  As the co2 levels rose, so too did corn crop yields.
2023 is also the year of the record-breaking sugar beet crop in the good ole U.S. of A.

https://www.agweek.com/news/sugarbeet/american-crystal-sugar-has-a-record-breaking-2023-sugarbeet-crop

Let's go to the 2023 soybean harvest:

Young Farmer Breaks Soybean World Record with Stunning 206-Bushel Yield  (Note: This means 206 bushels per acre, in southwestern Georgia.  The irony is that the media was claiming that "climate change" was destroying Georgia, being that a frost came after the peaches blossomed in Georgia this year ... in 2023.)  

***Oh, and concerning the 2023 Georgia peach crop, 76% of Georgia's Springtime crop survived and was harvested.  It wasn't a 100% loss, as the climate propagandists would want you to believe.  It wasn't a 50% loss that reasonable people would suspect.  It was a 24% loss which left some hope behind.  This type of peach crop loss is a part of Georgia history, in intervals of time.  Such a thing has happened from time to time, and it did so when the co2 level was much lower than it is today.***

More on the 2023 Soybean Crops

https://www.nass.usda.gov/Charts_and_Maps/graphics/soymap.pdf

Now for Canola 

North Dakota nears record canola yields, Oct 17, 2023

And for Wheat ...

2023 Wheat harvest shocks with better-than-expected yields, Oct 10, 2023

... as well as the grain harvest in general

Russia eyes its second-largest grain harvest of 140 million tonnes in 2023

And for Rice 

Full rice crop set to win back lost markets; Oct 18, 2023

Then comes a 2023 record high wheat & barley yield for the Guinness Book of World Records.  

https://www.abc.net.au/news/2023-02-09/tim-layman-guiness-world-records-wheat-barley-yields/101950212

CO2 did NOT dry-out England to the point of causing an untold number of out-of-control fires.  As was previously mentioned, this year is the year when the Greater London Area will have either its lowest number of fires or its second lowest number.  Furthermore, the 2023 British grape crop yield proves that the July 2022 report of London drying-out & burning-down was a complete fraud.  

For the record, the number of Greater London fires in 2021 was 14,929.  In 1976, the number was over 60,000.  In the Years 1970, 1973, 1983, 1985, 1989, 1990, 1995, 2001, 2003, and in a few other years, the number of fires was over 50,000 each individual year.  In 2004, there were 40,000 fires.  In fact, there were over 40,000 fires each individual year in 1969, 1971, 1972, 1980, 1981, 1986, 1987, 1991, 1992, 1998, 1999, and a few other ones.

Thus far, as of October 20th, 2023, the number of Greater London fires has been only 12,567.  In 2022, when the media claimed that the world was coming to an end, there was only 19,298.  You need to come to terms with the reality that the media of the 2020's is nothing but a crew of liars who incite violence ... or despair.  They must be removed from their posts, held to accountability, and then be replaced by reasonably honest people.

Take note that all of the years from 1969 to 2004 each had more than 40,000 yearly fires.  A number of year had over 50,000 fires, and 1976 had over 60,000 fires.  The 19,298 fires of 2022, as well as the 14,000+ fires of 2021, and the 12,567 fires thus far in 2023 do NOT even compare to any one of those 35 consecutive years.  Fires were dramatically DECREASING, while co2 was steadily increasing.


The Year 2022, when London was supposed to have been burning down.  This is 1/3 the number of fires in 1976.  This is half the fires of 2004 individually, 1998 individually, 1992 individually, etc.
Directly below:  The Greater London Incident Report as of NOVEMBER 5TH, 2023.  2023 is still en route to being the year with the lowest number of fires in Greater London's record-keeping history, thereby proving the 2022 the media doomsayers to have been very unconscionable lying con artists.  Remember that July 22, 2022 London Fire Farce was instrumental in getting the US Congress to waste an additional 370 Billion taxpayer dollars, in a "climate appropriations bill."   This amounted to Theft by Deception.

The record low was 14,929 in 2021.  Thus, the so-called England Climate Crisis Year of 2022 was sandwiched between to two lowest LFB fire years on record.  It was also followed by the year tremendous agricultural success in the same nation of England.  This shows that the UN, the Bill-Gates-funded media outlets, and the American mainstream media are presently operated by liars who need to be brought to legal accountability, not unlike the Nuremberg defendants of 1946 to 1949.
Between 1969 and 2004, Greater London had at least 40,000 fires each year.  Some years had over 50,000 fires, and the Year 1976 had over 60,000.  The Year 2023 has thus far had the lowest number since record-keeping began in 1966.  Yet, the media predicted that 2023 and beyond would be years of more numerous record-breaking fires.  

Take note the media's climate predictions turned out to be as wrong as Jim Hansen's predictions.  After all, the Maldives are still above water, and the Arctic still has a sizable area of ice at the end of each Summer ... and Lower Manhattan is still completely above water, too.

The real environmental crisis today is the glut of synthetic chemicals throughout societies ... and any unfiltered toxin coming out of coal burning plants.   In as much, don't worry about co2.  Worry about sulfur dioxide, mercury, lead, arsenic, fly ash, cadmium, beryllium, isocyanates, etc.  For now, look and see how the 2022 media predicted the opposite of what did happen in Greater London, in 2023.

Carbon dioxide did NOT cause the 103 degree Fahrenheit day of July 22, 2022, in London.  A Sirocco Wind from Northern Africa did.  If the 2022 report of England-drying-out were true, then the grape crop would have withered on the vines this year, along with the vines of many of England's 943 vineyards.  

The lesson here is that it's actually easy to prove climate con artists to be the frauds they intended to be.  Simply refer to crop yields of recent harvests and newspaper archives of old.  Moreover, concerning those people obsessed with keeping in tact the glaciers of Montana and Switzerland, as if they were holy icons, keep in mind that no crop ever grew on a glacier.  It turns out to be the case that added warmth yields wonderful things such as record high grape crop yields in England.

The 2023 Northern Hemisphere harvest reports are still young and not developed into permanent record reports.  In some parts of the world, there will be a decline in harvested crops.  This includes Italy's grape & olive crops, as well as the Merlots grapes of Bordeaux and other crops.  Yet, in other parts of the world, there will be no decline ... or else the decline will be insignificant.  Remember, the year after a record yield is always a decline.  Yet, such a yield is usually an abundant one.  

The world is round.  One land's drought is another land's rainfall, during the same time span.  If one latitude is too hot, then another latitude will compensate with crop success.

Yes, some crops were on the decline in 2022.  For example,  the United States sorghum crop was very notably lower than in 2021.  On the other hand, Israel had a tremendous crop yield in its olives, in the same Year 2022.  Also in 2022, China had a tremendously high yield with nectarines and peaches. The list of successful crops go on and on.  Official government and professional and marketplace websites are available, for the viewing.  You'll find that it's not the end-of-the-world that the abusers of political power say it is.

There's a lot of growing going on, out there

Now, as far as goes the ability to deceive you through the crop reports, know that there is a difference between the "aggregate" (total) crop yield of a nation and the "unit per acre" yield.  For example, in 2022, the United States cotton crop yield was down 16% from 2021.  Yet, the 2022 cotton crop "per acre" yield for the exact same year in America was at the record high of 947 pounds per acre.  This means that 2022 was an exceptionally good year.  A climate fraudster would only report on the 16% part, leaving out the record-breaking high of 947 lbs per acre.

Likewise, a fraudster might report on the decrease in crop yields without mentioning that a certain crop was planted in far less acreage.  For example, the 2022 America rice crop was down 16% from 2021.  However, 12% less area was used for planting rice in America, in the first place.

At the same time, keep in mind that El Nino means dry conditions for Indonesia and Australia.  So, if the Indonesian coffee crop undergoes a significant decrease, it will not have been on account of co2.  It will have been on account of the fact that El Nino means that the equatorial ocean current did a U-turn and started to go from West to East toward South America, instead of its usual "Trade Wind" direction of East to West.  See:  El Nino vs La Nina.

The Keeper of Photosynthesis

The great irony here is that, if you want to go green, you have to increase the atmospheric co2 level.  The Climate Doomsday people are trying to reduce the agent which triggers photosynthesis and plant growth throughout the world.  This policy ... and the belief-system attached to the anti-co2 policy ... is known as insanity.  Such believers should not be the heads of states or the heads of corporations.  In fact, such believers should get their heads examined ... literally.  

The Al Gore & Bill Gates parched-farmland-due-to-co2 scenario isn't out there.  Growers purposely add co2 concentrations to their greenhouses, for successful yields.  CO2 is a plant's friend.  

More important is the note that there were numerous weather & crop disasters in years and centuries past, when the atmospheric co2 level was much much lower than today.  This means that co2 doesn't drive the climate of Planet Earth.  The Sun does, in conjugation with the CORIOLIS EFFECT (vorticity) and the TILT OF THE EARTH, as well as pressure systems ... and even ocean oscillations.  Then comes water vapor.  CO2 even trails water vapor by a large margin, in driving the climate.  And it is a complete lie to state ... as Al Gore did ... that climate science is so simplex that a 12 year child can understand it.  The opposite is true.

Even where there were crop yield declines in 2023, there was massive harvesting none the less.  So, the near-future will show how much of a variance there was in 2023 between reality and climate hysteria propaganda.  Patience is required in the wait for those reports.  Hopefully, there will be no data-tampering ... or at the least, hopefully the data-saboteurs will get caught.

At present, the Climate Hysteria people are attempting to trick you into believing that the world has finally reached a tipping point involving "runaway feedbacks" that will act upon Earth as a plague of locusts.  The Al Gores of this world claim that co2 causes every type of natural disaster.  Well, some disasters require low pressure systems, while other ones require high pressure systems.  CO2 can't cause both.  So, which one is it that is caused by the trace amount of co2 in the atmosphere?  High pressure or low pressure? 

We don't have a Climate Crisis, as Michael Schellenberger and certain Nobel Prize recipients correctly stated.  We have climate con artists who literally should be criminally prosecuted, for theft by deception.  They are swindlers.  They should also be sued for the Intentional Infliction of Emotional Distress ... heaped upon schoolchildren ... and even upon the minds of impressionable college students.  

Climate Hysteria people are so tunnel-visioned & so narrow-minded, as well as being so brooding & so violence-minded, that they don't notice the beauty around humanity throughout Planet Earth.  Such beauty goes woooooosh.  It passes them, while they refuse to acknowledge it.  They refuse to acknowledge any beauty in nature, because, if they do admit that the Earth is filled with beauty and wonder, then this means that there is no climate crisis.  These are a brooding people.  Therefore, these are a dangerous people.

March 19, 2025

The UK in 2022: Increased crop yields, and NO "End of the World," "Climate Crisis," "CO2 Tipping Point," "London's-on-fire" crop failures.

Cauliflower field, Isle of Wight, southwest of Portsmouth, Sept 2022 (by "ITookSomePhotos")
Perhaps you remember the July 19, 2022 reports out of London.  [1] Pursuant to the media mouthpieces, the atmospheric CO2 level reached a tipping point.  CO2 was now causing Greater London's fire numbers to escalate, even though, in 2014, it was reported that yearly fires in the 607 square mile London vicinity were at least half of what they were in each individual year, from 1969 and 2008.  [2] None the less, the less-than-honest media mouthpieces said that England was undergoing heat like never before.  [3] Simultaneously, journalists were stating that the heat would cause crops to dry-out, turn brown, and die in massive volumes of acreage.  

A killer famine was now inevitable ... all because of that darn co2.  The Year 2022 was declared a founding date for Climate Enlightenment.  But, the reality was that it was nothing more than another year of climate activist lies, taken from a page in the Climate Con Game Handbook.  

For starters, Greater London's number of fires decreased significantly from 2008 to today.  And in 2021, Greater London had the LEAST number of yearly fires in record-keeping history.  The Year 2022 was the year with the fourth lowest yearly fires.

Keep in mind that certain journals would headline their climate doom articles with photos of a parched stalk of corn or a dried-out patch of grains.  Thus, it is always a prediction that crops will dry and die, due to the present level of co2 which is less than 1/2 of 1% of the atmosphere.  However, in the middle of July 2022, that which England was experiencing was a Sirocco Wind, and NOT a co2 attack.  A Sirocco Wind is a wind that comes out of the Sahara.  Such winds are dry.

The Year 2022 has passed, and record-keeping has continued.  This included the UK's 2022 crop yields report of December 2022.  Now, according to the climate hysteria people, England was going to have low crop yields, due to the Summer of 2022.   Well, it is once again proven that the Climate Hysteria People have no idea what they're talking about.  The UK had crop yield gains across the proverbial board.

The two photo-copies below are from an official United Kingdom government site.  Those two photo-copies illustrate yet again that the Climate Doom People spent the last 35 years failing in every one of their doomsday climate predictions.  Contrary to the theatric "dire-consequence" predictions about 2022, it turns out that wheat production, barley production, total cereal production, and oilseed production were all up, in the United Kingdom, in 2022.  

As far as goes Oats, there was a "per capita" gain at harvest time; a gain "per acre planted."  You see, in 2022, 13% less acreage was used in planting oats.  On a per capita basis ... concerning the lesser amount of land used in oat farming ... there was a 2.9% increase in the harvesting thereof.  Therefore, the only reason why the UK had 10% less oat production than in 2021 was because less land was used in the planting of oats.  All in all, these 2022 UK Crop Yield Gains are the opposite of the dire predictions of the Global Warming People ... of the Climate Change People ... of the Climate Crisis People.

In addition, the 2022 harvest of British wheat & Winter barley both contained, on average, 93.7% of the 14.5% UK moisture content standard.   Spring Barley contained, on average, 92.4% of the moisture content standard.  Oats contained, on average,  91% of the British standard.  And oilseed contained 84.4% of its  9% moisture standard content.  Thus, parched crops waving in the Autumn air throughout British farmland was not occurring in 2022.

And of course, people of reason instinctively know that an increase in atmospheric co2 will cause an increase in crop harvesting, instead of it causing the End of the World.  The UN climate activists are people from Second World and Third World countries.  Thus, they have third world minds.   It's super-easy to catch them when they are lying.  But, the big question at present is:  When are they ever telling the truth?  Well, directly below is a public transmission from a department of the United Kingdom's government.

Now for the irony of 2022:  There was one crop which yielded 18% less than in 2021.  HOWEVER, the cause of this was ...  none other than ... cold and NOT heat.  The crop was sugar beets.  

"The first two weeks of December were the coldest start to the winter since 2010, according to Britain's Met Office.  Farmers have said the cold weather damaged sugar beet crops which were still in the ground."  (Nigel  Hunt;  Reuters)

Usually, the UK produces 7.5 million tonnes.  But, in 2022, it was approx 6 million.  That's not an end-of-the-world crop failure.  

In as much, the hysterical theatrics of the media in its climate reports don't come close to the reality you see when you do something called, "go outside and look around" ... or when you study crop reports ... or hospitals admissions ... or any number of things that the media never reports above and beyond a fleeting & token amount.